- +1-315-215-1633
- sales@thebrainyinsights.com

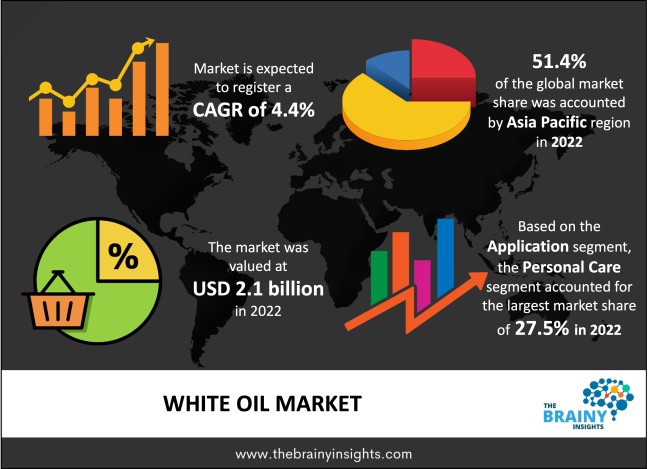
The global white oil market was valued at USD 2.1 billion in 2022 and grew at a CAGR of 4.4% from 2023 to 2032. The market is expected to reach USD 3.2 billion by 2032. Market demand is anticipated to be driven by the expanding need for goods in the pharmaceutical and personal care industries. The global primary market driver is expected to be the rising demand for items used in medicine and cosmetics. White oils are mineral oils that have undergone refinement to make them pure, stable, colorless, odorless, and non-toxic.
Given that it is secure, non-toxic, and stable, white oil is frequently utilized in medicinal formulations, such as ointments, creams, and lotions. Additionally, it goes into the creation of cosmetics including lotions, baby oils, and hair care items. White oil is also used in the food sector for a variety of applications, including lubricating, anti-foaming, and release agents. Food-grade machines and equipment frequently use it. Several industrial processes, including the creation of rubber, plastics, and textiles, use white oil as a lubricant. It is appropriate for these applications because of its high purity and stability.
Get an overview of this study by requesting a free sample
The rising demand from several end-use sectors, including medications, personal care, beauty products, processing of food, and industrial applications, is what is driving the white oil market. These industries use white oil because of its lubricating, emollient, stable, and safe qualities. The use of personal care and cosmetic items has increased due to the ongoing increase in world population, particularly in metropolitan areas. The need for white oil in goods like lotions, creams, lotions, and hair care items is driven by this demographic trend. Modern refinement and processing techniques have made it possible for producers to create high-quality white oil with better properties. These developments have improved the purity, stability, and efficiency of white oil, increasing its potential for use and stimulating market expansion.
Since white oil is made from crude oil, changes in the price of crude oil could have an impact on its market. White oil's pricing and manufacturers' profitability can be impacted by changes in oil prices by the amount it costs to produce. Due to environmental concerns, the petroleum sector, particularly the manufacture and usage of white oil, is under investigation. There is a need for more environmentally friendly substitutes since the extraction, refinement, and waste of petroleum-based goods can have an adverse effect on the environment.
Emerging economies are rapidly industrializing, urbanizing, and creating middle classes, notably in the Asia-Pacific, South America, and Africa. The demand for processed meals, personal care items, and cosmetics all of which use white oil is driven by this demographic transition. White oil producers have excellent development prospects by entering these growing markets. In addition, consumers are increasingly favoring natural and sustainable components in a variety of sectors, such as food processing, cosmetics, and personal care. By creating eco-friendly and bio-based white oil products that meet customer preferences and legal criteria, white oil producers may profit from this trend.
Asia Pacific led the market in 2022 with the largest market share of 52.1%. The growth is related to the growing demand for the product from the local pharmaceutical sector. Increased consumer awareness, affordability, and purchasing power have been the main drivers of the pharmaceutical industry. Industry players frequently spend money on R&D, introduce new products, and adjust their prices to appeal to clients with different levels of purchasing power.
Asia Pacific White Oil Market Share in 2022 - 51.4%
www.thebrainyinsights.com
Check the geographical analysis of this market by requesting a free sample
The personal care segment dominated the global market in 2022 with a market share of 27.5%. Because more individuals are becoming conscious of their health, there is a rise in the market for personal care goods. White oil is used as an emollient and a fundamental ingredient in a variety of personal care products. It is commonly used in the manufacturing of a range of personal care products, including fragrances, moisturizers, infant products, body moisturizers, hair oils, shampoos, and water-resistant creams. Creams use the substance as a softening agent or emollient due to its lack of reaction with other compounds that come into touch with it, color stability, and odorlessness. The material is also used to create lotions that are resistant to water because of its excellent hydrophobicity. Royal Dutch Shell N.V. manufactures and sells Ondina X, a white oil of pharmaceutical quality, for use in personal care products because of its exceptional binding capabilities.
The offline segment dominated the market in 2022 with a market share of 68.6%. White oil may be stocked at specialty shops that concentrate on particular sectors of the economy or goods. These can include shops selling pet supplies, health products, cosmetics, and vehicle parts. Customers may explore and buy white oil goods in person at these real retail locations. Larger retail spaces like supermarkets and hypermarkets could carry white oil goods. These shops sell a broad variety of consumer goods, such as food items that could contain white oil as an ingredient, cosmetics, and personal care products. During routine shopping visits, customers might find white oil products alongside other home goods.
| Attribute | Description |
|---|---|
| Market Size | Revenue (USD Billion) |
| Market size value in 2022 | USD 2.1 Billion |
| Market size value in 2032 | USD 3.2 Billion |
| CAGR (2023 to 2032) | 4.4% |
| Historical data | 2019-2021 |
| Base Year | 2022 |
| Forecast | 2023-2032 |
| Region | The regions analyzed for the market are Asia Pacific, Europe, South America, North America, and Middle East & Africa. Furthermore, the regions are further analyzed at the country level. |
| Segments | Application, Distribution Channel, Region |
As per The Brainy Insights, the size of the white oil market was valued at USD 2.1 billion in 2022 to USD 3.2 billion by 2032.
The global white oil market is growing at a CAGR of 4.4% during the forecast period 2023-2032.
The Asia Pacific region emerged as the largest market for the white oil.
Rising demand from several end-use sectors will influence the market's growth.
1. Introduction
1.1. Objectives of the Study
1.2. Market Definition
1.3. Research Scope
1.4. Currency
1.5. Key Target Audience
2. Research Methodology and Assumptions
3. Executive Summary
4. Premium Insights
4.1. Porter’s Five Forces Analysis
4.2. Value Chain Analysis
4.3. Top Investment Pockets
4.3.1. Market Attractiveness Analysis by Application
4.3.2. Market Attractiveness Analysis by Distribution Channel
4.3.3. Market Attractiveness Analysis by Region
4.4. Industry Trends
5. Market Dynamics
5.1. Market Evaluation
5.2. Drivers
5.2.1. Rising demand from several end-use sectors
5.3. Restraints
5.3.1. Fluctuating raw material prices
5.4. Opportunities
5.4.1. Rise in demand from emerging economies
5.5. Challenges
5.5.1. Environmental concerns
6. Global White Oil Market Analysis and Forecast, By Application
6.1. Segment Overview
6.2. Polymers
6.3. Textile
6.4. Adhesives
6.5. Agriculture
6.6. Pharmaceutical
6.7. Food
6.8. Personal Care
7. Global White Oil Market Analysis and Forecast, By Distribution Channel
7.1. Segment Overview
7.2. Online
7.3. Offline
8. Global White Oil Market Analysis and Forecast, By Regional Analysis
8.1. Segment Overview
8.2. North America
8.2.1. U.S.
8.2.2. Canada
8.2.3. Mexico
8.3. Europe
8.3.1. Germany
8.3.2. France
8.3.3. U.K.
8.3.4. Italy
8.3.5. Spain
8.4. Asia-Pacific
8.4.1. Japan
8.4.2. China
8.4.3. India
8.5. South America
8.5.1. Brazil
8.6. Middle East and Africa
8.6.1. UAE
8.6.2. South Africa
9. Global White Oil Market-Competitive Landscape
9.1. Overview
9.2. Market Share of Key Players in the White Oil Market
9.2.1. Global Company Market Share
9.2.2. North America Company Market Share
9.2.3. Europe Company Market Share
9.2.4. APAC Company Market Share
9.3. Competitive Situations and Trends
9.3.1. Product Launches and Developments
9.3.2. Partnerships, Collaborations, and Agreements
9.3.3. Mergers & Acquisitions
9.3.4. Expansions
10. Company Profiles
10.1. Nynas AB
10.1.1. Business Overview
10.1.2. Company Snapshot
10.1.3. Company Market Share Analysis
10.1.4. Company Product Portfolio
10.1.5. Recent Developments
10.1.6. SWOT Analysis
10.2. Petro-Canada
10.2.1. Business Overview
10.2.2. Company Snapshot
10.2.3. Company Market Share Analysis
10.2.4. Company Product Portfolio
10.2.5. Recent Developments
10.2.6. SWOT Analysis
10.3. Royal-Dutch Shell N.V.
10.3.1. Business Overview
10.3.2. Company Snapshot
10.3.3. Company Market Share Analysis
10.3.4. Company Product Portfolio
10.3.5. Recent Developments
10.3.6. SWOT Analysis
10.4. Sinopec Corporation
10.4.1. Business Overview
10.4.2. Company Snapshot
10.4.3. Company Market Share Analysis
10.4.4. Company Product Portfolio
10.4.5. Recent Developments
10.4.6. SWOT Analysis
10.5. British Petroleum
10.5.1. Business Overview
10.5.2. Company Snapshot
10.5.3. Company Market Share Analysis
10.5.4. Company Product Portfolio
10.5.5. Recent Developments
10.5.6. SWOT Analysis
10.6. Renkert Oil, Inc.
10.6.1. Business Overview
10.6.2. Company Snapshot
10.6.3. Company Market Share Analysis
10.6.4. Company Product Portfolio
10.6.5. Recent Developments
10.6.6. SWOT Analysis
10.7. ExxonMobil Corporation
10.7.1. Business Overview
10.7.2. Company Snapshot
10.7.3. Company Market Share Analysis
10.7.4. Company Product Portfolio
10.7.5. Recent Developments
10.7.6. SWOT Analysis
10.8. JX Nippon Oil & Energy Corporation
10.8.1. Business Overview
10.8.2. Company Snapshot
10.8.3. Company Market Share Analysis
10.8.4. Company Product Portfolio
10.8.5. Recent Developments
10.8.6. SWOT Analysis
List of Table
1. Global White Oil Market, By Application, 2019-2032 (USD Billion)
2. Global Polymers, White Oil Market, By Region, 2019-2032 (USD Billion)
3. Global Textile, White Oil Market, By Region, 2019-2032 (USD Billion)
4. Global Adhesives, White Oil Market, By Region, 2019-2032 (USD Billion)
5. Global Agriculture, White Oil Market, By Region, 2019-2032 (USD Billion)
6. Global Pharmaceutical, White Oil Market, By Region, 2019-2032 (USD Billion)
7. Global Food, White Oil Market, By Region, 2019-2032 (USD Billion)
8. Global Personal Care, White Oil Market, By Region, 2019-2032 (USD Billion)
9. Global White Oil Market, By Distribution Channel, 2019-2032 (USD Billion)
10. Global Online, White Oil Market, By Region, 2019-2032 (USD Billion)
11. Global Offline, White Oil Market, By Region, 2019-2032 (USD Billion)
12. Global White Oil Market, By Region, 2019-2032 (USD Billion)
13. North America White Oil Market, By Application, 2019-2032 (USD Billion)
14. North America White Oil Market, By Distribution Channel, 2019-2032 (USD Billion)
15. U.S. White Oil Market, By Application, 2019-2032 (USD Billion)
16. U.S. White Oil Market, By Distribution Channel, 2019-2032 (USD Billion)
17. Canada White Oil Market, By Application, 2019-2032 (USD Billion)
18. Canada White Oil Market, By Distribution Channel, 2019-2032 (USD Billion)
19. Mexico White Oil Market, By Application, 2019-2032 (USD Billion)
20. Mexico White Oil Market, By Distribution Channel, 2019-2032 (USD Billion)
21. Europe White Oil Market, By Application, 2019-2032 (USD Billion)
22. Europe White Oil Market, By Distribution Channel, 2019-2032 (USD Billion)
23. Germany White Oil Market, By Application, 2019-2032 (USD Billion)
24. Germany White Oil Market, By Distribution Channel, 2019-2032 (USD Billion)
25. France White Oil Market, By Application, 2019-2032 (USD Billion)
26. France White Oil Market, By Distribution Channel, 2019-2032 (USD Billion)
27. U.K. White Oil Market, By Application, 2019-2032 (USD Billion)
28. U.K. White Oil Market, By Distribution Channel, 2019-2032 (USD Billion)
29. Italy White Oil Market, By Application, 2019-2032 (USD Billion)
30. Italy White Oil Market, By Distribution Channel, 2019-2032 (USD Billion)
31. Spain White Oil Market, By Application, 2019-2032 (USD Billion)
32. Spain White Oil Market, By Distribution Channel, 2019-2032 (USD Billion)
33. Asia Pacific White Oil Market, By Application, 2019-2032 (USD Billion)
34. Asia Pacific White Oil Market, By Distribution Channel, 2019-2032 (USD Billion)
35. Japan White Oil Market, By Application, 2019-2032 (USD Billion)
36. Japan White Oil Market, By Distribution Channel, 2019-2032 (USD Billion)
37. China White Oil Market, By Application, 2019-2032 (USD Billion)
38. China White Oil Market, By Distribution Channel, 2019-2032 (USD Billion)
39. India White Oil Market, By Application, 2019-2032 (USD Billion)
40. India White Oil Market, By Distribution Channel, 2019-2032 (USD Billion)
41. South America White Oil Market, By Application, 2019-2032 (USD Billion)
42. South America White Oil Market, By Distribution Channel, 2019-2032 (USD Billion)
43. Brazil White Oil Market, By Application, 2019-2032 (USD Billion)
44. Brazil White Oil Market, By Distribution Channel, 2019-2032 (USD Billion)
45. Middle East and Africa White Oil Market, By Application, 2019-2032 (USD Billion)
46. Middle East and Africa White Oil Market, By Distribution Channel, 2019-2032 (USD Billion)
47. UAE White Oil Market, By Application, 2019-2032 (USD Billion)
48. UAE White Oil Market, By Distribution Channel, 2019-2032 (USD Billion)
49. South Africa White Oil Market, By Application, 2019-2032 (USD Billion)
50. South Africa White Oil Market, By Distribution Channel, 2019-2032 (USD Billion)
List of Figures
1. Global White Oil Market Segmentation
2. White Oil Market: Research Methodology
3. Market Size Estimation Methodology: Bottom-Up Approach
4. Market Size Estimation Methodology: Top-Down Approach
5. Data Triangulation
6. Porter’s Five Forces Analysis
7. Value Chain Analysis
8. Global White Oil Market Attractiveness Analysis by Application
9. Global White Oil Market Attractiveness Analysis by Distribution Channel
10. Global White Oil Market Attractiveness Analysis by Region
11. Global White Oil Market: Dynamics
12. Global White Oil Market Share by Application (2022 & 2032)
13. Global White Oil Market Share by Distribution Channel (2022 & 2032)
14. Global White Oil Market Share by Regions (2022 & 2032)
15. Global White Oil Market Share by Company (2022)
This study forecasts revenue at global, regional, and country levels from 2019 to 2032. The Brainy Insights has segmented the global white oil market based on below-mentioned segments:
Global White Oil Market by Application:
Global White Oil Market by Distribution Channel:
Global White Oil Market by Region:
Research has its special purpose to undertake marketing efficiently. In this competitive scenario, businesses need information across all industry verticals; the information about customer wants, market demand, competition, industry trends, distribution channels etc. This information needs to be updated regularly because businesses operate in a dynamic environment. Our organization, The Brainy Insights incorporates scientific and systematic research procedures in order to get proper market insights and industry analysis for overall business success. The analysis consists of studying the market from a miniscule level wherein we implement statistical tools which helps us in examining the data with accuracy and precision.
Our research reports feature both; quantitative and qualitative aspects for any market. Qualitative information for any market research process are fundamental because they reveal the customer needs and wants, usage and consumption for any product/service related to a specific industry. This in turn aids the marketers/investors in knowing certain perceptions of the customers. Qualitative research can enlighten about the different product concepts and designs along with unique service offering that in turn, helps define marketing problems and generate opportunities. On the other hand, quantitative research engages with the data collection process through interviews, e-mail interactions, surveys and pilot studies. Quantitative aspects for the market research are useful to validate the hypotheses generated during qualitative research method, explore empirical patterns in the data with the help of statistical tools, and finally make the market estimations.
The Brainy Insights offers comprehensive research and analysis, based on a wide assortment of factual insights gained through interviews with CXOs and global experts and secondary data from reliable sources. Our analysts and industry specialist assume vital roles in building up statistical tools and analysis models, which are used to analyse the data and arrive at accurate insights with exceedingly informative research discoveries. The data provided by our organization have proven precious to a diverse range of companies, facilitating them to address issues such as determining which products/services are the most appealing, whether or not customers use the product in the manner anticipated, the purchasing intentions of the market and many others.
Our research methodology encompasses an idyllic combination of primary and secondary initiatives. Key phases involved in this process are listed below:

The phase involves the gathering and collecting of market data and its related information with the help of different sources & research procedures.

The data procurement stage involves in data gathering and collecting through various data sources.
This stage involves in extensive research. These data sources includes:
Purchased Database: Purchased databases play a crucial role in estimating the market sizes irrespective of the domain. Our purchased database includes:
Primary Research: The Brainy Insights interacts with leading companies and experts of the concerned domain to develop the analyst team’s market understanding and expertise. It improves and substantiates every single data presented in the market reports. Primary research mainly involves in telephonic interviews, E-mail interactions and face-to-face interviews with the raw material providers, manufacturers/producers, distributors, & independent consultants. The interviews that we conduct provides valuable data on market size and industry growth trends prevailing in the market. Our organization also conducts surveys with the various industry experts in order to gain overall insights of the industry/market. For instance, in healthcare industry we conduct surveys with the pharmacists, doctors, surgeons and nurses in order to gain insights and key information of a medical product/device/equipment which the customers are going to usage. Surveys are conducted in the form of questionnaire designed by our own analyst team. Surveys plays an important role in primary research because surveys helps us to identify the key target audiences of the market. Additionally, surveys helps to identify the key target audience engaged with the market. Our survey team conducts the survey by targeting the key audience, thus gaining insights from them. Based on the perspectives of the customers, this information is utilized to formulate market strategies. Moreover, market surveys helps us to understand the current competitive situation of the industry. To be precise, our survey process typically involve with the 360 analysis of the market. This analytical process begins by identifying the prospective customers for a product or service related to the market/industry to obtain data on how a product/service could fit into customers’ lives.

Secondary Research: The secondary data sources includes information published by the on-profit organizations such as World bank, WHO, company fillings, investor presentations, annual reports, national government documents, statistical databases, blogs, articles, white papers and others. From the annual report, we analyse a company’s revenue to understand the key segment and market share of that organization in a particular region. We analyse the company websites and adopt the product mapping technique which is important for deriving the segment revenue. In the product mapping method, we select and categorize the products offered by the companies catering to domain specific market, deduce the product revenue for each of the companies so as to get overall estimation of the market size. We also source data and analyses trends based on information received from supply side and demand side intermediaries in the value chain. The supply side denotes the data gathered from supplier, distributor, wholesaler and the demand side illustrates the data gathered from the end customers for respective market domain.

The supply side for a domain specific market is analysed by:
The demand side for the market is estimated through:
In-house Library: Apart from these third-party sources, we have our in-house library of qualitative and quantitative information. Our in-house database includes market data for various industry and domains. These data are updated on regular basis as per the changing market scenario. Our library includes, historic databases, internal audit reports and archives.
Sometimes there are instances where there is no metadata or raw data available for any domain specific market. For those cases, we use our expertise to forecast and estimate the market size in order to generate comprehensive data sets. Our analyst team adopt a robust research technique in order to produce the estimates:
Data Synthesis: This stage involves the analysis & mapping of all the information obtained from the previous step. It also involves in scrutinizing the data for any discrepancy observed while data gathering related to the market. The data is collected with consideration to the heterogeneity of sources. Robust scientific techniques are in place for synthesizing disparate data sets and provide the essential contextual information that can orient market strategies. The Brainy Insights has extensive experience in data synthesis where the data passes through various stages:


Market Deduction & Formulation: The final stage comprises of assigning data points at appropriate market spaces so as to deduce feasible conclusions. Analyst perspective & subject matter expert based holistic form of market sizing coupled with industry analysis also plays a crucial role in this stage.
This stage involves in finalization of the market size and numbers that we have collected from data integration step. With data interpolation, it is made sure that there is no gap in the market data. Successful trend analysis is done by our analysts using extrapolation techniques, which provide the best possible forecasts for the market.
Data Validation & Market Feedback: Validation is the most important step in the process. Validation & re-validation via an intricately designed process helps us finalize data-points to be used for final calculations.

The Brainy Insights interacts with leading companies and experts of the concerned domain to develop the analyst team’s market understanding and expertise. It improves and substantiates every single data presented in the market reports. The data validation interview and discussion panels are typically composed of the most experienced industry members. The participants include, however, are not limited to:
Moreover, we always validate our data and findings through primary respondents from all the major regions we are working on.


Free Customization
Fortune 500 Clients
Free Yearly Update On Purchase Of Multi/Corporate License
Companies Served Till Date