- +1-315-215-1633
- sales@thebrainyinsights.com

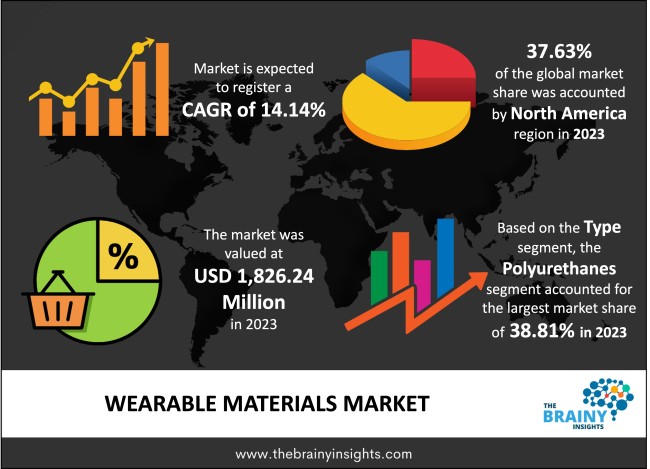
The global Wearable Materials market was valued at USD 1,826.24 Million in 2023 and growing at a CAGR of 14.14% from 2024 to 2033. The market is expected to reach USD 6,853.88 Million by 2033. This growth is attributed to growing awareness from health and wellness segments. The surge in awareness towards health has led to the growing demand for smart clothes and accessories embedded with temperature regulators, biometric sensors and moisture-absorbing fabrics. It has been observed that consumers are in demand for wearable materials that offer moisture management, breathability, and antimicrobial functionality as they look for hygiene and comfort in their everyday clothing. Also, there is a surge in demand for the Internet of Things (IoT) along with the growing disposable income of people in emerging economies. All these factors eventually drive the wearable materials market.
Sophisticated wearables are in demand by consumers, along with the preference for connected devices, which are some of the factors that are expanding the use of wearable materials. Hand-held devices such as smartphones are metal and hard and heavy plastic. These materials are unsuitable for wearable devices that the user can wear comfortably wherever they go. Wearable devices are made with flexible materials that are comfortable, light, and easy to move. Also, flexible materials seem very suitable for application in the healthcare sector. These can be inexpensive for mass production, portable, and easier to use than traditional products. These wearable materials are comparatively very comfortable for the user, and they take up much less space on the body; hence, this gives very little discomfort compared to several devices used presently for monitoring a broad range of symptoms. Wearable materials are growing because of the growing Internet of Things and digitalization globally. Moreover, the demand for fitness devices for monitoring health is growing due to an increase in health consciousness among consumers. Wearable materials can be used for several applications, but the demand for smartwatches is growing rapidly globally. Some wearable devices include virtual reality glasses, skin patches, smart watches, and smart garments, among others. These track crucial physiological parameters for health observation and athletic performance measurement. It can also be used to monitor the biomarkers for chronic disease management. It is also used for collecting body information, which helps determine the body's performance or normal workouts. Thus, the market is growing, and this can also be attributed to the advancement of technologies in electronics, materials, telecommunication and evolving data science. Other factors also include massive digitalization and growth in healthcare requirements for the senior population. Wearable devices are very comfortable and compact for the user. It is broadly used for delivering accurate information about the user with less power consumption and proper convenience. These products are designed to meet the demand for devices like fitness trackers, heart rate monitors, smart watches and sports equipment, among others.
Get an overview of this study by requesting a free sample
The growing use of wearable materials for health monitoring and gaming: The growing demand for wearable materials is growing as people want to track and get notifications for their blood pressure and heart rate. They also want to know about their consumption of calories and want to manage their training routines. The use of wearable technology increased during the pandemic, and awareness regarding personal hygiene increased substantially as people wanted to take precautions to avoid the infection. Also, the entertainment and gaming sectors were among the first to use VR headsets, controllers and smart glasses. Some popular VR head-mounted displays like Meta Quest and Sony PlayStation VR are broadly used for entertainment, such as watching movies, gaming, virtual travelling, etc. Sports also broadly use wearable athletic devices, which are either embedded in the fabric of sports apparel or sports equipment like balls and bats. Bluetooth and GPS-connected devices give real-time data to coaches for analyzing performance through connected devices like laptops. Other than such wearable devices, there are other familiar wearable technologies like Apple Watch, Fitbit, Samsung Galaxy Watch and Garmin, among others, which are broadly used for tracking player’s health and performance metrics.
Fluctuation in the price of raw materials: The fluctuation in the cost of raw materials is restraining the market, leading to a surge in the price of raw materials. Hence, profit margins vary and lessen, which is crucial for any organization to grow. Also, there is a scarcity of long-lasting and supple materials. All these factors act as hindrances to the market.
Growing use in fashion and smart clothing: Smart clothing and intelligent fashion seem to be gaining broad popularity recently. Clothing like Levi's' smart jackets, made using Google's Project Jacquard technology, has threads of electrical fibres. It helps the user to answer calls, take photos and play music from their sleeves. Moreover, wristbands, smartwatches, smart jewellery, and smart shoes are good examples of wearable technology. It is also used in the military sector as these wearable devices use technology to track soldiers' vitals. Also, VR-based simulation exercises and advanced technology like boot inserts help estimate how well soldiers are holding their equipment weight. It also helps in measuring their performance in the terrain areas. All these factors will drive the wearable materials in the forecasting period.
The regions analyzed for the market include North America, Europe, South America, Asia Pacific, the Middle East, and Africa. North America emerged as the largest market for the global Wearable Materials market, with a 37.63% share of the market revenue in 2023.
North America dominates the wearable materials industry due to a surge in the adoption of wearable devices in the region, such as an increase in the sales of fitness trackers, smartwatches, and virtual reality headsets. Hence, the region has a high demand for durable, high-quality wearable materials. Secondly, the electrical and electronics sector is expanding drastically. All these factors are driving the wearable material market in the region.
North America Region Wearable Materials Market Share in 2023 - 37.63%
www.thebrainyinsights.com
Check the geographical analysis of this market by requesting a free sample
The type segment is divided into silicone, polyurethanes and fluro elastomers. The polyurethanes segment dominated the market, with a market share of around 38.81% in 2023. This significant share is largely attributed to its durability, excellent flexibility, and lightweight nature. It is broadly used for fitness bands, smartwatches, and smart clothing. It is a very versatile material and can be tailored to meet several performance requirements. It provides excellent comfort and performance functionality.
The application segment is divided into fitness trackers, smart glass, wearable camera and smart clothing. The fitness trackers segment dominated the market, with a market share of around 36.55% in 2023. The substantial share is largely driven by its requirement for a flexible, skin-friendly, lightweight material that can bear daily use. Polymers such as silicone are broadly getting used for consumer electronics because of their properties like water resistance, flexibility and easy-to-customize.
| Attribute | Description |
|---|---|
| Market Size | Revenue (USD Million) |
| Market size value in 2023 | USD 1,826.24 Million |
| Market size value in 2033 | USD 6,853.88 Million |
| CAGR (2024 to 2033) | 14.14% |
| Historical data | 2020-2022 |
| Base Year | 2023 |
| Forecast | 2024-2033 |
| Region | The regions analyzed for the market are North America, Europe, South America, Asia Pacific, and Middle East & Africa. Furthermore, the regions are further analyzed at the country level. |
| Segments | Product Type, Source, Distribution Channel |
As per The Brainy Insights, the size of the Wearable Materials market was valued at USD 1,826.24 Million in 2023 to USD 6,853.88 Million by 2033.
Global Wearable Materials market is growing at a CAGR of 14.14% during the forecast period 2024-2033.
The global Wearable Materials market has been segmented based on type, application, and regions. The Polyurethanes segment led the market in 2023. The Fitness Trackers segment led the market in 2023.
North America region emerged as the largest market for the Wearable Materials market.
1. Introduction
1.1. Objectives of the Study
1.2. Market Definition
1.3. Research Scope
1.4. Currency
1.5. Key Target Audience
2. Research Methodology and Assumptions
3. Executive Summary
4. Premium Insights
4.1. Porter’s Five Forces Analysis
4.2. Value Chain Analysis
4.3. Top Investment Pockets
4.3.1. Market Attractiveness Analysis by Application
4.3.2. Market Attractiveness Analysis by Type
4.3.3. Market Attractiveness Analysis by Region
4.4. Industry Trends
5. Market Dynamics
5.1. Market Evaluation
5.2. Drivers
5.2.1. The growing use of wearable materials for health monitoring and gaming
5.3. Restraints
5.3.1. Fluctuation in the price of raw materials
5.4. Opportunities
5.4.1. Growing use in fashion and smart clothing
5.5. Challenges
5.5.1. Economic Slowdown
6. Global Wearable Materials Market Analysis and Forecast, By Application
6.1. Segment Overview
6.2. Fitness Trackers
6.3. Smart Glass
6.4. Wearable Camera
6.5. Smart Clothing
7. Global Wearable Materials Market Analysis and Forecast, By Type
7.1. Segment Overview
7.2. Silicone
7.3. Polyurethanes
7.4. Fluro elastomers
8. Global Wearable Materials Market Analysis and Forecast, By Regional Analysis
8.1. Segment Overview
8.2. North America
8.2.1. U.S.
8.2.2. Canada
8.2.3. Mexico
8.3. Europe
8.3.1. Germany
8.3.2. France
8.3.3. U.K.
8.3.4. Italy
8.3.5. Spain
8.4. Asia-Pacific
8.4.1. Japan
8.4.2. China
8.4.3. India
8.5. South America
8.5.1. Brazil
8.6. Middle East and Africa
8.6.1. UAE
8.6.2. South Africa
9. Global Wearable Materials Market-Competitive Landscape
9.1. Overview
9.2. Market Share of Key Players in the Wearable Materials Market
9.2.1. Global Company Market Share
9.2.2. North America Company Market Share
9.2.3. Europe Company Market Share
9.2.4. APAC Company Market Share
9.3. Competitive Situations and Trends
9.3.1. Product Launches and Developments
9.3.2. Partnerships, Collaborations, and Agreements
9.3.3. Mergers & Acquisitions
9.3.4. Expansions
10. Company Profiles
10.1. DuPont
10.1.1. Business Overview
10.1.2. Company Snapshot
10.1.3. Company Market Share Analysis
10.1.4. Company Product Portfolio
10.1.5. Recent Developments
10.1.6. SWOT Analysis
10.2. Arkema S. A.
10.2.1. Business Overview
10.2.2. Company Snapshot
10.2.3. Company Market Share Analysis
10.2.4. Company Product Portfolio
10.2.5. Recent Developments
10.2.6. SWOT Analysis
10.3. Elkem Silicones(Bluesil)
10.3.1. Business Overview
10.3.2. Company Snapshot
10.3.3. Company Market Share Analysis
10.3.4. Company Product Portfolio
10.3.5. Recent Developments
10.3.6. SWOT Analysis
10.4. BASF SE
10.4.1. Business Overview
10.4.2. Company Snapshot
10.4.3. Company Market Share Analysis
10.4.4. Company Product Portfolio
10.4.5. Recent Developments
10.4.6. SWOT Analysis
10.5. Momentive (Silopren LSR)
10.5.1. Business Overview
10.5.2. Company Snapshot
10.5.3. Company Market Share Analysis
10.5.4. Company Product Portfolio
10.5.5. Recent Developments
10.5.6. SWOT Analysis
10.6. Koninklijke DSM N V
10.6.1. Business Overview
10.6.2. Company Snapshot
10.6.3. Company Market Share Analysis
10.6.4. Company Product Portfolio
10.6.5. Recent Developments
10.6.6. SWOT Analysis
10.7. The Lubrizol Corporation (Estane)
10.7.1. Business Overview
10.7.2. Company Snapshot
10.7.3. Company Market Share Analysis
10.7.4. Company Product Portfolio
10.7.5. Recent Developments
10.7.6. SWOT Analysis
10.8. Wacker Chemie AG
10.8.1. Business Overview
10.8.2. Company Snapshot
10.8.3. Company Market Share Analysis
10.8.4. Company Product Portfolio
10.8.5. Recent Developments
10.8.6. SWOT Analysis
10.9. Solvay (Tecnoflon)
10.9.1. Business Overview
10.9.2. Company Snapshot
10.9.3. Company Market Share Analysis
10.9.4. Company Product Portfolio
10.9.5. Recent Developments
10.9.6. SWOT Analysis
List of Table
1. Global Wearable Materials Market, By Application, 2020 - 2033 (USD Million)
2. Global Fitness Trackers Wearable Materials Market, By Region, 2020 - 2033 (USD Million)
3. Global Smart Glass Wearable Materials Market, By Region, 2020 - 2033 (USD Million)
4. Global Wearable Camera Wearable Materials Market, By Region, 2020 - 2033 (USD Million)
5. Global Smart Clothing Wearable Materials Market, By Region, 2020 - 2033 (USD Million)
6. Global Wearable Materials Market, By Type, 2020 - 2033 (USD Million)
7. Global Silicone Wearable Materials Market, By Region, 2020 - 2033 (USD Million)
8. Global Polyurethanes Wearable Materials Market, By Region, 2020 - 2033 (USD Million)
9. Global Fluro elastomers Wearable Materials Market, By Region, 2020 - 2033 (USD Million)
10. North America Wearable Materials Market, By Application, 2020 - 2033 (USD Million)
11. North America Wearable Materials Market, By Type, 2020 - 2033 (USD Million)
12. U.S. Wearable Materials Market, By Application, 2020 - 2033 (USD Million)
13. U.S. Wearable Materials Market, By Type, 2020 - 2033 (USD Million)
14. Canada Wearable Materials Market, By Application, 2020 - 2033 (USD Million)
15. Canada Wearable Materials Market, By Type, 2020 - 2033 (USD Million)
16. Mexico Wearable Materials Market, By Application, 2020 - 2033 (USD Million)
17. Mexico Wearable Materials Market, By Type, 2020 - 2033 (USD Million)
18. Europe Wearable Materials Market, By Application, 2020 - 2033 (USD Million)
19. Europe Wearable Materials Market, By Type, 2020 - 2033 (USD Million)
20. Germany Wearable Materials Market, By Application, 2020 - 2033 (USD Million)
21. Germany Wearable Materials Market, By Type, 2020 - 2033 (USD Million)
22. France Wearable Materials Market, By Application 2020 - 2033 (USD Million)
23. France Wearable Materials Market, By Type, 2020 - 2033 (USD Million)
24. U.K. Wearable Materials Market, By Application, 2020 - 2033 (USD Million)
25. U.K. Wearable Materials Market, By Type, 2020 - 2033 (USD Million)
26. Italy Wearable Materials Market, By Application, 2020 - 2033 (USD Million)
27. Italy Wearable Materials Market, By Type, 2020 - 2033 (USD Million)
28. Spain Wearable Materials Market, By Application, 2020 - 2033 (USD Million)
29. Spain Wearable Materials Market, By Type, 2020 - 2033 (USD Million)
30. Asia Pacific Wearable Materials Market, By Application, 2020 - 2033 (USD Million)
31. Asia Pacific Wearable Materials Market, By Type, 2020 - 2033 (USD Million)
32. Japan Wearable Materials Market, By Application, 2020 - 2033 (USD Million)
33. Japan Wearable Materials Market, By Type, 2020 - 2033 (USD Million)
34. China Wearable Materials Market, By Application 2020 - 2033 (USD Million)
35. China Wearable Materials Market, By Type, 2020 - 2033 (USD Million)
36. India Wearable Materials Market, By Application 2020 - 2033 (USD Million)
37. India Wearable Materials Market, By Type, 2020 - 2033 (USD Million)
38. South America Wearable Materials Market, By Application, 2020 - 2033 (USD Million)
39. South America Wearable Materials Market, By Type, 2020 - 2033 (USD Million)
40. Brazil Wearable Materials Market, By Application 2020 - 2033 (USD Million)
41. Brazil Wearable Materials Market, By Type, 2020 - 2033 (USD Million)
42. Middle East and Africa Wearable Materials Market, By Application, 2020 - 2033 (USD Million)
43. Middle East and Africa Wearable Materials Market, By Type, 2020 - 2033 (USD Million)
44. UAE Wearable Materials Market, By Application, 2020 - 2033 (USD Million)
45. UAE Wearable Materials Market, By Type, 2020 - 2033 (USD Million)
46. South Africa Wearable Materials Market, By Application 2020 - 2033 (USD Million)
47. South Africa Wearable Materials Market, By Type, 2020 - 2033 (USD Million)
List of Figures
1. Global Wearable Materials Market Segmentation
2. Wearable Materials Market: Research Methodology
3. Market Size Estimation Methodology: Bottom-Up Approach
4. Market Size Estimation Methodology: Top-Down Approach
5. Data Triangulation
6. Porter’s Five Forces Analysis
7. Value Chain Analysis
8. Global Wearable Materials Market Attractiveness Analysis by Application
9. Global Wearable Materials Market Attractiveness Analysis by Type
10. Global Wearable Materials Market Attractiveness Analysis by Region
11. Global Wearable Materials Market: Dynamics
12. Global Wearable Materials Market Share by Application (2023 & 2033)
13. Global Wearable Materials Market Share by Type (2023 & 2033)
14. Global Wearable Materials Market Share by Regions (2023 & 2033)
15. Global Wearable Materials Market Share by Company (2023)
This study forecasts revenue at global, regional, and country levels from 2020 to 2033. The Brainy Insights has segmented the global Wearable Materials market based on below mentioned segments:
Global Wearable Materials Market by Type
Global Wearable Materials Market by Application:
Global Wearable Materials Market by Region:
Research has its special purpose to undertake marketing efficiently. In this competitive scenario, businesses need information across all industry verticals; the information about customer wants, market demand, competition, industry trends, distribution channels etc. This information needs to be updated regularly because businesses operate in a dynamic environment. Our organization, The Brainy Insights incorporates scientific and systematic research procedures in order to get proper market insights and industry analysis for overall business success. The analysis consists of studying the market from a miniscule level wherein we implement statistical tools which helps us in examining the data with accuracy and precision.
Our research reports feature both; quantitative and qualitative aspects for any market. Qualitative information for any market research process are fundamental because they reveal the customer needs and wants, usage and consumption for any product/service related to a specific industry. This in turn aids the marketers/investors in knowing certain perceptions of the customers. Qualitative research can enlighten about the different product concepts and designs along with unique service offering that in turn, helps define marketing problems and generate opportunities. On the other hand, quantitative research engages with the data collection process through interviews, e-mail interactions, surveys and pilot studies. Quantitative aspects for the market research are useful to validate the hypotheses generated during qualitative research method, explore empirical patterns in the data with the help of statistical tools, and finally make the market estimations.
The Brainy Insights offers comprehensive research and analysis, based on a wide assortment of factual insights gained through interviews with CXOs and global experts and secondary data from reliable sources. Our analysts and industry specialist assume vital roles in building up statistical tools and analysis models, which are used to analyse the data and arrive at accurate insights with exceedingly informative research discoveries. The data provided by our organization have proven precious to a diverse range of companies, facilitating them to address issues such as determining which products/services are the most appealing, whether or not customers use the product in the manner anticipated, the purchasing intentions of the market and many others.
Our research methodology encompasses an idyllic combination of primary and secondary initiatives. Key phases involved in this process are listed below:

The phase involves the gathering and collecting of market data and its related information with the help of different sources & research procedures.

The data procurement stage involves in data gathering and collecting through various data sources.
This stage involves in extensive research. These data sources includes:
Purchased Database: Purchased databases play a crucial role in estimating the market sizes irrespective of the domain. Our purchased database includes:
Primary Research: The Brainy Insights interacts with leading companies and experts of the concerned domain to develop the analyst team’s market understanding and expertise. It improves and substantiates every single data presented in the market reports. Primary research mainly involves in telephonic interviews, E-mail interactions and face-to-face interviews with the raw material providers, manufacturers/producers, distributors, & independent consultants. The interviews that we conduct provides valuable data on market size and industry growth trends prevailing in the market. Our organization also conducts surveys with the various industry experts in order to gain overall insights of the industry/market. For instance, in healthcare industry we conduct surveys with the pharmacists, doctors, surgeons and nurses in order to gain insights and key information of a medical product/device/equipment which the customers are going to usage. Surveys are conducted in the form of questionnaire designed by our own analyst team. Surveys plays an important role in primary research because surveys helps us to identify the key target audiences of the market. Additionally, surveys helps to identify the key target audience engaged with the market. Our survey team conducts the survey by targeting the key audience, thus gaining insights from them. Based on the perspectives of the customers, this information is utilized to formulate market strategies. Moreover, market surveys helps us to understand the current competitive situation of the industry. To be precise, our survey process typically involve with the 360 analysis of the market. This analytical process begins by identifying the prospective customers for a product or service related to the market/industry to obtain data on how a product/service could fit into customers’ lives.

Secondary Research: The secondary data sources includes information published by the on-profit organizations such as World bank, WHO, company fillings, investor presentations, annual reports, national government documents, statistical databases, blogs, articles, white papers and others. From the annual report, we analyse a company’s revenue to understand the key segment and market share of that organization in a particular region. We analyse the company websites and adopt the product mapping technique which is important for deriving the segment revenue. In the product mapping method, we select and categorize the products offered by the companies catering to domain specific market, deduce the product revenue for each of the companies so as to get overall estimation of the market size. We also source data and analyses trends based on information received from supply side and demand side intermediaries in the value chain. The supply side denotes the data gathered from supplier, distributor, wholesaler and the demand side illustrates the data gathered from the end customers for respective market domain.

The supply side for a domain specific market is analysed by:
The demand side for the market is estimated through:
In-house Library: Apart from these third-party sources, we have our in-house library of qualitative and quantitative information. Our in-house database includes market data for various industry and domains. These data are updated on regular basis as per the changing market scenario. Our library includes, historic databases, internal audit reports and archives.
Sometimes there are instances where there is no metadata or raw data available for any domain specific market. For those cases, we use our expertise to forecast and estimate the market size in order to generate comprehensive data sets. Our analyst team adopt a robust research technique in order to produce the estimates:
Data Synthesis: This stage involves the analysis & mapping of all the information obtained from the previous step. It also involves in scrutinizing the data for any discrepancy observed while data gathering related to the market. The data is collected with consideration to the heterogeneity of sources. Robust scientific techniques are in place for synthesizing disparate data sets and provide the essential contextual information that can orient market strategies. The Brainy Insights has extensive experience in data synthesis where the data passes through various stages:


Market Deduction & Formulation: The final stage comprises of assigning data points at appropriate market spaces so as to deduce feasible conclusions. Analyst perspective & subject matter expert based holistic form of market sizing coupled with industry analysis also plays a crucial role in this stage.
This stage involves in finalization of the market size and numbers that we have collected from data integration step. With data interpolation, it is made sure that there is no gap in the market data. Successful trend analysis is done by our analysts using extrapolation techniques, which provide the best possible forecasts for the market.
Data Validation & Market Feedback: Validation is the most important step in the process. Validation & re-validation via an intricately designed process helps us finalize data-points to be used for final calculations.

The Brainy Insights interacts with leading companies and experts of the concerned domain to develop the analyst team’s market understanding and expertise. It improves and substantiates every single data presented in the market reports. The data validation interview and discussion panels are typically composed of the most experienced industry members. The participants include, however, are not limited to:
Moreover, we always validate our data and findings through primary respondents from all the major regions we are working on.


Free Customization
Fortune 500 Clients
Free Yearly Update On Purchase Of Multi/Corporate License
Companies Served Till Date