- +1-315-215-1633
- sales@thebrainyinsights.com

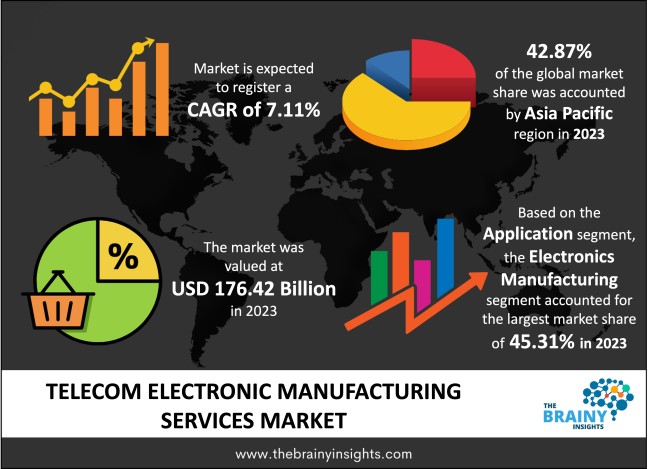
The global telecom electronic manufacturing services market was valued at USD 176.42 billion in 2023 and grew at a CAGR of 7.11% from 2024 to 2033. It is expected to reach USD 350.62 billion by 2033. The market's growth can be attributed to the need for rapid innovation and constant advancements in product design in consumer electronics. Further, the increasing investment in the Internet of Things has played a pivotal role in the market's growth.
The term electronics manufacturing services describes both a particular kind of business or subcontractor and the whole sector. The telecom electronic manufacturing services can increase efficiencies in operations and deploy their resources in core competencies like research and development by using EMS businesses' extensive range of value-added engineering and manufacturing outsourcing services. Typically, these services are utilized in place of or in addition to company-owned manufacturing operations. They provide the producers with several advantages, including rapid product introductions into the market, access to premium logistics, state-of-the-art technology, a significant decrease in total capital investments, etc.
Get an overview of this study by requesting a free sample
Increasing demand for electronic manufacturing services in the telecom industry: The telecommunications sector is among the world's most competitive industries. The growing need for high-speed data, audio, and video transmission from users worldwide is the driving force behind the increasing requirement for manufacturing advanced and miniature electronic components. Telecom electronic manufacturing services providers help telecom firms manage the intricacies of the contemporary digital ecosystem by acting as strategic partners in addition to being manufacturers. Ensuring quality, agility, and cost-effectiveness throughout the product lifecycle, these service providers offer a comprehensive spectrum of services ranging from designing and prototyping to manufacturing and testing.
Intensive capital investment: The price of developing telecom electronic components is too high. In contrast to equipment production, which mostly consists of assembly, test, and pack processes, component manufacturing demands a very high capital investment. The industry requires large expenditures for personnel training, state-of-the-art machinery, and technology. These large upfront expenditures may operate as a deterrent to entry and expansion, especially for smaller players.
Growth of the telecom industry: The telecoms sector, like utilities and other established businesses, is confronted with a basic strategic dilemma. Almost all businesses and billions of consumers depend on the essential services provided by this sector. The increase in data consumption over telecom networks is primarily due to video traffic and is expected to triple by 2027. Telecommunications businesses are investing heavily in the expensive infrastructure that allows them to provide customer services. As new gadgets with ever-higher data requirements develop, telecom companies are witnessing demand for their services driven mostly by altering customer preferences in the business-to-consumer arena.
The regions analyzed for the market include North America, Europe, South America, Asia Pacific, the Middle East, and Africa. Asia-Pacific emerged as the most significant telecom electronic manufacturing services market, with a 42.87% market revenue share in 2023.
Asia Pacific region will account for the largest market share with revenue growth. The market is being driven by numerous end-user businesses investing in their core competencies. The region has a high demand for telecom system manufacturing, as countries like India, Japan, China, and South Korea are hubs for consumer electronics. The growing cost of labour, especially in India and Japan, is leading to a higher preference for outsourcing for telecom electronic manufacturing services.
Asia-Pacific region Telecom Electronic Manufacturing Services Market Share in 2023 - 42.87%
www.thebrainyinsights.com
Check the geographical analysis of this market by requesting a free sample
The application segment is divided into electronics assembly, electronics design and engineering, supply chain management, electronics manufacturing and others. The electronics manufacturing segment dominated the market, with a share of around 45.31% in 2023. Electronics manufacturing services providers are a class of businesses supporting original equipment manufacturers with manufacturing, engineering, and other value-added services. EMS providers give their clients more time to focus on their core competencies, which include marketing, sales, and research & development.
The end-user segment is divided into aerospace and defence, consumer electronics, healthcare, industrial manufacturing, IT and telecom and others. The consumer electronics segment dominated the market, with a share of around 41.29% in 2023. The design and production of electronic gadgets, which have become indispensable in the digital age, are handled by experts specializing in electronics and telecommunications. The demand for consumer electronics has been increasing steadily in the recent decade, leading to the rising adoption of telecom electronic manufacturing services.
| Attribute | Description |
|---|---|
| Market Size | Revenue (USD Billion) |
| Market size value in 2023 | USD 176.42 Billion |
| Market size value in 2033 | USD 350.62 Billion |
| CAGR (2024 to 2033) | 7.11% |
| Historical data | 2020-2022 |
| Base Year | 2023 |
| Forecast | 2024-2033 |
| Region | The market's regions are Asia Pacific, Europe, South America, North America, and the Middle East and Africa. Furthermore, the regions are further analyzed at the country level. |
| Segments | Application and End-user |
As per The Brainy Insights, the size of the acetone market was valued USD 176.42 Billion in 2023 to USD 350.62 Billion by 2033.
Global acetone market is growing at a CAGR of 7.11% during the forecast period 2024-2033.
The global acetone market has been segmented based on application, end-user, and regions. Electronics manufacturing led the market in 2023 in the application segment. Consumer electronics led the market in 2023 in the end-user segment.
Asia Pacific region emerged as the largest market for the acetone.
The market's growth will be influenced by the electronic manufacturing services in the telecom industries.
The high cost can hamper the market growth.
The increasing growth of telecommunication industry is providing huge opportunities to the market.
Key players are Jabil Inc., Benchmark Electronics Inc., FLEX LTD., Plexus Corp., Caterpillar, Komatsu India Pvt. Ltd., Hitachi Construction Machinery Co. Ltd, JCB, AB Volvo, Tata Hitachi Construction Machinery, Sumitomo Heavy Industries Ltd. among others
1. Introduction
1.1. Objectives of the Study
1.2. Market Definition
1.3. Research Scope
1.4. Currency
1.5. Key Target Audience
2. Research Methodology and Assumptions
3. Executive Summary
4. Premium Insights
4.1. Porter’s Five Forces Analysis
4.2. Value Chain Analysis
4.3. Top Investment Pockets
4.3.1. Market Attractiveness Analysis by Application
4.3.2. Market Attractiveness Analysis by End-user
4.3.3. Market Attractiveness Analysis by Region
4.4. Industry Trends
5. Market Dynamics
5.1. Market Evaluation
5.2. Drivers
5.2.1. Increasing usage of Telecom Electronic Manufacturing Services across end-users
5.3. Restraints
5.3.1. High cost of system
5.4. Opportunities
5.4.1. Increasing investment in telecommunication industry
5.5. Challenges
5.5.1. Loss of control
6. Global Telecom Electronic Manufacturing Services Market Analysis and Forecast, By Application
6.1. Segment Overview
6.2. Electronics Assembly
6.3. Electronics Design and Engineering
6.4. Supply Chain Management
6.5. Electronics Manufacturing
6.6. Others
7. Global Telecom Electronic Manufacturing Services Market Analysis and Forecast, By End-user
7.1. Segment Overview
7.2. Aerospace and Defense
7.3. Consumer Electronics
7.4. Healthcare
7.5. Industrial Manufacturing
7.6. IT and Telecom
7.7. Others
8. Global Telecom Electronic Manufacturing Services Market Analysis and Forecast, By Regional Analysis
8.1. Segment Overview
8.2. North America
8.2.1. U.S.
8.2.2. Canada
8.2.3. Mexico
8.3. Europe
8.3.1. Germany
8.3.2. France
8.3.3. U.K.
8.3.4. Italy
8.3.5. Spain
8.4. Asia-Pacific
8.4.1. Japan
8.4.2. China
8.4.3. India
8.5. South America
8.5.1. Brazil
8.6. Middle East and Africa
8.6.1. UAE
8.6.2. South Africa
9. Global Telecom Electronic Manufacturing Services Market-Competitive Landscape
9.1. Overview
9.2. Market Share of Key Players in the Telecom Electronic Manufacturing Services Market
9.2.1. Global Company Market Share
9.2.2. North America Company Market Share
9.2.3. Europe Company Market Share
9.2.4. APAC Company Market Share
9.3. Competitive Situations and Trends
9.3.1. Product Launches and Developments
9.3.2. Partnerships, Collaborations, and Agreements
9.3.3. Mergers & Acquisitions
9.3.4. Expansions
10. Company Profiles
10.1. Jabil Inc.
10.1.1. Business Overview
10.1.2. Company Snapshot
10.1.3. Company Market Share Analysis
10.1.4. Company Product Portfolio
10.1.5. Recent Developments
10.1.6. SWOT Analysis
10.2. Benchmark Electronics Inc.
10.2.1. Business Overview
10.2.2. Company Snapshot
10.2.3. Company Market Share Analysis
10.2.4. Company Product Portfolio
10.2.5. Recent Developments
10.2.6. SWOT Analysis
10.3. FLEX LTD.
10.3.1. Business Overview
10.3.2. Company Snapshot
10.3.3. Company Market Share Analysis
10.3.4. Company Product Portfolio
10.3.5. Recent Developments
10.3.6. SWOT Analysis
10.4. Plexus Corp
10.4.1. Business Overview
10.4.2. Company Snapshot
10.4.3. Company Market Share Analysis
10.4.4. Company Product Portfolio
10.4.5. Recent Developments
10.4.6. SWOT Analysis
10.5. Caterpillar
10.5.1. Business Overview
10.5.2. Company Snapshot
10.5.3. Company Market Share Analysis
10.5.4. Company Product Portfolio
10.5.5. Recent Developments
10.5.6. SWOT Analysis
10.6. Komatsu India Pvt. Ltd.
10.6.1. Business Overview
10.6.2. Company Snapshot
10.6.3. Company Market Share Analysis
10.6.4. Company Product Portfolio
10.6.5. Recent Developments
10.6.6. SWOT Analysis
10.7. Hitachi Construction Machinery Co. Ltd.
10.7.1. Business Overview
10.7.2. Company Snapshot
10.7.3. Company Market Share Analysis
10.7.4. Company Product Portfolio
10.7.5. Recent Developments
10.7.6. SWOT Analysis
10.8. JCB
10.8.1. Business Overview
10.8.2. Company Snapshot
10.8.3. Company Market Share Analysis
10.8.4. Company Product Portfolio
10.8.5. Recent Developments
10.8.6. SWOT Analysis
10.9. AB Volvo
10.9.1. Business Overview
10.9.2. Company Snapshot
10.9.3. Company Market Share Analysis
10.9.4. Company Product Portfolio
10.9.5. Recent Developments
10.9.6. SWOT Analysis
10.10. Tata Hitachi Construction Machinery
10.10.1. Business Overview
10.10.2. Company Snapshot
10.10.3. Company Market Share Analysis
10.10.4. Company Product Portfolio
10.10.5. Recent Developments
10.10.6. SWOT Analysis
10.11. Sumitomo Heavy Industries Ltd.
10.11.1. Business Overview
10.11.2. Company Snapshot
10.11.3. Company Market Share Analysis
10.11.4. Company Product Portfolio
10.11.5. Recent Developments
10.11.6. SWOT Analysis
List of Table
1. Global Telecom Electronic Manufacturing Services Market, By Application, 2020-2033 (USD Billion)
2. Global Electronics Assembly, Telecom Electronic Manufacturing Services Market, By Region, 2020-2033 (USD Billion)
3. Global Electronics Design and Engineering, Telecom Electronic Manufacturing Services Market, By Region, 2020-2033 (USD Billion)
4. Global Supply Chain Management, Telecom Electronic Manufacturing Services Market, By Region, 2020-2033 (USD Billion)
5. Global Electronics Manufacturing, Telecom Electronic Manufacturing Services Market, By Region, 2020-2033 (USD Billion)
6. Global Others, Telecom Electronic Manufacturing Services Market, By Region, 2020-2033 (USD Billion)
7. Global Telecom Electronic Manufacturing Services Market, By End-user, 2020-2033 (USD Billion)
8. Global Aerospace and Defense, Telecom Electronic Manufacturing Services Market, By Region, 2020-2033 (USD Billion)
9. Global Consumer Electronics, Telecom Electronic Manufacturing Services Market, By Region, 2020-2033 (USD Billion)
10. Global Healthcare, Telecom Electronic Manufacturing Services Market, By Region, 2020-2033 (USD Billion)
11. Global Industrial Manufacturing, Telecom Electronic Manufacturing Services Market, By Region, 2020-2033 (USD Billion)
12. Global IT and Telecom, Telecom Electronic Manufacturing Services Market, By Region, 2020-2033 (USD Billion)
13. Global Others, Telecom Electronic Manufacturing Services Market, By Region, 2020-2033 (USD Billion)
14. Global Telecom Electronic Manufacturing Services Market, By Region, 2020-2033 (USD Billion)
15. North America Telecom Electronic Manufacturing Services Market, By Application, 2020-2033 (USD Billion)
16. North America Telecom Electronic Manufacturing Services Market, By End-user, 2020-2033 (USD Billion)
17. U.S. Telecom Electronic Manufacturing Services Market, By Application, 2020-2033 (USD Billion)
18. U.S. Telecom Electronic Manufacturing Services Market, By End-user, 2020-2033 (USD Billion)
19. Canada Telecom Electronic Manufacturing Services Market, By Application, 2020-2033 (USD Billion)
20. Canada Telecom Electronic Manufacturing Services Market, By End-user, 2020-2033 (USD Billion)
21. Mexico Telecom Electronic Manufacturing Services Market, By Application, 2020-2033 (USD Billion)
22. Mexico Telecom Electronic Manufacturing Services Market, By End-user, 2020-2033 (USD Billion)
23. Europe Telecom Electronic Manufacturing Services Market, By Application, 2020-2033 (USD Billion)
24. Europe Telecom Electronic Manufacturing Services Market, By End-user, 2020-2033 (USD Billion)
25. Germany Telecom Electronic Manufacturing Services Market, By Application, 2020-2033 (USD Billion)
26. Germany Telecom Electronic Manufacturing Services Market, By End-user, 2020-2033 (USD Billion)
27. France Telecom Electronic Manufacturing Services Market, By Application, 2020-2033 (USD Billion)
28. France Telecom Electronic Manufacturing Services Market, By End-user, 2020-2033 (USD Billion)
29. U.K. Telecom Electronic Manufacturing Services Market, By Application, 2020-2033 (USD Billion)
30. U.K. Telecom Electronic Manufacturing Services Market, By End-user, 2020-2033 (USD Billion)
31. Italy Telecom Electronic Manufacturing Services Market, By Application, 2020-2033 (USD Billion)
32. Italy Telecom Electronic Manufacturing Services Market, By End-user, 2020-2033 (USD Billion)
33. Spain Telecom Electronic Manufacturing Services Market, By Application, 2020-2033 (USD Billion)
34. Spain Telecom Electronic Manufacturing Services Market, By End-user, 2020-2033 (USD Billion)
35. Asia Pacific Telecom Electronic Manufacturing Services Market, By Application, 2020-2033 (USD Billion)
36. Asia Pacific Telecom Electronic Manufacturing Services Market, By End-user, 2020-2033 (USD Billion)
37. Japan Telecom Electronic Manufacturing Services Market, By Application, 2020-2033 (USD Billion)
38. Japan Telecom Electronic Manufacturing Services Market, By End-user, 2020-2033 (USD Billion)
39. China Telecom Electronic Manufacturing Services Market, By Application, 2020-2033 (USD Billion)
40. China Telecom Electronic Manufacturing Services Market, By End-user, 2020-2033 (USD Billion)
41. India Telecom Electronic Manufacturing Services Market, By Application, 2020-2033 (USD Billion)
42. India Telecom Electronic Manufacturing Services Market, By End-user, 2020-2033 (USD Billion)
43. South America Telecom Electronic Manufacturing Services Market, By Application, 2020-2033 (USD Billion)
44. South America Telecom Electronic Manufacturing Services Market, By End-user, 2020-2033 (USD Billion)
45. Brazil Telecom Electronic Manufacturing Services Market, By Application, 2020-2033 (USD Billion)
46. Brazil Telecom Electronic Manufacturing Services Market, By End-user, 2020-2033 (USD Billion)
47. Middle East and Africa Telecom Electronic Manufacturing Services Market, By Application, 2020-2033 (USD Billion)
48. Middle East and Africa Telecom Electronic Manufacturing Services Market, By End-user, 2020-2033 (USD Billion)
49. UAE Telecom Electronic Manufacturing Services Market, By Application, 2020-2033 (USD Billion)
50. UAE Telecom Electronic Manufacturing Services Market, By End-user, 2020-2033 (USD Billion)
51. South Africa Telecom Electronic Manufacturing Services Market, By Application, 2020-2033 (USD Billion)
52. South Africa Telecom Electronic Manufacturing Services Market, By End-user, 2020-2033 (USD Billion)
List of Figures
1. Global Telecom Electronic Manufacturing Services Market Segmentation
2. Telecom Electronic Manufacturing Services Market: Research Methodology
3. Market Size Estimation Methodology: Bottom-Up Approach
4. Market Size Estimation Methodology: Top-Down Approach
5. Data Triangulation
6. Porter’s Five Forces Analysis
7. Value Chain Analysis
8. Global Telecom Electronic Manufacturing Services Market Attractiveness Analysis by Application
9. Global Telecom Electronic Manufacturing Services Market Attractiveness Analysis by End-user
10. Global Telecom Electronic Manufacturing Services Market Attractiveness Analysis by Region
11. Global Telecom Electronic Manufacturing Services Market: Dynamics
12. Global Telecom Electronic Manufacturing Services Market Share by Application (2023 & 2033)
13. Global Telecom Electronic Manufacturing Services Market Share by End-user (2023 & 2033)
14. Global Telecom Electronic Manufacturing Services Market Share by Regions (2023 & 2033)
15. Global Telecom Electronic Manufacturing Services Market Share by Company (2023)
This study forecasts revenue at global, regional, and country levels from 2020 to 2033. The Brainy Insights has segmented the global telecom electronic manufacturing services market based on below mentioned segments:
Global Telecom Electronic Manufacturing Services Market by Application:
Global Telecom Electronic Manufacturing Services Market by End-user:
Global Telecom Electronic Manufacturing Services Market by Region:
Research has its special purpose to undertake marketing efficiently. In this competitive scenario, businesses need information across all industry verticals; the information about customer wants, market demand, competition, industry trends, distribution channels etc. This information needs to be updated regularly because businesses operate in a dynamic environment. Our organization, The Brainy Insights incorporates scientific and systematic research procedures in order to get proper market insights and industry analysis for overall business success. The analysis consists of studying the market from a miniscule level wherein we implement statistical tools which helps us in examining the data with accuracy and precision.
Our research reports feature both; quantitative and qualitative aspects for any market. Qualitative information for any market research process are fundamental because they reveal the customer needs and wants, usage and consumption for any product/service related to a specific industry. This in turn aids the marketers/investors in knowing certain perceptions of the customers. Qualitative research can enlighten about the different product concepts and designs along with unique service offering that in turn, helps define marketing problems and generate opportunities. On the other hand, quantitative research engages with the data collection process through interviews, e-mail interactions, surveys and pilot studies. Quantitative aspects for the market research are useful to validate the hypotheses generated during qualitative research method, explore empirical patterns in the data with the help of statistical tools, and finally make the market estimations.
The Brainy Insights offers comprehensive research and analysis, based on a wide assortment of factual insights gained through interviews with CXOs and global experts and secondary data from reliable sources. Our analysts and industry specialist assume vital roles in building up statistical tools and analysis models, which are used to analyse the data and arrive at accurate insights with exceedingly informative research discoveries. The data provided by our organization have proven precious to a diverse range of companies, facilitating them to address issues such as determining which products/services are the most appealing, whether or not customers use the product in the manner anticipated, the purchasing intentions of the market and many others.
Our research methodology encompasses an idyllic combination of primary and secondary initiatives. Key phases involved in this process are listed below:

The phase involves the gathering and collecting of market data and its related information with the help of different sources & research procedures.

The data procurement stage involves in data gathering and collecting through various data sources.
This stage involves in extensive research. These data sources includes:
Purchased Database: Purchased databases play a crucial role in estimating the market sizes irrespective of the domain. Our purchased database includes:
Primary Research: The Brainy Insights interacts with leading companies and experts of the concerned domain to develop the analyst team’s market understanding and expertise. It improves and substantiates every single data presented in the market reports. Primary research mainly involves in telephonic interviews, E-mail interactions and face-to-face interviews with the raw material providers, manufacturers/producers, distributors, & independent consultants. The interviews that we conduct provides valuable data on market size and industry growth trends prevailing in the market. Our organization also conducts surveys with the various industry experts in order to gain overall insights of the industry/market. For instance, in healthcare industry we conduct surveys with the pharmacists, doctors, surgeons and nurses in order to gain insights and key information of a medical product/device/equipment which the customers are going to usage. Surveys are conducted in the form of questionnaire designed by our own analyst team. Surveys plays an important role in primary research because surveys helps us to identify the key target audiences of the market. Additionally, surveys helps to identify the key target audience engaged with the market. Our survey team conducts the survey by targeting the key audience, thus gaining insights from them. Based on the perspectives of the customers, this information is utilized to formulate market strategies. Moreover, market surveys helps us to understand the current competitive situation of the industry. To be precise, our survey process typically involve with the 360 analysis of the market. This analytical process begins by identifying the prospective customers for a product or service related to the market/industry to obtain data on how a product/service could fit into customers’ lives.

Secondary Research: The secondary data sources includes information published by the on-profit organizations such as World bank, WHO, company fillings, investor presentations, annual reports, national government documents, statistical databases, blogs, articles, white papers and others. From the annual report, we analyse a company’s revenue to understand the key segment and market share of that organization in a particular region. We analyse the company websites and adopt the product mapping technique which is important for deriving the segment revenue. In the product mapping method, we select and categorize the products offered by the companies catering to domain specific market, deduce the product revenue for each of the companies so as to get overall estimation of the market size. We also source data and analyses trends based on information received from supply side and demand side intermediaries in the value chain. The supply side denotes the data gathered from supplier, distributor, wholesaler and the demand side illustrates the data gathered from the end customers for respective market domain.

The supply side for a domain specific market is analysed by:
The demand side for the market is estimated through:
In-house Library: Apart from these third-party sources, we have our in-house library of qualitative and quantitative information. Our in-house database includes market data for various industry and domains. These data are updated on regular basis as per the changing market scenario. Our library includes, historic databases, internal audit reports and archives.
Sometimes there are instances where there is no metadata or raw data available for any domain specific market. For those cases, we use our expertise to forecast and estimate the market size in order to generate comprehensive data sets. Our analyst team adopt a robust research technique in order to produce the estimates:
Data Synthesis: This stage involves the analysis & mapping of all the information obtained from the previous step. It also involves in scrutinizing the data for any discrepancy observed while data gathering related to the market. The data is collected with consideration to the heterogeneity of sources. Robust scientific techniques are in place for synthesizing disparate data sets and provide the essential contextual information that can orient market strategies. The Brainy Insights has extensive experience in data synthesis where the data passes through various stages:


Market Deduction & Formulation: The final stage comprises of assigning data points at appropriate market spaces so as to deduce feasible conclusions. Analyst perspective & subject matter expert based holistic form of market sizing coupled with industry analysis also plays a crucial role in this stage.
This stage involves in finalization of the market size and numbers that we have collected from data integration step. With data interpolation, it is made sure that there is no gap in the market data. Successful trend analysis is done by our analysts using extrapolation techniques, which provide the best possible forecasts for the market.
Data Validation & Market Feedback: Validation is the most important step in the process. Validation & re-validation via an intricately designed process helps us finalize data-points to be used for final calculations.

The Brainy Insights interacts with leading companies and experts of the concerned domain to develop the analyst team’s market understanding and expertise. It improves and substantiates every single data presented in the market reports. The data validation interview and discussion panels are typically composed of the most experienced industry members. The participants include, however, are not limited to:
Moreover, we always validate our data and findings through primary respondents from all the major regions we are working on.


Free Customization
Fortune 500 Clients
Free Yearly Update On Purchase Of Multi/Corporate License
Companies Served Till Date