- +1-315-215-1633
- sales@thebrainyinsights.com

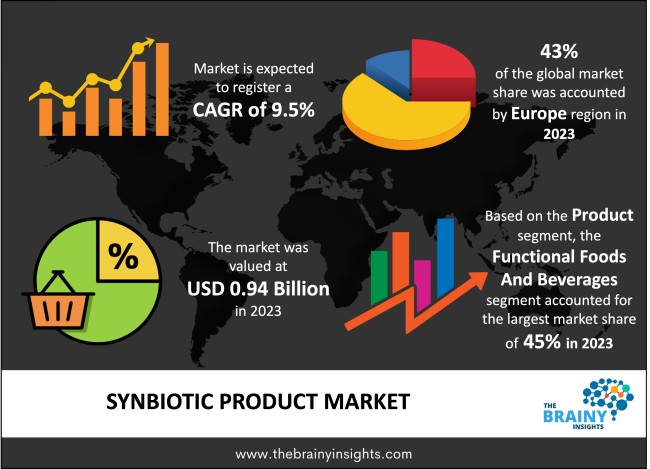
The global Synbiotic Product market was valued at USD 0.94 billion in 2023 and growing at a CAGR of 9.5% from 2024 to 2033. The market is expected to reach USD 2.33 billion by 2033. Rapidly growing demand for healthier lifestyle in the global market and increased improvement in the Immune System will potentially drive the growth of the Synbiotic Product Market. Whereas, increasing demand of the Synbiotic Product in the Food & Beverages Industry and technological advancements in Synbiotic Product may drive the growth of the Synbiotic Product Market in the period forecasted.
Synbiotics are those food supplements that contains both probiotics and prebiotics. Main objective behind this product is to alter, enhance or restore the intestinal flora. With a major aim to help and gauge easy functioning of intestines and other probiotic strains. Such as, Bifidobacterium, Lactobacilli to name a few. Additionally, by combining various fibres (such as these). These fibres create synbiotics. Which in turn not only enhances probiotic vitality but also enhances immunity and cognitive health and boosting energy levels.
Get an overview of this study by requesting a free sample
Rapidly growing demand for healthier lifestyle in the global market– One of the major factors that boosts the growth of the Synbiotic Product in the market is rapidly growing demand for healthier lifestyle in the global market. With rising awareness towards health and increasing intake of functional fods and beverages. The market witnesses an upsurge in the period forecasted. Additionally, a significant inclination towards healthier lifestyle and change in the eating patterns have also played a pivotal role in the market.
Lack of raw-materials in the Synbiotic Products in the market– High manufacturing expenses present a significant barrier to the growth of the synbiotics market. Producers face constraints in production capacity due to shortages of raw materials and labor. thereby posing a restraining factor in the Synbiotic Product Market.
Increasing demand of the Synbiotic Product in the Food & Beverages Industry- An increased demand for Synbiotic Products and consumer investing in various products thereby willing to pay the premium prices towards the same is one major factor that may propel the growth of the Synbiotic Products Market in the period forecasted.
The regions analyzed for the market include North America, Europe, South America, Asia Pacific, the Middle East, and Africa. Europe emerged as the largest global Synbiotic Product market, accounting for 43% of the total market. Owing to increasing awareness regarding Synbiotic Products. Whereas Asia Pacific exhibits the highest growth rate in the market owing to rapidly growing use of probiotics and prebiotics in the region.
European Region Synbiotic Product Market Share in 2023 - 43%
www.thebrainyinsights.com
Check the geographical analysis of this market by requesting a free sample
In 2023, functional foods and beverages took the lead in the synbiotic product market, capturing a substantial 45% market share. Owing to increased awareness towards raising immunity, cardiovascular, and digestive health. Dietary supplements are expected to witness the fastest growth owing to increased consumer awareness and various marketing campaigns to promote synbiotic-based dietary supplements.
The offline distribution channel, dominated the synbiotic product market in 2023 with a market share of 57%. Owing to increased visibility of products in physical stores. Online channel is expected to witness rapid growth, owing to increasing usage of internet platforms and e-commerce by GenZ, GenX and Millennial generations.
| Attribute | Description |
|---|---|
| Market Size | Revenue (USD Billion) |
| Market size value in 2023 | USD 0.94 Billion |
| Market size value in 2033 | USD 2.33 Billion |
| CAGR (2024 to 2033) | 9.5% |
| Historical data | 2020-2022 |
| Base Year | 2023 |
| Forecast | 2024-2033 |
| Region | The regions analyzed for the market are Asia Pacific, Europe, South America, North America, and Middle East & Africa. Furthermore, the regions are further analyzed at the country level. |
| Segments | Product, Distribution Channel |
As per The Brainy Insights, the size of the synbiotic product market was valued at USD 0.94 billion in 2023 to USD 2.33 billion by 2033.
The global synbiotic product market is growing at a CAGR of 9.5% during the forecast period 2024-2033.
The Europe region emerged as the largest market for the synbiotic product.
The rapidly growing demand for healthier lifestyle in the global market will influence the market's growth.
1. Introduction
1.1. Objectives of the Study
1.2. Market Definition
1.3. Research Scope
1.4. Currency
1.5. Key Target Audience
2. Research Methodology and Assumptions
3. Executive Summary
4. Premium Insights
4.1. Porter’s Five Forces Analysis
4.2. Value Chain Analysis
4.3. Top Investment Pockets
4.3.1. Market Attractiveness Analysis by Product
4.3.2. Market Attractiveness Analysis by Distribution Channel
4.3.3. Market Attractiveness Analysis by Region
4.4. Industry Trends
5. Market Dynamics
5.1. Market Evaluation
5.2. Drivers
5.2.1. Rapidly growing demand for healthier lifestyle in the global market
5.2.2. Increased improvement in the Immune System
5.3. Restraints
5.3.1. Lack of raw-materials in the Synbiotic Products in the market
5.4. Opportunities
5.4.1. Increasing demand of the Synbiotic Product in the Food & Beverages Industry
5.4.2. Technological advancements in Synbiotic Product
5.5. Challenges
5.5.1. Heavy dosage of Synbiotics posing a challenge to the Synbiotic Product Market
6. Global Synbiotic Product Market Analysis and Forecast, By Product
6.1. Segment Overview
6.2. Functional Food & Beverages
6.3. Dietary Supplements
6.4. Others
7. Global Synbiotic Product Market Analysis and Forecast, By Distribution Channel
7.1. Segment Overview
7.2. Online
7.3. Offline
8. Global Synbiotic Product Market Analysis and Forecast, By Regional Analysis
8.1. Segment Overview
8.2. North America
8.2.1. U.S.
8.2.2. Canada
8.2.3. Mexico
8.3. Europe
8.3.1. Germany
8.3.2. France
8.3.3. U.K.
8.3.4. Italy
8.3.5. Spain
8.4. Asia-Pacific
8.4.1. Japan
8.4.2. China
8.4.3. India
8.5. South America
8.5.1. Brazil
8.6. Middle East and Africa
8.6.1. UAE
8.6.2. South Africa
9. Global Synbiotic Product Market-Competitive Landscape
9.1. Overview
9.2. Market Share of Key Players in Global Synbiotic Product Market
9.2.1. Global Company Market Share
9.2.2. North America Company Market Share
9.2.3. Europe Company Market Share
9.2.4. APAC Company Market Share
9.3. Competitive Situations and Trends
9.3.1. Product Launches and Developments
9.3.2. Partnerships, Collaborations, and Agreements
9.3.3. Mergers & Acquisitions
9.3.4. Expansions
10. Company Profiles
10.1. DuPont de Nemours Inc
10.1.1. Business Overview
10.1.2. Company Snapshot
10.1.3. Company Market Share Analysis
10.1.4. Company Product Portfolio
10.1.5. Recent Developments
10.1.6. SWOT Analysis
10.2. Chr. Hansen Holding A/S
10.2.1. Business Overview
10.2.2. Company Snapshot
10.2.3. Company Market Share Analysis
10.2.4. Company Product Portfolio
10.2.5. Recent Developments
10.2.6. SWOT Analysis
10.3. BioGaia AB
10.3.1. Business Overview
10.3.2. Company Snapshot
10.3.3. Company Market Share Analysis
10.3.4. Company Product Portfolio
10.3.5. Recent Developments
10.3.6. SWOT Analysis
10.4. Kerry Group plc
10.4.1. Business Overview
10.4.2. Company Snapshot
10.4.3. Company Market Share Analysis
10.4.4. Company Product Portfolio
10.4.5. Recent Developments
10.4.6. SWOT Analysis
10.5. Lallemand Inc
10.5.1. Business Overview
10.5.2. Company Snapshot
10.5.3. Company Market Share Analysis
10.5.4. Company Product Portfolio
10.5.5. Recent Developments
10.5.6. SWOT Analysis
10.6. Danone S.A.
10.6.1. Business Overview
10.6.2. Company Snapshot
10.6.3. Company Market Share Analysis
10.6.4. Company Product Portfolio
10.6.5. Recent Developments
10.6.6. SWOT Analysis
10.7. Yakult Honsha Co Ltd
10.7.1. Business Overview
10.7.2. Company Snapshot
10.7.3. Company Market Share Analysis
10.7.4. Company Product Portfolio
10.7.5. Recent Developments
10.7.6. SWOT Analysis
10.8. Probi AB
10.8.1. Business Overview
10.8.2. Company Snapshot
10.8.3. Company Market Share Analysis
10.8.4. Company Product Portfolio
10.8.5. Recent Developments
10.8.6. SWOT Analysis
10.9. UAS Laboratories LLC
10.9.1. Business Overview
10.9.2. Company Snapshot
10.9.3. Company Market Share Analysis
10.9.4. Company Product Portfolio
10.9.5. Recent Developments
10.9.6. SWOT Analysis
10.10. Ganeden Inc
10.10.1. Business Overview
10.10.2. Company Snapshot
10.10.3. Company Market Share Analysis
10.10.4. Company Product Portfolio
10.10.5. Recent Developments
10.10.6. SWOT Analysis
List of Table
1. Global Synbiotic Product Market, By Product, 2020-2033 (USD Billion)
2. Global Functional Food & Beverages, Synbiotic Product Market, By Region, 2020-2033 (USD Billion)
3. Global Dietary Supplements, Synbiotic Product Market, By Region, 2020-2033 (USD Billion)
4. Global Others, Synbiotic Product Market, By Region, 2020-2033 (USD Billion)
5. Global Synbiotic Product Market, By Distribution Channel, 2020-2033 (USD Billion)
6. Global Online, Synbiotic Product Market, By Region, 2020-2033 (USD Billion)
7. Global Offline, Synbiotic Product Market, By Region, 2020-2033 (USD Billion)
8. Global Synbiotic Product Market, By Region, 2020-2033 (USD Billion)
9. North America Synbiotic Product Market, By Product, 2020-2033 (USD Billion)
10. North America Synbiotic Product Market, By Distribution Channel, 2020-2033 (USD Billion)
11. U.S. Synbiotic Product Market, By Product, 2020-2033 (USD Billion)
12. U.S. Synbiotic Product Market, By Distribution Channel, 2020-2033 (USD Billion)
13. Canada Synbiotic Product Market, By Product, 2020-2033 (USD Billion)
14. Canada Synbiotic Product Market, By Distribution Channel, 2020-2033 (USD Billion)
15. Mexico Synbiotic Product Market, By Product, 2020-2033 (USD Billion)
16. Mexico Synbiotic Product Market, By Distribution Channel, 2020-2033 (USD Billion)
17. Europe Synbiotic Product Market, By Product, 2020-2033 (USD Billion)
18. Europe Synbiotic Product Market, By Distribution Channel, 2020-2033 (USD Billion)
19. Germany Synbiotic Product Market, By Product, 2020-2033 (USD Billion)
20. Germany Synbiotic Product Market, By Distribution Channel, 2020-2033 (USD Billion)
21. France Synbiotic Product Market, By Product, 2020-2033 (USD Billion)
22. France Synbiotic Product Market, By Distribution Channel, 2020-2033 (USD Billion)
23. U.K. Synbiotic Product Market, By Product, 2020-2033 (USD Billion)
24. U.K. Synbiotic Product Market, By Distribution Channel, 2020-2033 (USD Billion)
25. Italy Synbiotic Product Market, By Product, 2020-2033 (USD Billion)
26. Italy Synbiotic Product Market, By Distribution Channel, 2020-2033 (USD Billion)
27. Spain Synbiotic Product Market, By Product, 2020-2033 (USD Billion)
28. Spain Synbiotic Product Market, By Distribution Channel, 2020-2033 (USD Billion)
29. Asia Pacific Synbiotic Product Market, By Product, 2020-2033 (USD Billion)
30. Asia Pacific Synbiotic Product Market, By Distribution Channel, 2020-2033 (USD Billion)
31. Japan Synbiotic Product Market, By Product, 2020-2033 (USD Billion)
32. Japan Synbiotic Product Market, By Distribution Channel, 2020-2033 (USD Billion)
33. China Synbiotic Product Market, By Product, 2020-2033 (USD Billion)
34. China Synbiotic Product Market, By Distribution Channel, 2020-2033 (USD Billion)
35. India Synbiotic Product Market, By Product, 2020-2033 (USD Billion)
36. India Synbiotic Product Market, By Distribution Channel, 2020-2033 (USD Billion)
37. South America Synbiotic Product Market, By Product, 2020-2033 (USD Billion)
38. South America Synbiotic Product Market, By Distribution Channel, 2020-2033 (USD Billion)
39. Brazil Synbiotic Product Market, By Product, 2020-2033 (USD Billion)
40. Brazil Synbiotic Product Market, By Distribution Channel, 2020-2033 (USD Billion)
41. Middle East and Africa Synbiotic Product Market, By Product, 2020-2033 (USD Billion)
42. Middle East and Africa Synbiotic Product Market, By Distribution Channel, 2020-2033 (USD Billion)
43. UAE Synbiotic Product Market, By Product, 2020-2033 (USD Billion)
44. UAE Synbiotic Product Market, By Distribution Channel, 2020-2033 (USD Billion)
45. South Africa Synbiotic Product Market, By Product, 2020-2033 (USD Billion)
46. South Africa Synbiotic Product Market, By Distribution Channel, 2020-2033 (USD Billion)
List of Figures
1. Global Synbiotic Product Market Segmentation
2. Global Synbiotic Product Market: Research Methodology
3. Market Size Estimation Methodology: Bottom-Up Approach
4. Market Size Estimation Methodology: Top-Down Approach
5. Data Triangulation
6. Porter’s Five Forces Analysis
7. Value Chain Analysis
8. Global Synbiotic Product Market Attractiveness Analysis by Product
9. Global Synbiotic Product Market Attractiveness Analysis by Distribution Channel
10. Global Synbiotic Product Market Attractiveness Analysis by Region
11. Global Synbiotic Product Market: Dynamics
12. Global Synbiotic Product Market Share by Product (2023 & 2033)
13. Global Synbiotic Product Market Share by Distribution Channel (2023 & 2033)
14. Global Synbiotic Product Market Share by Regions (2023 & 2033)
15. Global Synbiotic Product Market Share by Company (2023)
This study forecasts revenue at global, regional, and country levels from 2020 to 2033. The Brainy Insights has segmented the global synbiotic product market based on below-mentioned segments:
Global Synbiotic Product Market by Product:
Global Synbiotic Product Market by Distribution Channel:
Global Synbiotic Product Market by Region:
Research has its special purpose to undertake marketing efficiently. In this competitive scenario, businesses need information across all industry verticals; the information about customer wants, market demand, competition, industry trends, distribution channels etc. This information needs to be updated regularly because businesses operate in a dynamic environment. Our organization, The Brainy Insights incorporates scientific and systematic research procedures in order to get proper market insights and industry analysis for overall business success. The analysis consists of studying the market from a miniscule level wherein we implement statistical tools which helps us in examining the data with accuracy and precision.
Our research reports feature both; quantitative and qualitative aspects for any market. Qualitative information for any market research process are fundamental because they reveal the customer needs and wants, usage and consumption for any product/service related to a specific industry. This in turn aids the marketers/investors in knowing certain perceptions of the customers. Qualitative research can enlighten about the different product concepts and designs along with unique service offering that in turn, helps define marketing problems and generate opportunities. On the other hand, quantitative research engages with the data collection process through interviews, e-mail interactions, surveys and pilot studies. Quantitative aspects for the market research are useful to validate the hypotheses generated during qualitative research method, explore empirical patterns in the data with the help of statistical tools, and finally make the market estimations.
The Brainy Insights offers comprehensive research and analysis, based on a wide assortment of factual insights gained through interviews with CXOs and global experts and secondary data from reliable sources. Our analysts and industry specialist assume vital roles in building up statistical tools and analysis models, which are used to analyse the data and arrive at accurate insights with exceedingly informative research discoveries. The data provided by our organization have proven precious to a diverse range of companies, facilitating them to address issues such as determining which products/services are the most appealing, whether or not customers use the product in the manner anticipated, the purchasing intentions of the market and many others.
Our research methodology encompasses an idyllic combination of primary and secondary initiatives. Key phases involved in this process are listed below:

The phase involves the gathering and collecting of market data and its related information with the help of different sources & research procedures.

The data procurement stage involves in data gathering and collecting through various data sources.
This stage involves in extensive research. These data sources includes:
Purchased Database: Purchased databases play a crucial role in estimating the market sizes irrespective of the domain. Our purchased database includes:
Primary Research: The Brainy Insights interacts with leading companies and experts of the concerned domain to develop the analyst team’s market understanding and expertise. It improves and substantiates every single data presented in the market reports. Primary research mainly involves in telephonic interviews, E-mail interactions and face-to-face interviews with the raw material providers, manufacturers/producers, distributors, & independent consultants. The interviews that we conduct provides valuable data on market size and industry growth trends prevailing in the market. Our organization also conducts surveys with the various industry experts in order to gain overall insights of the industry/market. For instance, in healthcare industry we conduct surveys with the pharmacists, doctors, surgeons and nurses in order to gain insights and key information of a medical product/device/equipment which the customers are going to usage. Surveys are conducted in the form of questionnaire designed by our own analyst team. Surveys plays an important role in primary research because surveys helps us to identify the key target audiences of the market. Additionally, surveys helps to identify the key target audience engaged with the market. Our survey team conducts the survey by targeting the key audience, thus gaining insights from them. Based on the perspectives of the customers, this information is utilized to formulate market strategies. Moreover, market surveys helps us to understand the current competitive situation of the industry. To be precise, our survey process typically involve with the 360 analysis of the market. This analytical process begins by identifying the prospective customers for a product or service related to the market/industry to obtain data on how a product/service could fit into customers’ lives.

Secondary Research: The secondary data sources includes information published by the on-profit organizations such as World bank, WHO, company fillings, investor presentations, annual reports, national government documents, statistical databases, blogs, articles, white papers and others. From the annual report, we analyse a company’s revenue to understand the key segment and market share of that organization in a particular region. We analyse the company websites and adopt the product mapping technique which is important for deriving the segment revenue. In the product mapping method, we select and categorize the products offered by the companies catering to domain specific market, deduce the product revenue for each of the companies so as to get overall estimation of the market size. We also source data and analyses trends based on information received from supply side and demand side intermediaries in the value chain. The supply side denotes the data gathered from supplier, distributor, wholesaler and the demand side illustrates the data gathered from the end customers for respective market domain.

The supply side for a domain specific market is analysed by:
The demand side for the market is estimated through:
In-house Library: Apart from these third-party sources, we have our in-house library of qualitative and quantitative information. Our in-house database includes market data for various industry and domains. These data are updated on regular basis as per the changing market scenario. Our library includes, historic databases, internal audit reports and archives.
Sometimes there are instances where there is no metadata or raw data available for any domain specific market. For those cases, we use our expertise to forecast and estimate the market size in order to generate comprehensive data sets. Our analyst team adopt a robust research technique in order to produce the estimates:
Data Synthesis: This stage involves the analysis & mapping of all the information obtained from the previous step. It also involves in scrutinizing the data for any discrepancy observed while data gathering related to the market. The data is collected with consideration to the heterogeneity of sources. Robust scientific techniques are in place for synthesizing disparate data sets and provide the essential contextual information that can orient market strategies. The Brainy Insights has extensive experience in data synthesis where the data passes through various stages:


Market Deduction & Formulation: The final stage comprises of assigning data points at appropriate market spaces so as to deduce feasible conclusions. Analyst perspective & subject matter expert based holistic form of market sizing coupled with industry analysis also plays a crucial role in this stage.
This stage involves in finalization of the market size and numbers that we have collected from data integration step. With data interpolation, it is made sure that there is no gap in the market data. Successful trend analysis is done by our analysts using extrapolation techniques, which provide the best possible forecasts for the market.
Data Validation & Market Feedback: Validation is the most important step in the process. Validation & re-validation via an intricately designed process helps us finalize data-points to be used for final calculations.

The Brainy Insights interacts with leading companies and experts of the concerned domain to develop the analyst team’s market understanding and expertise. It improves and substantiates every single data presented in the market reports. The data validation interview and discussion panels are typically composed of the most experienced industry members. The participants include, however, are not limited to:
Moreover, we always validate our data and findings through primary respondents from all the major regions we are working on.


Free Customization
Fortune 500 Clients
Free Yearly Update On Purchase Of Multi/Corporate License
Companies Served Till Date