- +1-315-215-1633
- sales@thebrainyinsights.com

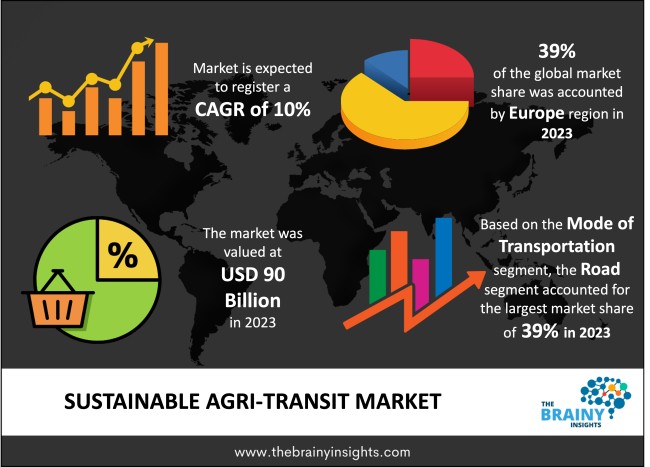
The global sustainable Agri-transit market was valued at USD 90 billion in 2023 and grew at a CAGR of 10% from 2024 to 2033. The market is expected to reach USD 233.43 billion by 2033. The growing emphasis on sustainability in agriculture given the rising concerns about climate change will drive the growth of the global sustainable Agri-transit market.
The sustainable Agri-transit can be defined as the management and utilisation of practices and strategies in transit of agricultural products in sustainable ways. The main objective of sustainable Agri-transit is to focus on the transport needs of agricultural produce and reduce the environmental costs incurred during transport. This includes emission control, energy management, low fuel usage and environmentally friendly means of transport. Another especially significant component of sustainable Agri-transit is the growing sustainable in the transport sector through the use of electric or hybrid vehicles and the combined use of biofuels or hydrogen. These technologies contribute to the minimization of fossil fuel utilization and the carbon emissions that are associated with these fossil-fuel based vehicles. Moreover, it involves optimizing delivery routes and improving payload factors, as well as using advanced technologies to provide more effective route maps to minimize fuel consumption and, as a result, the total amount of emissions. Another factor includes proper packaging facilitates to reduce wastage of the products. Sophisticated technologies such as Cold Chain Logistics are integrated to maintain quality of fresh and perishable agricultural produce such as fruits, vegetables and meat, without using excessive energy. Sustainable Agri-transit also corresponds to the concept of sustainable agriculture which implies decrease in the carbon foot print, enhancing the quality of soil and encouraging sustainable and eco-friendly form of farming. These practices can equate to more sustainable, more effective, and more environmentally friendly agriculture transit system accessible to the farmers, transporters, distributors, among other stakeholders.
Get an overview of this study by requesting a free sample
Government support and incentives – Ministries and authorities in various countries are gradually adopting progressive measures to reduce the unfavourable effects of transportation on the environment, such as greenhouse emissions, air pollution as well as the overall consumption of resources. These measures have forced the agriculture sector to shift to alternatives such as electric or hybrid transport vehicles. It also encourages organizations to integrate low carbon technologies and increase the efficiency of their supply chain. Moreover, the use of carbon credits or government grants for the implementation of sustainable technologies in logistics like sustainable Agri-transit also contributes to the market’s growth. The European Green Deal launched recently is a good example of a policy framework that enshrines emission cuts in all sectors of the economy, including transport by 2050 at the latest. In addition, specific rules related to sustainable packaging and reduced waste generation in supply chains as well as worldwide environmental protocols such as the Paris Accord are also leading to the adoption of sustainable Agri-transit frameworks. The increasing stringency of regulations and challenging targets force companies to adopt sustainability measures as not only legal requirements but also to gain market advantage.
High costs of sustainable Agri-transit – High fixed costs are one of the main challenges that limit the adoption of sustainable Agri-transit, especially in the case of small and medium actors of the agricultural industry. Converting to environmentally sustainable transport systems sometimes entails a large amount of capital costs. For example, electrified or plug-in hybrid vehicles that form the basis of decreasing carbon emission entails more initial cost than conventional diesel vehicles. Likewise, the incorporation of cold chain logistics systems usually entails substantial costs. In addition to vehicles and storage, other costs include the subscription service cost for smart logistics solutions that employ artificial intelligence and machine learning, as well as the cost of training employees on when and how to effectively use the tools they purchase. Therefore, high initial cost remains a major drawback, meaning that despite efficiency, cost and flexibility benefits in the long run, sustainable Agri-transit systems do not develop quickly.
Technological advancements and innovations – A radically important innovation is the adoption of electrical/electrified automobiles significantly cutting down greenhouse gases compared to diesel trucks. These vehicles not only reduce the carbon emissions of agricultural transit, but can also reduce the long-term fuel costs. Also, new generations of battery have made electric vehicles to more efficient. Increasing access to sustainable packaging and logistics is transforming agricultural transit by promoting sustainable practices. Recyclable packaging materials such as plant fibre and bio-polymers used in the packaging do not pollute the environment and also are biodegradable as opposed to regular plastic. Furthermore, intelligent management logistics software which involve the use of IoT telemetry and AI based routing adds to sustainability efforts. Combined, these advancements help agricultural producers and distributors contribute to a decrease in emissions and increase sustainability compliance and the expansion of sustainable Agri-transit.
The regions analysed for the market include North America, Europe, South America, Asia Pacific, the Middle East, and Africa. Europe emerged as the most significant global sustainable Agri-transit market, with a 39% market revenue share in 2023.
Europe is projected to lead the sustainable Agri-transit market because of its relatively developed infrastructure and environment friendly policies. The European Union (EU) has been one of the global pioneers of green logistics. Regulatory policies are supported by subsidies and funding schemes for electric vehicles (EVs), bio fuels and energy efficient cold chain systems. Europe has a good infrastructure base in terms of road network, railways and ports; and the infrastructure is in a good condition for multimodal transport system. Moreover, the accessibility to EV charging stations and renewable energy-powered cold rooms contribute to the popularization of green logistics technologies. Another reason is a particularly high focus on R&D in Europe, which adds to the continent’s leadership in the sustainable Agri-transit market. Europe is enjoying almost 50% of the global intermodal rail share for transit because of the increased consumer force demanding goods that are sustainably sourced and transported. All these factors taken together make it possible for Europe to continue foraging new ways of practicing sustainable agricultural logistics.
Europe Region Sustainable Agri-Transit Market Share in 2023 - 39%
www.thebrainyinsights.com
Check the geographical analysis of this market by requesting a free sample
The mode of transportation segment is divided into road, rail, sea and air. The road segment dominated the market, with a market share of around 39% in 2023. Sustainable Agri-transit market by road is the dominant mode of transportation because this mode of transport offers flexibility, accessibility and reach which is very essential for transportation of agricultural goods. The last-mile delivery capacity offered by road is rather valuable for the agriculture industry, as time-sensitive products, including fruits and vegetables, dairy products, and meat, require proper in-time transportation. Road transport’s dominance is supported by improvements in vehicle technologies that allow for more environmentally-friendly transport, including electric and hybrid trucks. These vehicles substantially decrease greenhouse emissions, enable compliance to worldwide environmental standards and legislations. Additional technologies such as route planning and route tracking tools continue to improve efficiency by significantly cutting the amount of fuel consumed and, therefore, the number of emissions released. The flexibility and the ongoing investments in infrastructure of the road transport system will contribute to its continued dominance in the market.
The vehicle type segment is divided into electric vehicles (EVs), hybrid vehicles and conventional vehicles with biofuels. The electric vehicles (EVs) segment dominated the market, with a market share of around 42% in 2023. EVs have become the leading segment in sustainable Agri-transit because they reduce greenhouse emissions, cut costs and the dependence on fossil fuels. EVs are viable and cost-efficient in the long-term. They are the most efficient way to achieve sustainability in Agri-transit. Another strength that has emerged in favour of EV supply is the increasing diffusion of subsidies and incentives provided by governments all over the world to encourage green mobility. They range from tax incentives and reduced registration costs, subsidies for the purchase of EVs. EVs are most suitable in short and medium commute, which is often needed in the agricultural industry to transport products to shops, and storage centres. Increasing infrastructure for electric vehicles, continued investment in charging technologies and product innovations in EVs will contribute to the segment’s dominance in the market.
The application segment is divided into perishable goods transport and non-perishable goods transport. The perishable goods transport segment dominated the market, with a market share of around 56% in 2023. Perishable goods include fruits, vegetables, dairy products, meat and seafood. These are products that easily get spoilt in the course of transportation. Consumers always prefer fresh and quality products and there is always concern on safety of products especially perishable goods which require proper handling through the system. Trade in perishable products especially for the regions with different climate conditions also increases the dominance of this segment. International horticulture marketing online and offline also continues to rely on fresh produce transit solutions to satisfy the increased consumer demand for products from other countries, as well as products that are out of season.
The technology segment is divided into cold chain logistics, smart route optimization tools, and energy-efficient warehousing. The cold chain logistics segment dominated the market, with a market share of around 41% in 2023. Cold chain logistics account for a significant share of the sustainable Agri-transit market because of the sensitivity of Perishable Agricultural Commodity (PAC), which requires effective chain distribution and handling systems. These products are very temperature sensitive and cold chain systems help to maintain temperature limits required to contain the nutritional and shelf-life characteristics, and to minimize waste. Proliferation of cold chain logistics is possible due to the development of efficient methods of refrigeration and energy efficient refrigeration mechanisms to transport the temperature sensitive products efficiently. Technological improvements across areas like solar-powered refrigeration units and environmentally friendly refrigerants lowers the impact of these systems on the environment whilst enhancing the integrity of storage climates. Moreover, the integration of IoT and real-time monitoring has improved cold chain by meeting the required temperature conditions, and monitoring within the chain process. The necessity of cold chain logistics has therefore risen in tandem with the customer demand for fresh and organic food produce. This makes it possible for agricultural products to be produced and transported to regions they are demanded without a negative impact on quality of these products. In addition, growing consciousness of the authorities towards a sense of food safety and quality regarding meals along with the desire to minimize heedless food wastage has also incrementally augmented the significance of cold chain systems.
the end user segment is divided into farmers and producers, distributors and retailers and exporters. The distributors and retailers segment dominated the market, with a market share of around 44% in 2023. Since sustainable Agri-transit involves transport of agricultural products, distributors and retailers are found to be the main key players in this market due to their strategic position in the supply chain. This is so because they adapt and drive sustainable solutions at an industrial level, addressing the supply chain constraint as consumers demand green products. These entities frequently own and/ or operate the transport chains that integrate farms to processing centres, warehouses, and distribution channels making them strategic to sustainable transportation in agriculture. Distributors and retailers have a wide variety of agricultural produce and therefore have enough needs to integrate new technologies. They not only help to minimize the environmental effects of the movement of goods but also help distributors and retailers to operate at lowered expenses in view of environmental requirements for sustainability. The continuing global trend towards the sourcing and transportation of products in an environmentally friendly fashion has pushed distributors and retailers to adopt strategies aligned with the same goals.
| Attribute | Description |
|---|---|
| Market Size | Revenue (USD Billion) |
| Market size value in 2023 | USD 90 Billion |
| Market size value in 2033 | USD 233.43 Billion |
| CAGR (2024 to 2033) | 10% |
| Historical data | 2020-2022 |
| Base Year | 2023 |
| Forecast | 2024-2033 |
| Region | The regions analysed for the market are Asia Pacific, Europe, South America, North America, and Middle East and Africa. Furthermore, the regions are further analysed at the country level. |
| Segments | Mode of Transportation, Vehicle Type, Application, Technology and End User |
As per The Brainy Insights, the size of the global sustainable Agri-transit market was valued at USD 90 billion in 2023 to USD 233.43 billion by 2033.
Global sustainable Agri-transit market is growing at a CAGR of 10% during the forecast period 2024-2033.
The market's growth will be influenced by government support and incentives.
The maintenance challenges of sustainable Agri-transit could hamper the market growth.
This study forecasts revenue at global, regional, and country levels from 2020 to 2033. The Brainy Insights has segmented the global sustainable Agri-transit market based on below mentioned segments:
Global Sustainable Agri-Transit Market by Mode of Transportation:
Global Sustainable Agri-Transit Market by Vehicle Type:
Global Sustainable Agri-Transit Market by Application:
Global Sustainable Agri-Transit Market by Technology:
Global Sustainable Agri-Transit Market by End User:
Global Sustainable Agri-Transit Market by Region:
Research has its special purpose to undertake marketing efficiently. In this competitive scenario, businesses need information across all industry verticals; the information about customer wants, market demand, competition, industry trends, distribution channels etc. This information needs to be updated regularly because businesses operate in a dynamic environment. Our organization, The Brainy Insights incorporates scientific and systematic research procedures in order to get proper market insights and industry analysis for overall business success. The analysis consists of studying the market from a miniscule level wherein we implement statistical tools which helps us in examining the data with accuracy and precision.
Our research reports feature both; quantitative and qualitative aspects for any market. Qualitative information for any market research process are fundamental because they reveal the customer needs and wants, usage and consumption for any product/service related to a specific industry. This in turn aids the marketers/investors in knowing certain perceptions of the customers. Qualitative research can enlighten about the different product concepts and designs along with unique service offering that in turn, helps define marketing problems and generate opportunities. On the other hand, quantitative research engages with the data collection process through interviews, e-mail interactions, surveys and pilot studies. Quantitative aspects for the market research are useful to validate the hypotheses generated during qualitative research method, explore empirical patterns in the data with the help of statistical tools, and finally make the market estimations.
The Brainy Insights offers comprehensive research and analysis, based on a wide assortment of factual insights gained through interviews with CXOs and global experts and secondary data from reliable sources. Our analysts and industry specialist assume vital roles in building up statistical tools and analysis models, which are used to analyse the data and arrive at accurate insights with exceedingly informative research discoveries. The data provided by our organization have proven precious to a diverse range of companies, facilitating them to address issues such as determining which products/services are the most appealing, whether or not customers use the product in the manner anticipated, the purchasing intentions of the market and many others.
Our research methodology encompasses an idyllic combination of primary and secondary initiatives. Key phases involved in this process are listed below:

The phase involves the gathering and collecting of market data and its related information with the help of different sources & research procedures.

The data procurement stage involves in data gathering and collecting through various data sources.
This stage involves in extensive research. These data sources includes:
Purchased Database: Purchased databases play a crucial role in estimating the market sizes irrespective of the domain. Our purchased database includes:
Primary Research: The Brainy Insights interacts with leading companies and experts of the concerned domain to develop the analyst team’s market understanding and expertise. It improves and substantiates every single data presented in the market reports. Primary research mainly involves in telephonic interviews, E-mail interactions and face-to-face interviews with the raw material providers, manufacturers/producers, distributors, & independent consultants. The interviews that we conduct provides valuable data on market size and industry growth trends prevailing in the market. Our organization also conducts surveys with the various industry experts in order to gain overall insights of the industry/market. For instance, in healthcare industry we conduct surveys with the pharmacists, doctors, surgeons and nurses in order to gain insights and key information of a medical product/device/equipment which the customers are going to usage. Surveys are conducted in the form of questionnaire designed by our own analyst team. Surveys plays an important role in primary research because surveys helps us to identify the key target audiences of the market. Additionally, surveys helps to identify the key target audience engaged with the market. Our survey team conducts the survey by targeting the key audience, thus gaining insights from them. Based on the perspectives of the customers, this information is utilized to formulate market strategies. Moreover, market surveys helps us to understand the current competitive situation of the industry. To be precise, our survey process typically involve with the 360 analysis of the market. This analytical process begins by identifying the prospective customers for a product or service related to the market/industry to obtain data on how a product/service could fit into customers’ lives.

Secondary Research: The secondary data sources includes information published by the on-profit organizations such as World bank, WHO, company fillings, investor presentations, annual reports, national government documents, statistical databases, blogs, articles, white papers and others. From the annual report, we analyse a company’s revenue to understand the key segment and market share of that organization in a particular region. We analyse the company websites and adopt the product mapping technique which is important for deriving the segment revenue. In the product mapping method, we select and categorize the products offered by the companies catering to domain specific market, deduce the product revenue for each of the companies so as to get overall estimation of the market size. We also source data and analyses trends based on information received from supply side and demand side intermediaries in the value chain. The supply side denotes the data gathered from supplier, distributor, wholesaler and the demand side illustrates the data gathered from the end customers for respective market domain.

The supply side for a domain specific market is analysed by:
The demand side for the market is estimated through:
In-house Library: Apart from these third-party sources, we have our in-house library of qualitative and quantitative information. Our in-house database includes market data for various industry and domains. These data are updated on regular basis as per the changing market scenario. Our library includes, historic databases, internal audit reports and archives.
Sometimes there are instances where there is no metadata or raw data available for any domain specific market. For those cases, we use our expertise to forecast and estimate the market size in order to generate comprehensive data sets. Our analyst team adopt a robust research technique in order to produce the estimates:
Data Synthesis: This stage involves the analysis & mapping of all the information obtained from the previous step. It also involves in scrutinizing the data for any discrepancy observed while data gathering related to the market. The data is collected with consideration to the heterogeneity of sources. Robust scientific techniques are in place for synthesizing disparate data sets and provide the essential contextual information that can orient market strategies. The Brainy Insights has extensive experience in data synthesis where the data passes through various stages:


Market Deduction & Formulation: The final stage comprises of assigning data points at appropriate market spaces so as to deduce feasible conclusions. Analyst perspective & subject matter expert based holistic form of market sizing coupled with industry analysis also plays a crucial role in this stage.
This stage involves in finalization of the market size and numbers that we have collected from data integration step. With data interpolation, it is made sure that there is no gap in the market data. Successful trend analysis is done by our analysts using extrapolation techniques, which provide the best possible forecasts for the market.
Data Validation & Market Feedback: Validation is the most important step in the process. Validation & re-validation via an intricately designed process helps us finalize data-points to be used for final calculations.

The Brainy Insights interacts with leading companies and experts of the concerned domain to develop the analyst team’s market understanding and expertise. It improves and substantiates every single data presented in the market reports. The data validation interview and discussion panels are typically composed of the most experienced industry members. The participants include, however, are not limited to:
Moreover, we always validate our data and findings through primary respondents from all the major regions we are working on.


Free Customization
Fortune 500 Clients
Free Yearly Update On Purchase Of Multi/Corporate License
Companies Served Till Date