- +1-315-215-1633
- sales@thebrainyinsights.com

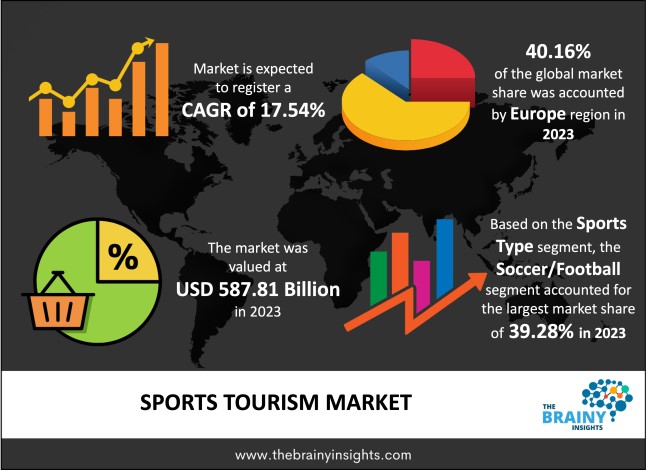
The global Sports Tourism market generated USD 587.81 Billion revenue in 2023 and is projected to grow at a CAGR of 17.54% from 2024 to 2033. The market is expected to reach USD 2958.65 billion by 2033. The burgeoning popularity of global sporting spectacles like the Olympics, Cricket World Cup, NBA and FIFA World Cup is a key catalyst fueling industry expansion. Furthermore, the increasing disposable income among consumers and the rising significance of fitness among the younger demographic contribute significantly to market growth. Furthermore, the rising growth within the global sports industry will continue to drive market expansion throughout the forecast years.
Sports tourism involves travelling to different destinations to engage in or witness sporting events. It includes various activities, including attending major sporting competitions such as the Olympics, Cricket World Cup, Super Bowl or FIFA World Cup and participating in recreational activities like golf tournaments, marathons, or skiing events. This tourism niche caters to individuals passionate about sports, allowing them to explore new destinations while enjoying their favourite sporting activities. Sports tourism destinations often leverage their natural landscapes, climate, and sports infrastructure to attract visitors. Apart from the excitement of sporting events, sports tourism also involves experiencing the host location's culture, cuisine, and attractions. Many travellers combine their love for sports with other leisure activities or cultural exploration, creating memorable and diverse travel experiences. Moreover, sports tourism contributes to local economies by generating revenue for hotels, restaurants, transportation services, and souvenir shops. It also fosters cultural exchange and promotes international cooperation through the shared enthusiasm for sports across borders.
Get an overview of this study by requesting a free sample
Major Sporting Events - Hosting big and famous sporting events such as the Cricket World Cup, Olympics, FIFA World Cup, Super Bowl, and Grand Slam tournaments attracts millions of tourists globally. These events generate significant revenue streams from ticket sales, hospitality services, merchandise, and sponsorships, boosting the local economy and tourism sector.
Infrastructure Development - Investments in sports infrastructure, including stadiums, arenas, training facilities, and accommodation, are essential for hosting large-scale sporting events and attracting sports tourists. Improved infrastructure enhances the visitor experience and enables destinations to host various sports competitions and events.
Destination Appeal - Sports tourists are often drawn to destinations with diverse recreational activities, cultural attractions, and natural landscapes. Cities with iconic landmarks, vibrant nightlife, and rich culinary scenes can complement the sports experience, enticing travellers to extend their stay and explore the destination beyond the event.
Seasonal Dependency - Many sports events are seasonal, leading to fluctuations in tourist arrivals throughout the year. Destinations heavily reliant on sports tourism may experience low visitor numbers during off-peak seasons, impacting revenue streams and local businesses.
High Costs - Hosting major sporting events requires substantial infrastructure, security, marketing, and logistics investments. The financial burden of bidding for and organizing these events can strain the budgets of host cities and governments, particularly if projected economic benefits fail to materialize.
Emerging Markets - The growing interest in sports and rising disposable incomes in emerging economies present opportunities for destinations to tap into new market segments. Developing countries that invest in sports infrastructure and marketing campaigns can attract international visitors and capitalize on the expanding global sports tourism market.
Niche Sports Events - Niche or alternative sports events, such as extreme sports competitions, adventure races, and esports tournaments, appeal to diverse audiences and offer destinations opportunities to differentiate themselves. Hosting niche events can attract enthusiasts and position destinations as unique sporting hubs with specialized offerings.
Competition from Other Destinations - The global nature of sports tourism means that destinations must compete with each other to attract events and visitors. Established sports hubs with well-developed infrastructure, strong tourism branding, and ample resources may overshadow emerging destinations, making it challenging for newcomers to gain visibility and attract major events.
Infrastructure Overload and Legacy Issues - Building and upgrading sports infrastructure for major events can lead to overcapacity and legacy issues post-event. Unused stadiums, arenas, and accommodation facilities may become financial liabilities for host cities if they cannot be repurposed or sustained by ongoing demand for sports tourism.
The regions analyzed for the market include North America, Europe, South America, Asia Pacific, the Middle East, and Africa. Europe emerged as the most prominent global Sports Tourism market, with a 40.16% market revenue share in 2023.
Europe has a rich sporting heritage with centuries-old traditions in various sports disciplines such as football (soccer), rugby, cricket, tennis, cycling, and athletics. The region's historical significance in shaping modern sports culture and its passionate fan base contribute to its appeal as a premier sports tourism destination. Furthermore, Europe hosts various iconic sporting events, including the UEFA Champions League, Wimbledon, Tour de France, Formula 1 Grand Prix races, and the Ryder Cup. These events attract millions of spectators and television viewers worldwide, showcasing Europe's prowess as a leading sports tourism hub. Most importantly, European countries boast world-class sports infrastructure, including state-of-the-art stadiums, arenas, and training facilities. The extensive network of transportation systems, accommodation options, and hospitality services ensures seamless travel experiences for sports tourists attending major events. In addition to sporting events, Europe offers a wealth of cultural and historical attractions, UNESCO World Heritage sites, museums, art galleries, and vibrant nightlife scenes. Tourists can combine their sports experiences with sightseeing tours, culinary adventures, and immersive cultural experiences, enhancing the destination's overall appeal.
Europe Region Sports Tourism Market Share in 2023 - 40.16%
www.thebrainyinsights.com
Check the geographical analysis of this market by requesting a free sample
The sports type segment is divided into basketball, cricket, hockey, soccer/football, tennis and others. The soccer/football segment dominated the market, with a share of around 39.28% in 2023. Football/soccer is one of the most favourite sports globally, with approx. 3.6 billion fans across all continents. Its widespread appeal transcends cultural, linguistic, and geographical barriers, making it a universal language of sport. As a result, soccer events attract a massive international audience, driving significant tourism and economic activity. Additionally, football boasts some of the most iconic and prestigious competitions in sports, such as the FIFA World Cup and UEFA Champions League, as well as domestic leagues like the English Premier League, La Liga, Serie A, and Bundesliga. These tournaments draw millions of spectators and television viewers worldwide, generating immense interest and demand for sports tourism experiences. Moreover, football fans are renowned for their passion, loyalty, and fervent support for their favourite teams and players. The electric atmosphere and camaraderie surrounding soccer matches create unforgettable experiences for spectators, encouraging them to travel long distances to witness live games and immerse themselves in the culture of the sport.
The category segment is classified into domestic and international. The domestic segment dominated the market, with a share of around 57.29% in 2023. Domestic sports tourism benefits from a large and loyal fan base within the country. Many countries have passionate supporters for local sports teams and leagues, driving demand for domestic sports tourism experiences. Moreover, domestic sports leagues and tournaments often have regular seasonal schedules, providing consistent opportunities for sports tourism throughout the year. Fans can plan trips to attend their favourite team's home games or participate in local sporting events without extensive travel. Besides, domestic sports tourism offers accessibility and convenience for travellers, as destinations and venues are typically within easy reach via local transportation networks. Domestic tourists can attend sporting events without needing passports, visas, or long-distance travel arrangements.
The tourism type segment includes active, nostalgia and passive. The passive segment dominated the market, with a share of around 43.61% in 2023. The global appeal of famous sporting events such as the Wimbledon, Olympics, FIFA World Cup, Super Bowl, and the Tour de France drives passive sports tourism. These events attract millions of spectators from around the world who travel to witness the excitement and spectacle of elite-level competition. Furthermore, passive sports tourism often revolves around iconic venues and destinations associated with major sporting events. Stadiums, arenas, and racecourses with historical significance and cultural cachet become pilgrimage sites for sports fans seeking immersive experiences and memorable moments. In addition, sports fans develop strong emotional connections and fandom for their favourite teams, athletes, and sports. Attending live sporting events allows fans to immerse themselves in-game day's excitement, atmosphere, and camaraderie, creating lasting memories and reinforcing their allegiance to the sport.
| Attribute | Description |
|---|---|
| Market Size | Revenue (USD Billion) |
| Market size value in 2023 | USD 587.81 Billion |
| Market size value in 2033 | USD 2958.65 Billion |
| CAGR (2024 to 2033) | 17.54% |
| Historical data | 2020-2022 |
| Base Year | 2023 |
| Forecast | 2024-2033 |
| Region | The regions analyzed for the market are Asia Pacific, Europe, South America, North America, and Middle East & Africa. Furthermore, the regions are further analyzed at the country level. |
| Segments | Sports Type, Category, and Tourism Type |
As per The Brainy Insights, the size of the sports tourism market was valued at USD 587.81 billion in 2023 to USD 2958.65 billion by 2033.
The global sports tourism market is growing at a CAGR of 17.54% during the forecast period 2024-2033.
Europe became the largest market for sports tourism.
Major sporting events and infrastructure development drive the market's growth.
1. Introduction
1.1. Objectives of the Study
1.2. Market Definition
1.3. Research Scope
1.4. Currency
1.5. Key Target Audience
2. Research Methodology and Assumptions
3. Executive Summary
4. Premium Insights
4.1. Porter’s Five Forces Analysis
4.2. Value Chain Analysis
4.3. Top Investment Pockets
4.3.1. Market Attractiveness Analysis By Sports Type
4.3.2. Market Attractiveness Analysis By Category
4.3.3. Market Attractiveness Analysis By Tourism Type
4.3.4. Market Attractiveness Analysis By Region
4.4. Industry Trends
5. Market Dynamics
5.1. Market Evaluation
5.2. Drivers
5.2.1. Major Sporting Events
5.2.2. Infrastructure Development
5.3. Restraints
5.3.1. Seasonal Dependency
5.4. Opportunities
5.4.1. Emerging Markets
5.5. Challenges
5.5.1. Competition from Other Destinations
6. Global Sports Tourism Market Analysis and Forecast, By Sports Type
6.1. Segment Overview
6.2. Basketball
6.3. Cricket
6.4. Hockey
6.5. Soccer/Football
6.6. Tennis
6.7. Others
7. Global Sports Tourism Market Analysis and Forecast, By Category
7.1. Segment Overview
7.2. Domestic
7.3. International
8. Global Sports Tourism Market Analysis and Forecast, By Tourism Type
8.1. Segment Overview
8.2. Active
8.3. Nostalgia
8.4. Passive
9. Global Sports Tourism Market Analysis and Forecast, By Regional Analysis
9.1. Segment Overview
9.2. North America
9.2.1. U.S.
9.2.2. Canada
9.2.3. Mexico
9.3. Europe
9.3.1. Germany
9.3.2. France
9.3.3. U.K.
9.3.4. Italy
9.3.5. Spain
9.4. Asia-Pacific
9.4.1. Japan
9.4.2. China
9.4.3. India
9.5. South America
9.5.1. Brazil
9.6. Middle East and Africa
9.6.1. UAE
9.6.2. South Africa
10. Global Sports Tourism Market-Competitive Landscape
10.1. Overview
10.2. Market Share of Key Players in the Sports Tourism Market
10.2.1. Global Company Market Share
10.2.2. North America Company Market Share
10.2.3. Europe Company Market Share
10.2.4. APAC Company Market Share
10.3. Competitive Situations and Trends
10.3.1. Product Launches and Developments
10.3.2. Partnerships, Collaborations, and Agreements
10.3.3. Mergers & Acquisitions
10.3.4. Expansions
11. Company Profiles
11.1. ATPI Ltd.
11.1.1. Business Overview
11.1.2. Company Snapshot
11.1.3. Company Market Share Analysis
11.1.4. Company Product Portfolio
11.1.5. Recent Developments
11.1.6. SWOT Analysis
11.2. Australian Sports Tours
11.2.1. Business Overview
11.2.2. Company Snapshot
11.2.3. Company Market Share Analysis
11.2.4. Company Product Portfolio
11.2.5. Recent Developments
11.2.6. SWOT Analysis
11.3. Allsports Travel
11.3.1. Business Overview
11.3.2. Company Snapshot
11.3.3. Company Market Share Analysis
11.3.4. Company Product Portfolio
11.3.5. Recent Developments
11.3.6. SWOT Analysis
11.4. Adventure Travel Trade Association
11.4.1. Business Overview
11.4.2. Company Snapshot
11.4.3. Company Market Share Analysis
11.4.4. Company Product Portfolio
11.4.5. Recent Developments
11.4.6. SWOT Analysis
11.5. BAC Sports
11.5.1. Business Overview
11.5.2. Company Snapshot
11.5.3. Company Market Share Analysis
11.5.4. Company Product Portfolio
11.5.5. Recent Developments
11.5.6. SWOT Analysis
11.6. Booking Holdings Inc.
11.6.1. Business Overview
11.6.2. Company Snapshot
11.6.3. Company Market Share Analysis
11.6.4. Company Product Portfolio
11.6.5. Recent Developments
11.6.6. SWOT Analysis
11.7. Cox & Kings Ltd.
11.7.1. Business Overview
11.7.2. Company Snapshot
11.7.3. Company Market Share Analysis
11.7.4. Company Product Portfolio
11.7.5. Recent Developments
11.7.6. SWOT Analysis
11.8. Dream Team Sports Tour
11.8.1. Business Overview
11.8.2. Company Snapshot
11.8.3. Company Market Share Analysis
11.8.4. Company Product Portfolio
11.8.5. Recent Developments
11.8.6. SWOT Analysis
11.9. DTB Sports Management Ltd.
11.9.1. Business Overview
11.9.2. Company Snapshot
11.9.3. Company Market Share Analysis
11.9.4. Company Product Portfolio
11.9.5. Recent Developments
11.9.6. SWOT Analysis
11.10. Expedia Group
11.10.1. Business Overview
11.10.2. Company Snapshot
11.10.3. Company Market Share Analysis
11.10.4. Company Product Portfolio
11.10.5. Recent Developments
11.10.6. SWOT Analysis
11.11. Fanatic Sports Pvt. Ltd.
11.11.1. Business Overview
11.11.2. Company Snapshot
11.11.3. Company Market Share Analysis
11.11.4. Company Product Portfolio
11.11.5. Recent Developments
11.11.6. SWOT Analysis
11.12. Grand Slam Tennis Tours
11.12.1. Business Overview
11.12.2. Company Snapshot
11.12.3. Company Market Share Analysis
11.12.4. Company Product Portfolio
11.12.5. Recent Developments
11.12.6. SWOT Analysis
11.13. Gullivers Sports Travel Ltd.
11.13.1. Business Overview
11.13.2. Company Snapshot
11.13.3. Company Market Share Analysis
11.13.4. Company Product Portfolio
11.13.5. Recent Developments
11.13.6. SWOT Analysis
11.14. Global Sports Travel and Tours Pty Ltd.
11.14.1. Business Overview
11.14.2. Company Snapshot
11.14.3. Company Market Share Analysis
11.14.4. Company Product Portfolio
11.14.5. Recent Developments
11.14.6. SWOT Analysis
11.15. ITC Travel Group
11.15.1. Business Overview
11.15.2. Company Snapshot
11.15.3. Company Market Share Analysis
11.15.4. Company Product Portfolio
11.15.5. Recent Developments
11.15.6. SWOT Analysis
11.16. Inspiresport
11.16.1. Business Overview
11.16.2. Company Snapshot
11.16.3. Company Market Share Analysis
11.16.4. Company Product Portfolio
11.16.5. Recent Developments
11.16.6. SWOT Analysis
11.17. ITW UXP
11.17.1. Business Overview
11.17.2. Company Snapshot
11.17.3. Company Market Share Analysis
11.17.4. Company Product Portfolio
11.17.5. Recent Developments
11.17.6. SWOT Analysis
11.18. KNT CT Holdings
11.18.1. Business Overview
11.18.2. Company Snapshot
11.18.3. Company Market Share Analysis
11.18.4. Company Product Portfolio
11.18.5. Recent Developments
11.18.6. SWOT Analysis
11.19. La Vacanza Travel
11.19.1. Business Overview
11.19.2. Company Snapshot
11.19.3. Company Market Share Analysis
11.19.4. Company Product Portfolio
11.19.5. Recent Developments
11.19.6. SWOT Analysis
11.20. Match Hospitality AG
11.20.1. Business Overview
11.20.2. Company Snapshot
11.20.3. Company Market Share Analysis
11.20.4. Company Product Portfolio
11.20.5. Recent Developments
11.20.6. SWOT Analysis
11.21. Marathon Tours & Travel
11.21.1. Business Overview
11.21.2. Company Snapshot
11.21.3. Company Market Share Analysis
11.21.4. Company Product Portfolio
11.21.5. Recent Developments
11.21.6. SWOT Analysis
11.22. Navigo Sports Tour, LLC
11.22.1. Business Overview
11.22.2. Company Snapshot
11.22.3. Company Market Share Analysis
11.22.4. Company Product Portfolio
11.22.5. Recent Developments
11.22.6. SWOT Analysis
11.23. Premium Sport Tours
11.23.1. Business Overview
11.23.2. Company Snapshot
11.23.3. Company Market Share Analysis
11.23.4. Company Product Portfolio
11.23.5. Recent Developments
11.23.6. SWOT Analysis
11.24. Saddle Skedaddle
11.24.1. Business Overview
11.24.2. Company Snapshot
11.24.3. Company Market Share Analysis
11.24.4. Company Product Portfolio
11.24.5. Recent Developments
11.24.6. SWOT Analysis
11.25. Thomas Cook Group
11.25.1. Business Overview
11.25.2. Company Snapshot
11.25.3. Company Market Share Analysis
11.25.4. Company Product Portfolio
11.25.5. Recent Developments
11.25.6. SWOT Analysis
11.26. TUI Group
11.26.1. Business Overview
11.26.2. Company Snapshot
11.26.3. Company Market Share Analysis
11.26.4. Company Product Portfolio
11.26.5. Recent Developments
11.26.6. SWOT Analysis
11.27. XL Sports Tours
11.27.1. Business Overview
11.27.2. Company Snapshot
11.27.3. Company Market Share Analysis
11.27.4. Company Product Portfolio
11.27.5. Recent Developments
11.27.6. SWOT Analysis
11.28. Xtreme Gap Year
11.28.1. Business Overview
11.28.2. Company Snapshot
11.28.3. Company Market Share Analysis
11.28.4. Company Product Portfolio
11.28.5. Recent Developments
11.28.6. SWOT Analysis
List of Table
1. Global Sports Tourism Market, By Sports Type, 2020-2033 (USD Billion)
2. Global Basketball, Sports Tourism Market, By Region, 2020-2033 (USD Billion)
3. Global Cricket, Sports Tourism Market, By Region, 2020-2033 (USD Billion)
4. Global Hockey, Sports Tourism Market, By Region, 2020-2033 (USD Billion)
5. Global Soccer/Football, Sports Tourism Market, By Region, 2020-2033 (USD Billion)
6. Global Tennis, Sports Tourism Market, By Region, 2020-2033 (USD Billion)
7. Global Others, Sports Tourism Market, By Region, 2020-2033 (USD Billion)
8. Global Sports Tourism Market, By Category, 2020-2033 (USD Billion)
9. Global Domestic, Sports Tourism Market, By Region, 2020-2033 (USD Billion)
10. Global International, Sports Tourism Market, By Region, 2020-2033 (USD Billion)
11. Global Sports Tourism Market, By Tourism Type, 2020-2033 (USD Billion)
12. Global Active, Sports Tourism Market, By Region, 2020-2033 (USD Billion)
13. Global Nostalgia, Sports Tourism Market, By Region, 2020-2033 (USD Billion)
14. Global Passive, Sports Tourism Market, By Region, 2020-2033 (USD Billion)
15. Global Sports Tourism Market, By Region, 2020-2033 (USD Billion)
16. North America Sports Tourism Market, By Sports Type, 2020-2033 (USD Billion)
17. North America Sports Tourism Market, By Category, 2020-2033 (USD Billion)
18. North America Sports Tourism Market, By Tourism Type, 2020-2033 (USD Billion)
19. U.S. Sports Tourism Market, By Sports Type, 2020-2033 (USD Billion)
20. U.S. Sports Tourism Market, By Category, 2020-2033 (USD Billion)
21. U.S. Sports Tourism Market, By Tourism Type, 2020-2033 (USD Billion)
22. Canada Sports Tourism Market, By Sports Type, 2020-2033 (USD Billion)
23. Canada Sports Tourism Market, By Category, 2020-2033 (USD Billion)
24. Canada Sports Tourism Market, By Tourism Type, 2020-2033 (USD Billion)
25. Mexico Sports Tourism Market, By Sports Type, 2020-2033 (USD Billion)
26. Mexico Sports Tourism Market, By Category, 2020-2033 (USD Billion)
27. Mexico Sports Tourism Market, By Tourism Type, 2020-2033 (USD Billion)
28. Europe Sports Tourism Market, By Sports Type, 2020-2033 (USD Billion)
29. Europe Sports Tourism Market, By Category, 2020-2033 (USD Billion)
30. Europe Sports Tourism Market, By Tourism Type, 2020-2033 (USD Billion)
31. Germany Sports Tourism Market, By Sports Type, 2020-2033 (USD Billion)
32. Germany Sports Tourism Market, By Category, 2020-2033 (USD Billion)
33. Germany Sports Tourism Market, By Tourism Type, 2020-2033 (USD Billion)
34. France Sports Tourism Market, By Sports Type, 2020-2033 (USD Billion)
35. France Sports Tourism Market, By Category, 2020-2033 (USD Billion)
36. France Sports Tourism Market, By Tourism Type, 2020-2033 (USD Billion)
37. U.K. Sports Tourism Market, By Sports Type, 2020-2033 (USD Billion)
38. U.K. Sports Tourism Market, By Category, 2020-2033 (USD Billion)
39. U.K. Sports Tourism Market, By Tourism Type, 2020-2033 (USD Billion)
40. Italy Sports Tourism Market, By Sports Type, 2020-2033 (USD Billion)
41. Italy Sports Tourism Market, By Category, 2020-2033 (USD Billion)
42. Italy Sports Tourism Market, By Tourism Type, 2020-2033 (USD Billion)
43. Spain Sports Tourism Market, By Sports Type, 2020-2033 (USD Billion)
44. Spain Sports Tourism Market, By Category, 2020-2033 (USD Billion)
45. Spain Sports Tourism Market, By Tourism Type, 2020-2033 (USD Billion)
46. Asia Pacific Sports Tourism Market, By Sports Type, 2020-2033 (USD Billion)
47. Asia Pacific Sports Tourism Market, By Category, 2020-2033 (USD Billion)
48. Asia Pacific Sports Tourism Market, By Tourism Type, 2020-2033 (USD Billion)
49. Japan Sports Tourism Market, By Sports Type, 2020-2033 (USD Billion)
50. Japan Sports Tourism Market, By Category, 2020-2033 (USD Billion)
51. Japan Sports Tourism Market, By Tourism Type, 2020-2033 (USD Billion)
52. China Sports Tourism Market, By Sports Type, 2020-2033 (USD Billion)
53. China Sports Tourism Market, By Category, 2020-2033 (USD Billion)
54. China Sports Tourism Market, By Tourism Type, 2020-2033 (USD Billion)
55. India Sports Tourism Market, By Sports Type, 2020-2033 (USD Billion)
56. India Sports Tourism Market, By Category, 2020-2033 (USD Billion)
57. India Sports Tourism Market, By Tourism Type, 2020-2033 (USD Billion)
58. South America Sports Tourism Market, By Sports Type, 2020-2033 (USD Billion)
59. South America Sports Tourism Market, By Category, 2020-2033 (USD Billion)
60. South America Sports Tourism Market, By Tourism Type, 2020-2033 (USD Billion)
61. Brazil Sports Tourism Market, By Sports Type, 2020-2033 (USD Billion)
62. Brazil Sports Tourism Market, By Category, 2020-2033 (USD Billion)
63. Brazil Sports Tourism Market, By Tourism Type, 2020-2033 (USD Billion)
64. Middle East and Africa Sports Tourism Market, By Sports Type, 2020-2033 (USD Billion)
65. Middle East and Africa Sports Tourism Market, By Category, 2020-2033 (USD Billion)
66. Middle East and Africa Sports Tourism Market, By Tourism Type, 2020-2033 (USD Billion)
67. UAE Sports Tourism Market, By Sports Type, 2020-2033 (USD Billion)
68. UAE Sports Tourism Market, By Category, 2020-2033 (USD Billion)
69. UAE Sports Tourism Market, By Tourism Type, 2020-2033 (USD Billion)
70. South Africa Sports Tourism Market, By Sports Type, 2020-2033 (USD Billion)
71. South Africa Sports Tourism Market, By Category, 2020-2033 (USD Billion)
72. South Africa Sports Tourism Market, By Tourism Type, 2020-2033 (USD Billion)
List of Figures
1. Global Sports Tourism Market Segmentation
2. Sports Tourism Market: Research Methodology
3. Market Size Estimation Methodology: Bottom-Up Approach
4. Market Size Estimation Methodology: Top-Down Approach
5. Data Triangulation
6. Porter’s Five Forces Analysis
7. Value Chain Analysis
8. Global Sports Tourism Market Attractiveness Analysis By Sports Type
9. Global Sports Tourism Market Attractiveness Analysis By Category
10. Global Sports Tourism Market Attractiveness Analysis By Tourism Type
11. Global Sports Tourism Market Attractiveness Analysis by Region
12. Global Sports Tourism Market: Dynamics
13. Global Sports Tourism Market Share By Sports Type (2024 & 2033)
14. Global Sports Tourism Market Share By Category (2024 & 2033)
15. Global Sports Tourism Market Share By Tourism Type (2024 & 2033)
16. Global Sports Tourism Market Share by Regions (2024 & 2033)
17. Global Sports Tourism Market Share by Company (2023)
This study forecasts revenue at global, regional, and country levels from 2020 to 2033. The Brainy Insights has segmented the global Sports Tourism market based on below-mentioned segments:
Global Sports Tourism Market by Sports Type:
Global Sports Tourism Market by Category:
Global Sports Tourism Market by Tourism Type:
Global Sports Tourism Market by Region:
Research has its special purpose to undertake marketing efficiently. In this competitive scenario, businesses need information across all industry verticals; the information about customer wants, market demand, competition, industry trends, distribution channels etc. This information needs to be updated regularly because businesses operate in a dynamic environment. Our organization, The Brainy Insights incorporates scientific and systematic research procedures in order to get proper market insights and industry analysis for overall business success. The analysis consists of studying the market from a miniscule level wherein we implement statistical tools which helps us in examining the data with accuracy and precision.
Our research reports feature both; quantitative and qualitative aspects for any market. Qualitative information for any market research process are fundamental because they reveal the customer needs and wants, usage and consumption for any product/service related to a specific industry. This in turn aids the marketers/investors in knowing certain perceptions of the customers. Qualitative research can enlighten about the different product concepts and designs along with unique service offering that in turn, helps define marketing problems and generate opportunities. On the other hand, quantitative research engages with the data collection process through interviews, e-mail interactions, surveys and pilot studies. Quantitative aspects for the market research are useful to validate the hypotheses generated during qualitative research method, explore empirical patterns in the data with the help of statistical tools, and finally make the market estimations.
The Brainy Insights offers comprehensive research and analysis, based on a wide assortment of factual insights gained through interviews with CXOs and global experts and secondary data from reliable sources. Our analysts and industry specialist assume vital roles in building up statistical tools and analysis models, which are used to analyse the data and arrive at accurate insights with exceedingly informative research discoveries. The data provided by our organization have proven precious to a diverse range of companies, facilitating them to address issues such as determining which products/services are the most appealing, whether or not customers use the product in the manner anticipated, the purchasing intentions of the market and many others.
Our research methodology encompasses an idyllic combination of primary and secondary initiatives. Key phases involved in this process are listed below:

The phase involves the gathering and collecting of market data and its related information with the help of different sources & research procedures.

The data procurement stage involves in data gathering and collecting through various data sources.
This stage involves in extensive research. These data sources includes:
Purchased Database: Purchased databases play a crucial role in estimating the market sizes irrespective of the domain. Our purchased database includes:
Primary Research: The Brainy Insights interacts with leading companies and experts of the concerned domain to develop the analyst team’s market understanding and expertise. It improves and substantiates every single data presented in the market reports. Primary research mainly involves in telephonic interviews, E-mail interactions and face-to-face interviews with the raw material providers, manufacturers/producers, distributors, & independent consultants. The interviews that we conduct provides valuable data on market size and industry growth trends prevailing in the market. Our organization also conducts surveys with the various industry experts in order to gain overall insights of the industry/market. For instance, in healthcare industry we conduct surveys with the pharmacists, doctors, surgeons and nurses in order to gain insights and key information of a medical product/device/equipment which the customers are going to usage. Surveys are conducted in the form of questionnaire designed by our own analyst team. Surveys plays an important role in primary research because surveys helps us to identify the key target audiences of the market. Additionally, surveys helps to identify the key target audience engaged with the market. Our survey team conducts the survey by targeting the key audience, thus gaining insights from them. Based on the perspectives of the customers, this information is utilized to formulate market strategies. Moreover, market surveys helps us to understand the current competitive situation of the industry. To be precise, our survey process typically involve with the 360 analysis of the market. This analytical process begins by identifying the prospective customers for a product or service related to the market/industry to obtain data on how a product/service could fit into customers’ lives.

Secondary Research: The secondary data sources includes information published by the on-profit organizations such as World bank, WHO, company fillings, investor presentations, annual reports, national government documents, statistical databases, blogs, articles, white papers and others. From the annual report, we analyse a company’s revenue to understand the key segment and market share of that organization in a particular region. We analyse the company websites and adopt the product mapping technique which is important for deriving the segment revenue. In the product mapping method, we select and categorize the products offered by the companies catering to domain specific market, deduce the product revenue for each of the companies so as to get overall estimation of the market size. We also source data and analyses trends based on information received from supply side and demand side intermediaries in the value chain. The supply side denotes the data gathered from supplier, distributor, wholesaler and the demand side illustrates the data gathered from the end customers for respective market domain.

The supply side for a domain specific market is analysed by:
The demand side for the market is estimated through:
In-house Library: Apart from these third-party sources, we have our in-house library of qualitative and quantitative information. Our in-house database includes market data for various industry and domains. These data are updated on regular basis as per the changing market scenario. Our library includes, historic databases, internal audit reports and archives.
Sometimes there are instances where there is no metadata or raw data available for any domain specific market. For those cases, we use our expertise to forecast and estimate the market size in order to generate comprehensive data sets. Our analyst team adopt a robust research technique in order to produce the estimates:
Data Synthesis: This stage involves the analysis & mapping of all the information obtained from the previous step. It also involves in scrutinizing the data for any discrepancy observed while data gathering related to the market. The data is collected with consideration to the heterogeneity of sources. Robust scientific techniques are in place for synthesizing disparate data sets and provide the essential contextual information that can orient market strategies. The Brainy Insights has extensive experience in data synthesis where the data passes through various stages:


Market Deduction & Formulation: The final stage comprises of assigning data points at appropriate market spaces so as to deduce feasible conclusions. Analyst perspective & subject matter expert based holistic form of market sizing coupled with industry analysis also plays a crucial role in this stage.
This stage involves in finalization of the market size and numbers that we have collected from data integration step. With data interpolation, it is made sure that there is no gap in the market data. Successful trend analysis is done by our analysts using extrapolation techniques, which provide the best possible forecasts for the market.
Data Validation & Market Feedback: Validation is the most important step in the process. Validation & re-validation via an intricately designed process helps us finalize data-points to be used for final calculations.

The Brainy Insights interacts with leading companies and experts of the concerned domain to develop the analyst team’s market understanding and expertise. It improves and substantiates every single data presented in the market reports. The data validation interview and discussion panels are typically composed of the most experienced industry members. The participants include, however, are not limited to:
Moreover, we always validate our data and findings through primary respondents from all the major regions we are working on.


Free Customization
Fortune 500 Clients
Free Yearly Update On Purchase Of Multi/Corporate License
Companies Served Till Date