- +1-315-215-1633
- sales@thebrainyinsights.com

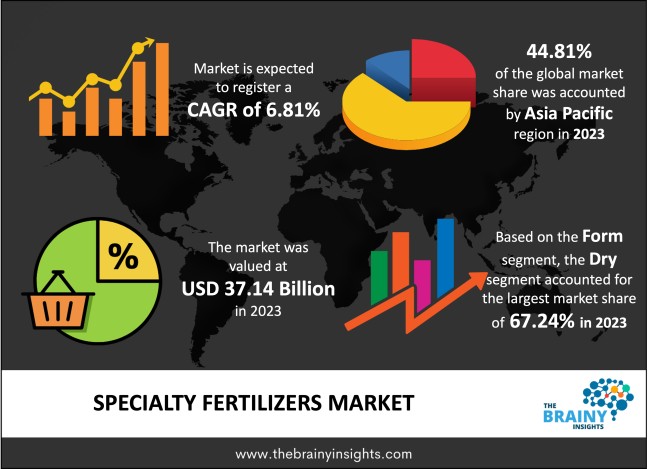
The global Specialty Fertilizers market generated USD 37.14 Billion revenue in 2023 and is projected to grow at a CAGR of 6.81% from 2024 to 2033. The market is expected to reach USD 71.77 Billion by 2033. Some main drivers are the increasing need for high-quality crops and the trend towards crisp, organic farming procedures and techniques, such as precision farming requiring high-quality fertilizer.
Specialty fertilizers can be described as specific and unique types of agricultural inputs used to feed the plants and the soil in a distinct way based on the nutrient demand, the condition of the soil, and the stages of the development of plants. Specific to specialty fertilizers, these are subtle mixtures of a relative nutrient composition different from ordinary fertilizers, which are tuned to certain deficiencies and uptake exactly for the betterment of the crop. These fertilizers may consist of several micronutrients, slow-releasing facets, biostimulants or other numerous additives that are accurately measured to cater to the specific needs of particular crops, kinds of soils or environmental circumstances. Released specialty fertilizers are important in enhancing the success of sustainable agriculture practices, leading to high yields and crop quality with fewer deleterious effects on the environment.
Get an overview of this study by requesting a free sample
Increased Demand for Food Production - Due to the growing population and people’s deficit, there is an upsurge in the demand to increase crop yield and food production. Specialty fertilizers containing precise nutrient ratios are made to address needs such as improving farm productivity and plant growth, thus adequately meeting this need.
Environmental Concerns and Sustainable Agriculture Practices - Most fertilizers have proven useful in exploiting the environment by creating nutrient leaching, soil acidification, and emitting greenhouse gases. Restricted fertilizers provide the nutrient delivery system more specifically and harm the environment than conventional fertilizers are less damaging to the farming culture.
Technological Advancements in Agriculture - New uses of technology in precision farming, sensors and nutrients, and controlled-release fertilization are helping to grow specialty fertilizers. These technologies allow the placement of nutrients at required points, rewarding plant use and preventing wastage.
High investments - Since specialty fertilizers can be very specific regarding recipes and required manufacturing processes, the cost of production of such products is significantly higher than regular fertilizers. This factor can spike end-user charges and dampen uptake, particularly among unsophisticated small-holder farmers in low-income market segments.
Narrow Perception and Education - Specialty fertilizers offer an endless number of benefits. However, farmers may need to learn more about them, how to apply them properly, and why using them is important for improving yields. Knowledge about these products may be necessary to ensure their acceptance, especially in areas with scarce extension services and agricultural education. Otherwise, this factor can hinder market growth.
Growing Use of Nitrogenous Fertilizers - Nitrogenous fertilizers are gaining positive attention due to their applicability for controlled nutrient release, increasing nutrient availability, reducing soil nutrient leaching, and minimizing pollution. Thus, manufacturers could seize this opportunity to increase their research capabilities and develop relevant CR formulations that cater to the requirements of particular crops.
Prospects of High Value Crops - With more growers focusing on growing high-value fresh produce, including vegetables, fruits, and specialty crops, there remains a potential for specialty fertilizers that are specific to the crops’ nutrient requirements. Specialty fertilizers can increase crop yield, quality, and marketability because end-use markets and point-of-sale segments require these inputs.
Artificial Demand and Concentration - In this case, the specialty fertilizers market consists of many manufacturers who offer numerous products, which makes it a competitive market. Challenging a well-established competitor and choosing a segment where the industry is fragmented but not saturated can be difficult for new entrants or SMEs seeking market share.
The Complexity of Nutrient Management - This complexity, therefore, gives nutrient management the challenge of ensuring maximum crop yields while at the same time exercising some control over the adverse effects of the excess nutrients on the surrounding environment. That is because interactions between nutrients can be complicated. At the same time, there are usually differences in growing conditions in the soils, and the crops are different in what they demand from the fertilizers. Thus, offering specific products and value-added services, accompanied by agronomic consultancy, could be useful towards overcoming these shortcomings and improving the usage rate.
The regions analyzed for the market include North America, Europe, South America, Asia Pacific, the Middle East, and Africa. Asia Pacific emerged as the most prominent global Specialty Fertilizers market, with a 44.81% market revenue share in 2023.
The Asia Pacific region's most renowned agricultural economy giants are China, India and Indonesia. The region is endowed with large areas of arable land, and the agricultural sector contributes greatly to the production of specialty fertilizers to raise productivity, quality and economic returns from crop production. In addition, they found that the quantity of food consumed in Asia has increased due to high population density and growth of urban areas, hence the call for improvement in agricultural efficiency. These specificated types incorporate food security into society because of improvements in the health of the soil and the management of nutrients within the soil, and these crops are stronger and able to withstand the harshness of the environment. Furthermore, intensive farming strategies have demanded high-performance fertilizers due to the reduced availability of farming lands and unrealistic growth in the human population to feed. Specialty fertilizers mean defined nutrient packages, precision agriculture technologies, and other related services for the Asia Pacific intensive farming sector.
Asia Pacific Region Specialty Fertilizers Market Share in 2023 - 44.81%
www.thebrainyinsights.com
Check the geographical analysis of this market by requesting a free sample
The type segment is divided into blends of NPK, calcium ammonium nitrate, monoammonium phosphate, potassium nitrate, sulfate of potash, urea derivatives, urea ammonium nitrate and others. The urea ammonium nitrate segment dominated the market with a share of around 24.38% in 2023. Thus, UAN is an aqueous solution of the urea–ammonium nitrate complex, which is easy for plants to absorb as it contains readily available nitrogen. It is in liquid form and, therefore, easy to store, transport, and apply, and this will favour farmers addressing large-scale farming. Further, UAN ofttimes consists of a high level of nitrogen, which is an important element that is required for the growth of plants. This patience enables flexible manipulation of nitrogen sources in the area through fast-released nitrogen complement, combined with the slow release possible through its unique compounding techniques of facilitating efficient vegetative growth, increased crop yields and better protein in grains. Furthermore, nitrogen from UAN fertilizers is highly soluble and can be taken up by soil plants as soon as they are applied. Due to this, efficient nutrient uptake reduces losses through leaching and volatilization of applied fertilizers, thus enhancing the efficient use of applied fertilizers and reducing the impact we make on the environment.
The form segment is classified into dry and liquid. The dry segment dominated the market with a share of around 67.24% in 2023. Storing and transporting dry fertilizers such as granules, powders, or prills is more convenient than liquid fertilizers. They last longer than liquids and are not easily affected by oxidation, volatility or spilling during transportation, storage and usage, something farmers and distributors prefer. Finally, dry fertilizers can be easily spread using spreading equipment, seed drills or irrigation, making this convenient. They enable accurate control of application amounts, frequency, and location, which makes nutrient placement homogeneous and optimal for plant/crop utilization. Secondly, solid or dry fertilizers are cheaper to transport due to their high nutrient content and low density per nutrient compared to liquid fertilizers. This factor makes transporting and distributing them over a long-range easier when there are no efficient settings to deliver liquid fertilizers in rural or hard-to-reach areas.
The crop type segment includes cereals & grains, fruits & vegetables, oilseeds & pulses and others. The fruits & vegetables segment dominated the market with a share of around 42.19% in 2023. Fruits and vegetables raise the nutritional density since they grow faster and involve more intensive use of cropping systems in addition to being high-yielding. Fertilizers prepared from fruits and vegetables requirements enable the solution of all nutrients required for vegetative growth, flowering, fruit formation and improved quality. Also, crops such as fruits and vegetables may undergo several nutrient changes throughout their growth stage due to type of crop, type of variety or environmental factors. Slow-release fertilizers, precision fertilizers and fertigation are formulated differently for each fruit and vegetable crop requirement, and all the nutrients delivered to the crops can be easily absorbed and utilized by the plants. In addition, value-added fertilizers improve the product's (fruit/vegetables) grade, taste, colour, and retail value. However, some imbalance in the grade indicates that shortages or excess nutrients can hamper fruit size, colour, sweet flavour, and shelf life, affecting the consumer preference and market stature of fruits. Besides, micronutrients and other nutrient-coated specialty fertilizers can enhance the established attributes of fruit and vegetable quality that most consumers and retailers are always looking for.
The application segment is split into fertigation, foliar and soil. The fertigation segment dominated the market with a share of around 54.41% in 2023. Fertigation is the systematic and selective procedure of applying the right type of fertilizers or plant foods at the right concentration and amount directly on the root systems of crops using proper irrigation systems. This precision means that the nutrients arrive in specific positions and at specified times, uplifting the efficiency of the nutrient uptake and decreasing the wastage of the nutrients in the environment. In addition, fertigation promotes standardized nutrient uptake since nutrients administered are presented in soluble form, which has a high chance of being absorbed by plants. Top dressing also delivers the nutrients directly to the plant's root zone, minimizing wastage, leaching and runoff, thus making the best out of the costly specialty fertilizers to enhance crop productivity. Furthermore, fertigation systems and methods are very suitable for modifying and adapting to the various crops, types of soil, and environmental factors. They can then quickly and easily be adapted for optimal nutrient amounts and balances of nutrients demanded by specific crops, crop growth phase, and environmental conditions for a particular crop to receive adequate nutrients for proper and maximum growth.
| Attribute | Description |
|---|---|
| Market Size | Revenue (USD Billion) |
| Market size value in 2023 | USD 37.14 Billion |
| Market size value in 2033 | USD 71.77 Billion |
| CAGR (2024 to 2033) | 6.81% |
| Historical data | 2020-2022 |
| Base Year | 2023 |
| Forecast | 2024-2033 |
| Region | The regions analyzed for the market are Asia Pacific, Europe, South America, North America, and Middle East & Africa. Furthermore, the regions are further analyzed at the country level. |
| Segments | Type, Form, Crop Type and Application |
As per The Brainy Insights, the size of the specialty fertilizers market was valued at USD 37.14 billion in 2023 to USD 71.77 billion by 2033.
The global specialty fertilizers market is growing at a CAGR of 6.81% during the forecast period 2024-2033.
Asia Pacific became the largest market for specialty fertilizers.
Increased need for crop yield enhancement and technological advancements in agriculture drive the market's growth.
1. Introduction
1.1. Objectives of the Study
1.2. Market Definition
1.3. Research Scope
1.4. Currency
1.5. Key Target Audience
2. Research Methodology and Assumptions
3. Executive Summary
4. Premium Insights
4.1. Porter’s Five Forces Analysis
4.2. Value Chain Analysis
4.3. Top Investment Pockets
4.3.1. Market Attractiveness Analysis By Type
4.3.2. Market Attractiveness Analysis By Form
4.3.3. Market Attractiveness Analysis By Crop Type
4.3.4. Market Attractiveness Analysis By Application
4.3.5. Market Attractiveness Analysis by Region
4.4. Industry Trends
5. Market Dynamics
5.1. Market Evaluation
5.2. Drivers
5.2.1. Increased Demand for Food Production
5.2.2. Environmental Concerns and Sustainable Agriculture Practices
5.3. Restraints
5.3.1. High investments
5.4. Opportunities
5.4.1. Growing Use of Nitrogenous Fertilizers
5.5. Challenges
5.5.1. Artificial Demand and Concentration
6. Global Specialty Fertilizers Market Analysis and Forecast, By Type
6.1. Segment Overview
6.2. Blends of NPK
6.3. Calcium Ammonium Nitrate
6.4. Monoammonium Phosphate
6.5. Potassium Nitrate
6.6. Sulfate of Potash
6.7. Urea Derivatives
6.8. Urea Ammonium Nitrate
6.9. Others
7. Global Specialty Fertilizers Market Analysis and Forecast, By Form
7.1. Segment Overview
7.2. Dry
7.3. Liquid
8. Global Specialty Fertilizers Market Analysis and Forecast, By Crop Type
8.1. Segment Overview
8.2. Cereals & Grains
8.3. Fruits & Vegetables
8.4. Oilseeds & Pulses
8.5. Others
9. Global Specialty Fertilizers Market Analysis and Forecast, By Application
9.1. Segment Overview
9.2. Fertigation
9.3. Foliar
9.4. Soil
10. Global Specialty Fertilizers Market Analysis and Forecast, By Regional Analysis
10.1. Segment Overview
10.2. North America
10.2.1. U.S.
10.2.2. Canada
10.2.3. Mexico
10.3. Europe
10.3.1. Germany
10.3.2. France
10.3.3. U.K.
10.3.4. Italy
10.3.5. Spain
10.4. Asia-Pacific
10.4.1. Japan
10.4.2. China
10.4.3. India
10.5. South America
10.5.1. Brazil
10.6. Middle East and Africa
10.6.1. UAE
10.6.2. South Africa
11. Global Specialty Fertilizers Market-Competitive Landscape
11.1. Overview
11.2. Market Share of Key Players in the Specialty Fertilizers Market
11.2.1. Global Company Market Share
11.2.2. North America Company Market Share
11.2.3. Europe Company Market Share
11.2.4. APAC Company Market Share
11.3. Competitive Situations and Trends
11.3.1. Product Launches and Developments
11.3.2. Partnerships, Collaborations, and Agreements
11.3.3. Mergers & Acquisitions
11.3.4. Expansions
12. Company Profiles
12.1. Agrium Inc.
12.1.1. Business Overview
12.1.2. Company Snapshot
12.1.3. Company Market Share Analysis
12.1.4. Company Product Portfolio
12.1.5. Recent Developments
12.1.6. SWOT Analysis
12.2. CF Industries and Holdings, Inc.
12.2.1. Business Overview
12.2.2. Company Snapshot
12.2.3. Company Market Share Analysis
12.2.4. Company Product Portfolio
12.2.5. Recent Developments
12.2.6. SWOT Analysis
12.3. Compo Expert GmbH
12.3.1. Business Overview
12.3.2. Company Snapshot
12.3.3. Company Market Share Analysis
12.3.4. Company Product Portfolio
12.3.5. Recent Developments
12.3.6. SWOT Analysis
12.4. Coromandel International Ltd.
12.4.1. Business Overview
12.4.2. Company Snapshot
12.4.3. Company Market Share Analysis
12.4.4. Company Product Portfolio
12.4.5. Recent Developments
12.4.6. SWOT Analysis
12.5. Eurochem Group
12.5.1. Business Overview
12.5.2. Company Snapshot
12.5.3. Company Market Share Analysis
12.5.4. Company Product Portfolio
12.5.5. Recent Developments
12.5.6. SWOT Analysis
12.6. Haifa Group
12.6.1. Business Overview
12.6.2. Company Snapshot
12.6.3. Company Market Share Analysis
12.6.4. Company Product Portfolio
12.6.5. Recent Developments
12.6.6. SWOT Analysis
12.7. ICL
12.7.1. Business Overview
12.7.2. Company Snapshot
12.7.3. Company Market Share Analysis
12.7.4. Company Product Portfolio
12.7.5. Recent Developments
12.7.6. SWOT Analysis
12.8. K+S Aktiengesellschaft
12.8.1. Business Overview
12.8.2. Company Snapshot
12.8.3. Company Market Share Analysis
12.8.4. Company Product Portfolio
12.8.5. Recent Developments
12.8.6. SWOT Analysis
12.9. Koch Industries Inc.
12.9.1. Business Overview
12.9.2. Company Snapshot
12.9.3. Company Market Share Analysis
12.9.4. Company Product Portfolio
12.9.5. Recent Developments
12.9.6. SWOT Analysis
12.10. Mosaic
12.10.1. Business Overview
12.10.2. Company Snapshot
12.10.3. Company Market Share Analysis
12.10.4. Company Product Portfolio
12.10.5. Recent Developments
12.10.6. SWOT Analysis
12.11. Nufarm
12.11.1. Business Overview
12.11.2. Company Snapshot
12.11.3. Company Market Share Analysis
12.11.4. Company Product Portfolio
12.11.5. Recent Developments
12.11.6. SWOT Analysis
12.12. Nutrien Ltd.
12.12.1. Business Overview
12.12.2. Company Snapshot
12.12.3. Company Market Share Analysis
12.12.4. Company Product Portfolio
12.12.5. Recent Developments
12.12.6. SWOT Analysis
12.13. OCP Group
12.13.1. Business Overview
12.13.2. Company Snapshot
12.13.3. Company Market Share Analysis
12.13.4. Company Product Portfolio
12.13.5. Recent Developments
12.13.6. SWOT Analysis
12.14. Sociedad Quimica y Minera de Chile SA
12.14.1. Business Overview
12.14.2. Company Snapshot
12.14.3. Company Market Share Analysis
12.14.4. Company Product Portfolio
12.14.5. Recent Developments
12.14.6. SWOT Analysis
12.15. SQM SA
12.15.1. Business Overview
12.15.2. Company Snapshot
12.15.3. Company Market Share Analysis
12.15.4. Company Product Portfolio
12.15.5. Recent Developments
12.15.6. SWOT Analysis
12.16. Sinochem Group
12.16.1. Business Overview
12.16.2. Company Snapshot
12.16.3. Company Market Share Analysis
12.16.4. Company Product Portfolio
12.16.5. Recent Developments
12.16.6. SWOT Analysis
12.17. The Mosaic Company
12.17.1. Business Overview
12.17.2. Company Snapshot
12.17.3. Company Market Share Analysis
12.17.4. Company Product Portfolio
12.17.5. Recent Developments
12.17.6. SWOT Analysis
12.18. Vardhaman Fertilizers and Seeds Pvt Ltd.
12.18.1. Business Overview
12.18.2. Company Snapshot
12.18.3. Company Market Share Analysis
12.18.4. Company Product Portfolio
12.18.5. Recent Developments
12.18.6. SWOT Analysis
12.19. Verdesian Life Sciences, Sungro Seeds Ltd.
12.19.1. Business Overview
12.19.2. Company Snapshot
12.19.3. Company Market Share Analysis
12.19.4. Company Product Portfolio
12.19.5. Recent Developments
12.19.6. SWOT Analysis
12.20. Yara
12.20.1. Business Overview
12.20.2. Company Snapshot
12.20.3. Company Market Share Analysis
12.20.4. Company Product Portfolio
12.20.5. Recent Developments
12.20.6. SWOT Analysis
List of Table
1. Global Specialty Fertilizers Market, By Type, 2020-2033 (USD Billion) (Tons)
2. Global Blends of NPK Specialty Fertilizers Market, By Region, 2020-2033 (USD Billion) (Tons)
3. Global Calcium Ammonium Nitrate Specialty Fertilizers Market, By Region, 2020-2033 (USD Billion) (Tons)
4. Global Monoammonium Phosphate Specialty Fertilizers Market, By Region, 2020-2033 (USD Billion) (Tons)
5. Global Potassium Nitrate Specialty Fertilizers Market, By Region, 2020-2033 (USD Billion) (Tons)
6. Global Sulfate of Potash Specialty Fertilizers Market, By Region, 2020-2033 (USD Billion) (Tons)
7. Global Urea Derivatives Specialty Fertilizers Market, By Region, 2020-2033 (USD Billion) (Tons)
8. Global Urea Ammonium Nitrate Specialty Fertilizers Market, By Region, 2020-2033 (USD Billion) (Tons)
9. Global Others Specialty Fertilizers Market, By Region, 2020-2033 (USD Billion) (Tons)
10. Global Specialty Fertilizers Market, By Form, 2020-2033 (USD Billion) (Tons)
11. Global Dry Specialty Fertilizers Market, By Region, 2020-2033 (USD Billion) (Tons)
12. Global Liquid Specialty Fertilizers Market, By Region, 2020-2033 (USD Billion) (Tons)
13. Global Specialty Fertilizers Market, By Crop Type, 2020-2033 (USD Billion) (Tons)
14. Global Web-based Systems, Specialty Fertilizers Market, By Region, 2020-2033 (USD Billion) (Tons)
15. Global Cereals & Grains Specialty Fertilizers Market, By Region, 2020-2033 (USD Billion) (Tons)
16. Global Fruits & Vegetables Specialty Fertilizers Market, By Region, 2020-2033 (USD Billion) (Tons)
17. Global Oilseeds & Pulses Specialty Fertilizers Market, By Region, 2020-2033 (USD Billion) (Tons)
18. Global Others Specialty Fertilizers Market, By Region, 2020-2033 (USD Billion) (Tons)
19. Global Specialty Fertilizers Market, By Application, 2020-2033 (USD Billion) (Tons)
20. Global Fertigation Specialty Fertilizers Market, By Region, 2020-2033 (USD Billion) (Tons)
21. Global Foliar Specialty Fertilizers Market, By Region, 2020-2033 (USD Billion) (Tons)
22. Global Specialty Fertilizers Market, By Region, 2020-2033 (USD Billion) (Tons)
23. North America Specialty Fertilizers Market, By Type, 2020-2033 (USD Billion) (Tons)
24. North America Specialty Fertilizers Market, By Form, 2020-2033 (USD Billion) (Tons)
25. North America Specialty Fertilizers Market, By Crop Type, 2020-2033 (USD Billion) (Tons)
26. North America Specialty Fertilizers Market, By Application, 2020-2033 (USD Billion) (Tons)
27. U.S. Specialty Fertilizers Market, By Type, 2020-2033 (USD Billion) (Tons)
28. U.S. Specialty Fertilizers Market, By Form, 2020-2033 (USD Billion) (Tons)
29. U.S. Specialty Fertilizers Market, By Crop Type, 2020-2033 (USD Billion) (Tons)
30. U.S. Specialty Fertilizers Market, By Application, 2020-2033 (USD Billion) (Tons)
31. Canada Specialty Fertilizers Market, By Type, 2020-2033 (USD Billion) (Tons)
32. Canada Specialty Fertilizers Market, By Form, 2020-2033 (USD Billion) (Tons)
33. Canada Specialty Fertilizers Market, By Crop Type, 2020-2033 (USD Billion) (Tons)
34. Canada Specialty Fertilizers Market, By Application, 2020-2033 (USD Billion) (Tons)
35. Mexico Specialty Fertilizers Market, By Type, 2020-2033 (USD Billion) (Tons)
36. Mexico Specialty Fertilizers Market, By Form, 2020-2033 (USD Billion) (Tons)
37. Mexico Specialty Fertilizers Market, By Crop Type, 2020-2033 (USD Billion) (Tons)
38. Mexico Specialty Fertilizers Market, By Application, 2020-2033 (USD Billion) (Tons)
39. Europe Specialty Fertilizers Market, By Type, 2020-2033 (USD Billion) (Tons)
40. Europe Specialty Fertilizers Market, By Form, 2020-2033 (USD Billion) (Tons)
41. Europe Specialty Fertilizers Market, By Crop Type, 2020-2033 (USD Billion) (Tons)
42. Europe Specialty Fertilizers Market, By Application, 2020-2033 (USD Billion) (Tons)
43. Germany Specialty Fertilizers Market, By Type, 2020-2033 (USD Billion) (Tons)
44. Germany Specialty Fertilizers Market, By Form, 2020-2033 (USD Billion) (Tons)
45. Germany Specialty Fertilizers Market, By Crop Type, 2020-2033 (USD Billion) (Tons)
46. Germany Specialty Fertilizers Market, By Application, 2020-2033 (USD Billion) (Tons)
47. France Specialty Fertilizers Market, By Type, 2020-2033 (USD Billion) (Tons)
48. France Specialty Fertilizers Market, By Form, 2020-2033 (USD Billion) (Tons)
49. France Specialty Fertilizers Market, By Crop Type, 2020-2033 (USD Billion) (Tons)
50. France Specialty Fertilizers Market, By Application, 2020-2033 (USD Billion) (Tons)
51. U.K. Specialty Fertilizers Market, By Type, 2020-2033 (USD Billion) (Tons)
52. U.K. Specialty Fertilizers Market, By Form, 2020-2033 (USD Billion) (Tons)
53. U.K. Specialty Fertilizers Market, By Crop Type, 2020-2033 (USD Billion) (Tons)
54. U.K. Specialty Fertilizers Market, By Application, 2020-2033 (USD Billion) (Tons)
55. Italy Specialty Fertilizers Market, By Type, 2020-2033 (USD Billion) (Tons)
56. Italy Specialty Fertilizers Market, By Form, 2020-2033 (USD Billion) (Tons)
57. Italy Specialty Fertilizers Market, By Crop Type, 2020-2033 (USD Billion) (Tons)
58. Italy Specialty Fertilizers Market, By Application, 2020-2033 (USD Billion) (Tons)
59. Spain Specialty Fertilizers Market, By Type, 2020-2033 (USD Billion) (Tons)
60. Spain Specialty Fertilizers Market, By Form, 2020-2033 (USD Billion) (Tons)
61. Spain Specialty Fertilizers Market, By Crop Type, 2020-2033 (USD Billion) (Tons)
62. Spain Specialty Fertilizers Market, By Application, 2020-2033 (USD Billion) (Tons)
63. Asia Pacific Specialty Fertilizers Market, By Type, 2020-2033 (USD Billion) (Tons)
64. Asia Pacific Specialty Fertilizers Market, By Form, 2020-2033 (USD Billion) (Tons)
65. Asia Pacific Specialty Fertilizers Market, By Crop Type, 2020-2033 (USD Billion) (Tons)
66. Asia Pacific Specialty Fertilizers Market, By Application, 2020-2033 (USD Billion) (Tons)
67. Japan Specialty Fertilizers Market, By Type, 2020-2033 (USD Billion) (Tons)
68. Japan Specialty Fertilizers Market, By Form, 2020-2033 (USD Billion) (Tons)
69. Japan Specialty Fertilizers Market, By Crop Type, 2020-2033 (USD Billion) (Tons)
70. Japan Specialty Fertilizers Market, By Application, 2020-2033 (USD Billion) (Tons)
71. China Specialty Fertilizers Market, By Type, 2020-2033 (USD Billion) (Tons)
72. China Specialty Fertilizers Market, By Form, 2020-2033 (USD Billion) (Tons)
73. China Specialty Fertilizers Market, By Crop Type, 2020-2033 (USD Billion) (Tons)
74. China Specialty Fertilizers Market, By Application, 2020-2033 (USD Billion) (Tons)
75. India Specialty Fertilizers Market, By Type, 2020-2033 (USD Billion) (Tons)
76. India Specialty Fertilizers Market, By Form, 2020-2033 (USD Billion) (Tons)
77. India Specialty Fertilizers Market, By Crop Type, 2020-2033 (USD Billion) (Tons)
78. India Specialty Fertilizers Market, By Application, 2020-2033 (USD Billion) (Tons)
79. South America Specialty Fertilizers Market, By Type, 2020-2033 (USD Billion) (Tons)
80. South America Specialty Fertilizers Market, By Form, 2020-2033 (USD Billion) (Tons)
81. South America Specialty Fertilizers Market, By Crop Type, 2020-2033 (USD Billion) (Tons)
82. South America Specialty Fertilizers Market, By Application, 2020-2033 (USD Billion) (Tons)
83. Brazil Specialty Fertilizers Market, By Type, 2020-2033 (USD Billion) (Tons)
84. Brazil Specialty Fertilizers Market, By Form, 2020-2033 (USD Billion) (Tons)
85. Brazil Specialty Fertilizers Market, By Crop Type, 2020-2033 (USD Billion) (Tons)
86. Brazil Specialty Fertilizers Market, By Application, 2020-2033 (USD Billion) (Tons)
87. Middle East and Africa Specialty Fertilizers Market, By Type, 2020-2033 (USD Billion) (Tons)
88. Middle East and Africa Specialty Fertilizers Market, By Form, 2020-2033 (USD Billion) (Tons)
89. Middle East and Africa Specialty Fertilizers Market, By Crop Type, 2020-2033 (USD Billion) (Tons)
90. Middle East and Africa Specialty Fertilizers Market, By Application, 2020-2033 (USD Billion) (Tons)
91. UAE Specialty Fertilizers Market, By Type, 2020-2033 (USD Billion) (Tons)
92. UAE Specialty Fertilizers Market, By Form, 2020-2033 (USD Billion) (Tons)
93. UAE Specialty Fertilizers Market, By Crop Type, 2020-2033 (USD Billion) (Tons)
94. UAE Specialty Fertilizers Market, By Application, 2020-2033 (USD Billion) (Tons)
95. South Africa Specialty Fertilizers Market, By Type, 2020-2033 (USD Billion) (Tons)
96. South Africa Specialty Fertilizers Market, By Form, 2020-2033 (USD Billion) (Tons)
97. South Africa Specialty Fertilizers Market, By Crop Type, 2020-2033 (USD Billion) (Tons)
98. South Africa Specialty Fertilizers Market, By Application, 2020-2033 (USD Billion) (Tons)
List of Figures
1. Global Specialty Fertilizers Market Segmentation
2. Specialty Fertilizers Market: Research Methodology
3. Market Size Estimation Methodology: Bottom-Up Approach
4. Market Size Estimation Methodology: Top-Down Approach
5. Data Triangulation
6. Porter’s Five Forces Analysis
7. Value Chain Analysis
8. Global Specialty Fertilizers Market Attractiveness Analysis By Type
9. Global Specialty Fertilizers Market Attractiveness Analysis By Form
10. Global Specialty Fertilizers Market Attractiveness Analysis By Crop Type
11. Global Specialty Fertilizers Market Attractiveness Analysis By Application
12. Global Specialty Fertilizers Market Attractiveness Analysis by Region
13. Global Specialty Fertilizers Market: Dynamics
14. Global Specialty Fertilizers Market Share By Type (2024 & 2033)
15. Global Specialty Fertilizers Market Share By Form (2024 & 2033)
16. Global Specialty Fertilizers Market Share By Crop Type (2024 & 2033)
17. Global Specialty Fertilizers Market Share By Application (2024 & 2033)
18. Global Specialty Fertilizers Market Share by Regions (2024 & 2033)
19. Global Specialty Fertilizers Market Share by Company (2023)
This study forecasts revenue at global, regional, and country levels from 2020 to 2033. The Brainy Insights has segmented the global Specialty Fertilizers market based on below-mentioned segments:
Global Specialty Fertilizers Market by Type:
Global Specialty Fertilizers Market by Form:
Global Specialty Fertilizers Market by Crop Type:
Global Specialty Fertilizers Market by Application:
Global Specialty Fertilizers Market by Region:
Research has its special purpose to undertake marketing efficiently. In this competitive scenario, businesses need information across all industry verticals; the information about customer wants, market demand, competition, industry trends, distribution channels etc. This information needs to be updated regularly because businesses operate in a dynamic environment. Our organization, The Brainy Insights incorporates scientific and systematic research procedures in order to get proper market insights and industry analysis for overall business success. The analysis consists of studying the market from a miniscule level wherein we implement statistical tools which helps us in examining the data with accuracy and precision.
Our research reports feature both; quantitative and qualitative aspects for any market. Qualitative information for any market research process are fundamental because they reveal the customer needs and wants, usage and consumption for any product/service related to a specific industry. This in turn aids the marketers/investors in knowing certain perceptions of the customers. Qualitative research can enlighten about the different product concepts and designs along with unique service offering that in turn, helps define marketing problems and generate opportunities. On the other hand, quantitative research engages with the data collection process through interviews, e-mail interactions, surveys and pilot studies. Quantitative aspects for the market research are useful to validate the hypotheses generated during qualitative research method, explore empirical patterns in the data with the help of statistical tools, and finally make the market estimations.
The Brainy Insights offers comprehensive research and analysis, based on a wide assortment of factual insights gained through interviews with CXOs and global experts and secondary data from reliable sources. Our analysts and industry specialist assume vital roles in building up statistical tools and analysis models, which are used to analyse the data and arrive at accurate insights with exceedingly informative research discoveries. The data provided by our organization have proven precious to a diverse range of companies, facilitating them to address issues such as determining which products/services are the most appealing, whether or not customers use the product in the manner anticipated, the purchasing intentions of the market and many others.
Our research methodology encompasses an idyllic combination of primary and secondary initiatives. Key phases involved in this process are listed below:

The phase involves the gathering and collecting of market data and its related information with the help of different sources & research procedures.

The data procurement stage involves in data gathering and collecting through various data sources.
This stage involves in extensive research. These data sources includes:
Purchased Database: Purchased databases play a crucial role in estimating the market sizes irrespective of the domain. Our purchased database includes:
Primary Research: The Brainy Insights interacts with leading companies and experts of the concerned domain to develop the analyst team’s market understanding and expertise. It improves and substantiates every single data presented in the market reports. Primary research mainly involves in telephonic interviews, E-mail interactions and face-to-face interviews with the raw material providers, manufacturers/producers, distributors, & independent consultants. The interviews that we conduct provides valuable data on market size and industry growth trends prevailing in the market. Our organization also conducts surveys with the various industry experts in order to gain overall insights of the industry/market. For instance, in healthcare industry we conduct surveys with the pharmacists, doctors, surgeons and nurses in order to gain insights and key information of a medical product/device/equipment which the customers are going to usage. Surveys are conducted in the form of questionnaire designed by our own analyst team. Surveys plays an important role in primary research because surveys helps us to identify the key target audiences of the market. Additionally, surveys helps to identify the key target audience engaged with the market. Our survey team conducts the survey by targeting the key audience, thus gaining insights from them. Based on the perspectives of the customers, this information is utilized to formulate market strategies. Moreover, market surveys helps us to understand the current competitive situation of the industry. To be precise, our survey process typically involve with the 360 analysis of the market. This analytical process begins by identifying the prospective customers for a product or service related to the market/industry to obtain data on how a product/service could fit into customers’ lives.

Secondary Research: The secondary data sources includes information published by the on-profit organizations such as World bank, WHO, company fillings, investor presentations, annual reports, national government documents, statistical databases, blogs, articles, white papers and others. From the annual report, we analyse a company’s revenue to understand the key segment and market share of that organization in a particular region. We analyse the company websites and adopt the product mapping technique which is important for deriving the segment revenue. In the product mapping method, we select and categorize the products offered by the companies catering to domain specific market, deduce the product revenue for each of the companies so as to get overall estimation of the market size. We also source data and analyses trends based on information received from supply side and demand side intermediaries in the value chain. The supply side denotes the data gathered from supplier, distributor, wholesaler and the demand side illustrates the data gathered from the end customers for respective market domain.

The supply side for a domain specific market is analysed by:
The demand side for the market is estimated through:
In-house Library: Apart from these third-party sources, we have our in-house library of qualitative and quantitative information. Our in-house database includes market data for various industry and domains. These data are updated on regular basis as per the changing market scenario. Our library includes, historic databases, internal audit reports and archives.
Sometimes there are instances where there is no metadata or raw data available for any domain specific market. For those cases, we use our expertise to forecast and estimate the market size in order to generate comprehensive data sets. Our analyst team adopt a robust research technique in order to produce the estimates:
Data Synthesis: This stage involves the analysis & mapping of all the information obtained from the previous step. It also involves in scrutinizing the data for any discrepancy observed while data gathering related to the market. The data is collected with consideration to the heterogeneity of sources. Robust scientific techniques are in place for synthesizing disparate data sets and provide the essential contextual information that can orient market strategies. The Brainy Insights has extensive experience in data synthesis where the data passes through various stages:


Market Deduction & Formulation: The final stage comprises of assigning data points at appropriate market spaces so as to deduce feasible conclusions. Analyst perspective & subject matter expert based holistic form of market sizing coupled with industry analysis also plays a crucial role in this stage.
This stage involves in finalization of the market size and numbers that we have collected from data integration step. With data interpolation, it is made sure that there is no gap in the market data. Successful trend analysis is done by our analysts using extrapolation techniques, which provide the best possible forecasts for the market.
Data Validation & Market Feedback: Validation is the most important step in the process. Validation & re-validation via an intricately designed process helps us finalize data-points to be used for final calculations.

The Brainy Insights interacts with leading companies and experts of the concerned domain to develop the analyst team’s market understanding and expertise. It improves and substantiates every single data presented in the market reports. The data validation interview and discussion panels are typically composed of the most experienced industry members. The participants include, however, are not limited to:
Moreover, we always validate our data and findings through primary respondents from all the major regions we are working on.


Free Customization
Fortune 500 Clients
Free Yearly Update On Purchase Of Multi/Corporate License
Companies Served Till Date