- +1-315-215-1633
- sales@thebrainyinsights.com

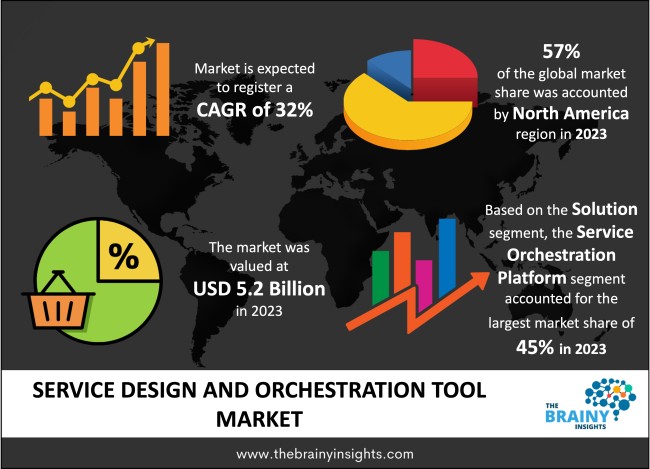
The global Service Design and Orchestration Tool market was valued at USD 5.2 billion in 2023 and growing at a CAGR of 32% from 2024 to 2033. The market is expected to reach USD 83.51 billion by 2033. Rapid shift towards digital transformation in the global market and increasing demand for Service Design and Orchestration Tools in various Industry industries will potentially drive the growth of the Service Design and Orchestration Tool Market. Whereas, increased demand for operational efficiency in the global market and strategic initiatives by the private players in the market may drive the growth of the Service Design and Orchestration Tool Market in the period forecasted.
Service design and orchestration tools are software solutions crafted to aid in the creation, deployment, management, and optimization of digital services and workflows within organizations. These tools are pivotal in contemporary business operations, empowering companies to streamline processes, boost efficiency, and provide top-notch services to their clientele.
Their significance lies in their capacity to automate repetitive tasks, optimize resource usage, and minimize manual involvement. Through automation of service delivery and workflow management, these tools enable organizations to achieve operational excellence, cut costs, and enhance productivity.
Moreover, service design and orchestration tools contribute to delivering a seamless, personalized customer experience. By tailoring services to meet customer needs, promptly addressing issues, and maintaining consistent service quality, businesses can elevate customer satisfaction and loyalty, ultimately fueling growth and success.
In essence, service design and orchestration tools are indispensable components of digital transformation endeavors, allowing organizations to adapt to shifting market dynamics, remain competitive, and meet the ever-evolving expectations of customers in today's fast-paced business landscape.
Get an overview of this study by requesting a free sample
Rapid shift towards digital transformation in the global market– Across industries, organizations are undergoing digital transformation to remain competitive, foster growth, and meet evolving customer expectations. Service design and orchestration tools play a crucial role in enabling this digital transformation by facilitating the design, deployment, and management of digital services and workflows.
Lack of customization and security threat in the market– Service design and orchestration tools provide various features, yet customization options may be restricted, creating hurdles for organizations with unique needs. Additionally, these tools can pose security risks, especially when handling sensitive data or vulnerable to cyber threats. To counter these risks, organizations must enforce strong security measures. However, the market growth of these tools is impeded by customization limitations and the accompanying security concerns.
Increased demand for operational efficiency in the global market- Organizations are tasked with improving operational efficiency, cutting costs, and upholding service quality and innovation. Service design and orchestration tools are instrumental in aiding organizations to meet these goals by automating repetitive tasks, optimizing resource allocation, and reducing manual intervention, thus boosting operational efficiency and saving costs. Delivering a seamless, personalized customer experience is a key focus for organizations aiming to stand out in the market. Service design and coordination tools empower organizations to craft and deliver services tailored to customer needs, address issues swiftly, and maintain consistent service quality, ultimately elevating customer satisfaction and fostering loyalty.
The regions analyzed for the market include North America, Europe, South America, Asia Pacific, the Middle East, and Africa. North America emerged as the largest global Service Design and Orchestration Tool market, accounting for 57% of the total market. Owing to rapidly growing technological advancements in the region, coupled with enterprise software management in the market. Whereas Asia Pacific exhibits the highest growth rate in the market owing to the presence of well-established market players in the region.
North America Region Service Design and Orchestration Tool Market Share in 2023 - 57%
www.thebrainyinsights.com
Check the geographical analysis of this market by requesting a free sample
The service orchestration platform segment emerged as the dominant revenue generator in 2023, capturing a substantial 45% share of the market. This dominance can be attributed to the myriad benefits it offers, including cost reduction, accelerated service delivery, automated management of complex hybrid environments, error elimination in provisioning, and facilitation of self-service provisioning without the need for IT intervention. These factors collectively fuel the revenue growth of this segment.
The BFSI sector dominated revenue generation in 2023, capturing a substantial 54% market share. This was driven by the growing demand for service orchestration, enabling automation of repetitive tasks and cost reduction. Leveraging service orchestration, BFSI companies streamline operations, enhancing efficiency and driving revenue growth. Automated processes not only expedite service delivery but also improve customer experiences, particularly with the rising preference for digital banking due to remote work trends. Adoption of AI-powered chatbots further enhances customer support, particularly in mobile banking, reducing reliance on traditional channels like branches and call centers, thus contributing to BFSI revenue growth.
| Attribute | Description |
|---|---|
| Market Size | Revenue (USD Billion) |
| Market size value in 2023 | USD 5.2 Billion |
| Market size value in 2033 | USD 83.51 Billion |
| CAGR (2024 to 2033) | 32% |
| Historical data | 2020-2022 |
| Base Year | 2023 |
| Forecast | 2024-2033 |
| Region | The regions analyzed for the market are Asia Pacific, Europe, South America, North America, and Middle East & Africa. Furthermore, the regions are further analyzed at the country level. |
| Segments | Solution, Industry |
As per The Brainy Insights, the size of the service design and orchestration tool market was valued at USD 5.2 billion in 2023 to USD 83.51 billion by 2033.
The global service design and orchestration tool market is growing at a CAGR of 32% during the forecast period 2024-2033.
The North America region emerged as the largest market for the service design and orchestration tool.
The rapid shift towards digital transformation in the global market will influence the market's growth.
1. Introduction
1.1. Objectives of the Study
1.2. Market Definition
1.3. Research Scope
1.4. Currency
1.5. Key Target Audience
2. Research Methodology and Assumptions
3. Executive Summary
4. Premium Insights
4.1. Porter’s Five Forces Analysis
4.2. Value Chain Analysis
4.3. Top Investment Pockets
4.3.1. Market Attractiveness Analysis by Solution
4.3.2. Market Attractiveness Analysis by Industry
4.3.3. Market Attractiveness Analysis by Region
4.4. Industry Trends
5. Market Dynamics
5.1. Market Evaluation
5.2. Drivers
5.2.1. Rapid shift towards digital transformation in the global market
5.2.2. Increasing demand for Service Design and Orchestration Tools in various Industry industries
5.3. Restraints
5.3.1. Lack of customization and security threat in the market
5.4. Opportunities
5.4.1. Increased demand for operational efficiency in the global market
5.4.2. Strategic initiatives by the private players in the market
5.5. Challenges
5.5.1. Lack of awareness in the Service Design and Orchestration Tool Market
6. Global Service Design and Orchestration Tool Market Analysis and Forecast, By Solution
6.1. Segment Overview
6.2. Service Orchestration Platform
6.3. Services
7. Global Service Design and Orchestration Tool Market Analysis and Forecast, By Industry
7.1. Segment Overview
7.2. BFSI
7.3. Retail & CPG
7.4. Healthcare
7.5. Government
7.6. Travel & hospitality
7.7. IT & Telecom
7.8. Manufacturing
7.9. Others
8. Global Service Design and Orchestration Tool Market Analysis and Forecast, By Regional Analysis
8.1. Segment Overview
8.2. North America
8.2.1. U.S.
8.2.2. Canada
8.2.3. Mexico
8.3. Europe
8.3.1. Germany
8.3.2. France
8.3.3. U.K.
8.3.4. Italy
8.3.5. Spain
8.4. Asia-Pacific
8.4.1. Japan
8.4.2. China
8.4.3. India
8.5. South America
8.5.1. Brazil
8.6. Middle East and Africa
8.6.1. UAE
8.6.2. South Africa
9. Global Service Design and Orchestration Tool Market-Competitive Landscape
9.1. Overview
9.2. Market Share of Key Players in Global Service Design and Orchestration Tool Market
9.2.1. Global Company Market Share
9.2.2. North America Company Market Share
9.2.3. Europe Company Market Share
9.2.4. APAC Company Market Share
9.3. Competitive Situations and Trends
9.3.1. Product Launches and Developments
9.3.2. Partnerships, Collaborations, and Agreements
9.3.3. Mergers & Acquisitions
9.3.4. Expansions
10. Company Profiles
10.1. Amdocs
10.1.1. Business Overview
10.1.2. Company Snapshot
10.1.3. Company Market Share Analysis
10.1.4. Company Product Portfolio
10.1.5. Recent Developments
10.1.6. SWOT Analysis
10.2. Ericsson
10.2.1. Business Overview
10.2.2. Company Snapshot
10.2.3. Company Market Share Analysis
10.2.4. Company Product Portfolio
10.2.5. Recent Developments
10.2.6. SWOT Analysis
10.3. Forsk
10.3.1. Business Overview
10.3.2. Company Snapshot
10.3.3. Company Market Share Analysis
10.3.4. Company Product Portfolio
10.3.5. Recent Developments
10.3.6. SWOT Analysis
10.4. Hansen Technologies
10.4.1. Business Overview
10.4.2. Company Snapshot
10.4.3. Company Market Share Analysis
10.4.4. Company Product Portfolio
10.4.5. Recent Developments
10.4.6. SWOT Analysis
10.5. Hewlett Packard Enterprise (HPE)
10.5.1. Business Overview
10.5.2. Company Snapshot
10.5.3. Company Market Share Analysis
10.5.4. Company Product Portfolio
10.5.5. Recent Developments
10.5.6. SWOT Analysis
10.6. Infovista
10.6.1. Business Overview
10.6.2. Company Snapshot
10.6.3. Company Market Share Analysis
10.6.4. Company Product Portfolio
10.6.5. Recent Developments
10.6.6. SWOT Analysis
10.7. NEC Corp.
10.7.1. Business Overview
10.7.2. Company Snapshot
10.7.3. Company Market Share Analysis
10.7.4. Company Product Portfolio
10.7.5. Recent Developments
10.7.6. SWOT Analysis
10.8. Nokia
10.8.1. Business Overview
10.8.2. Company Snapshot
10.8.3. Company Market Share Analysis
10.8.4. Company Product Portfolio
10.8.5. Recent Developments
10.8.6. SWOT Analysis
10.9. Oracle
10.9.1. Business Overview
10.9.2. Company Snapshot
10.9.3. Company Market Share Analysis
10.9.4. Company Product Portfolio
10.9.5. Recent Developments
10.9.6. SWOT Analysis
10.10. TEOCO
10.10.1. Business Overview
10.10.2. Company Snapshot
10.10.3. Company Market Share Analysis
10.10.4. Company Product Portfolio
10.10.5. Recent Developments
10.10.6. SWOT Analysis
List of Table
1. Global Service Design and Orchestration Tool Market, By Solution, 2020-2033 (USD Billion)
2. Global Service Orchestration Platform, Service Design and Orchestration Tool Market, By Region, 2020-2033 (USD Billion)
3. Global Services, Service Design and Orchestration Tool Market, By Region, 2020-2033 (USD Billion)
4. Global Service Design and Orchestration Tool Market, By Industry, 2020-2033 (USD Billion)
5. Global BFSI, Service Design and Orchestration Tool Market, By Region, 2020-2033 (USD Billion)
6. Global Retail & CPG, Service Design and Orchestration Tool Market, By Region, 2020-2033 (USD Billion)
7. Global Healthcare, Service Design and Orchestration Tool Market, By Region, 2020-2033 (USD Billion)
8. Global Government, Service Design and Orchestration Tool Market, By Region, 2020-2033 (USD Billion)
9. Global Travel & Hospitality, Service Design and Orchestration Tool Market, By Region, 2020-2033 (USD Billion)
10. Global IT & Telecom, Service Design and Orchestration Tool Market, By Region, 2020-2033 (USD Billion)
11. Global Manufacturing, Service Design and Orchestration Tool Market, By Region, 2020-2033 (USD Billion)
12. Global Others, Service Design and Orchestration Tool Market, By Region, 2020-2033 (USD Billion)
13. Global Service Design and Orchestration Tool Market, By Region, 2020-2033 (USD Billion)
14. North America Service Design and Orchestration Tool Market, By Solution, 2020-2033 (USD Billion)
15. North America Service Design and Orchestration Tool Market, By Industry, 2020-2033 (USD Billion)
16. U.S. Service Design and Orchestration Tool Market, By Solution, 2020-2033 (USD Billion)
17. U.S. Service Design and Orchestration Tool Market, By Industry, 2020-2033 (USD Billion)
18. Canada Service Design and Orchestration Tool Market, By Solution, 2020-2033 (USD Billion)
19. Canada Service Design and Orchestration Tool Market, By Industry, 2020-2033 (USD Billion)
20. Mexico Service Design and Orchestration Tool Market, By Solution, 2020-2033 (USD Billion)
21. Mexico Service Design and Orchestration Tool Market, By Industry, 2020-2033 (USD Billion)
22. Europe Service Design and Orchestration Tool Market, By Solution, 2020-2033 (USD Billion)
23. Europe Service Design and Orchestration Tool Market, By Industry, 2020-2033 (USD Billion)
24. Germany Service Design and Orchestration Tool Market, By Solution, 2020-2033 (USD Billion)
25. Germany Service Design and Orchestration Tool Market, By Industry, 2020-2033 (USD Billion)
26. France Service Design and Orchestration Tool Market, By Solution, 2020-2033 (USD Billion)
27. France Service Design and Orchestration Tool Market, By Industry, 2020-2033 (USD Billion)
28. U.K. Service Design and Orchestration Tool Market, By Solution, 2020-2033 (USD Billion)
29. U.K. Service Design and Orchestration Tool Market, By Industry, 2020-2033 (USD Billion)
30. Italy Service Design and Orchestration Tool Market, By Solution, 2020-2033 (USD Billion)
31. Italy Service Design and Orchestration Tool Market, By Industry, 2020-2033 (USD Billion)
32. Spain Service Design and Orchestration Tool Market, By Solution, 2020-2033 (USD Billion)
33. Spain Service Design and Orchestration Tool Market, By Industry, 2020-2033 (USD Billion)
34. Asia Pacific Service Design and Orchestration Tool Market, By Solution, 2020-2033 (USD Billion)
35. Asia Pacific Service Design and Orchestration Tool Market, By Industry, 2020-2033 (USD Billion)
36. Japan Service Design and Orchestration Tool Market, By Solution, 2020-2033 (USD Billion)
37. Japan Service Design and Orchestration Tool Market, By Industry, 2020-2033 (USD Billion)
38. China Service Design and Orchestration Tool Market, By Solution, 2020-2033 (USD Billion)
39. China Service Design and Orchestration Tool Market, By Industry, 2020-2033 (USD Billion)
40. India Service Design and Orchestration Tool Market, By Solution, 2020-2033 (USD Billion)
41. India Service Design and Orchestration Tool Market, By Industry, 2020-2033 (USD Billion)
42. South America Service Design and Orchestration Tool Market, By Solution, 2020-2033 (USD Billion)
43. South America Service Design and Orchestration Tool Market, By Industry, 2020-2033 (USD Billion)
44. Brazil Service Design and Orchestration Tool Market, By Solution, 2020-2033 (USD Billion)
45. Brazil Service Design and Orchestration Tool Market, By Industry, 2020-2033 (USD Billion)
46. Middle East and Africa Service Design and Orchestration Tool Market, By Solution, 2020-2033 (USD Billion)
47. Middle East and Africa Service Design and Orchestration Tool Market, By Industry, 2020-2033 (USD Billion)
48. UAE Service Design and Orchestration Tool Market, By Solution, 2020-2033 (USD Billion)
49. UAE Service Design and Orchestration Tool Market, By Industry, 2020-2033 (USD Billion)
50. South Africa Service Design and Orchestration Tool Market, By Solution, 2020-2033 (USD Billion)
51. South Africa Service Design and Orchestration Tool Market, By Industry, 2020-2033 (USD Billion)
List of Figures
1. Global Service Design and Orchestration Tool Market Segmentation
2. Global Service Design and Orchestration Tool Market: Research Methodology
3. Market Size Estimation Methodology: Bottom-Up Approach
4. Market Size Estimation Methodology: Top-Down Approach
5. Data Triangulation
6. Porter’s Five Forces Analysis
7. Value Chain Analysis
8. Global Service Design and Orchestration Tool Market Attractiveness Analysis by Solution
9. Global Service Design and Orchestration Tool Market Attractiveness Analysis by Industry
10. Global Service Design and Orchestration Tool Market Attractiveness Analysis by Region
11. Global Service Design and Orchestration Tool Market: Dynamics
12. Global Service Design and Orchestration Tool Market Share by Solution (2023 & 2033)
13. Global Service Design and Orchestration Tool Market Share by Industry (2023 & 2033)
14. Global Service Design and Orchestration Tool Market Share by Regions (2023 & 2033)
15. Global Service Design and Orchestration Tool Market Share by Company (2023)
This study forecasts revenue at global, regional, and country levels from 2020 to 2033. The Brainy Insights has segmented the global service design and orchestration tool market based on below-mentioned segments:
Global Service Design and Orchestration Tool Market by Solution:
Global Service Design and Orchestration Tool Market by Industry:
Global Service Design and Orchestration Tool Market by Region:
Research has its special purpose to undertake marketing efficiently. In this competitive scenario, businesses need information across all industry verticals; the information about customer wants, market demand, competition, industry trends, distribution channels etc. This information needs to be updated regularly because businesses operate in a dynamic environment. Our organization, The Brainy Insights incorporates scientific and systematic research procedures in order to get proper market insights and industry analysis for overall business success. The analysis consists of studying the market from a miniscule level wherein we implement statistical tools which helps us in examining the data with accuracy and precision.
Our research reports feature both; quantitative and qualitative aspects for any market. Qualitative information for any market research process are fundamental because they reveal the customer needs and wants, usage and consumption for any product/service related to a specific industry. This in turn aids the marketers/investors in knowing certain perceptions of the customers. Qualitative research can enlighten about the different product concepts and designs along with unique service offering that in turn, helps define marketing problems and generate opportunities. On the other hand, quantitative research engages with the data collection process through interviews, e-mail interactions, surveys and pilot studies. Quantitative aspects for the market research are useful to validate the hypotheses generated during qualitative research method, explore empirical patterns in the data with the help of statistical tools, and finally make the market estimations.
The Brainy Insights offers comprehensive research and analysis, based on a wide assortment of factual insights gained through interviews with CXOs and global experts and secondary data from reliable sources. Our analysts and industry specialist assume vital roles in building up statistical tools and analysis models, which are used to analyse the data and arrive at accurate insights with exceedingly informative research discoveries. The data provided by our organization have proven precious to a diverse range of companies, facilitating them to address issues such as determining which products/services are the most appealing, whether or not customers use the product in the manner anticipated, the purchasing intentions of the market and many others.
Our research methodology encompasses an idyllic combination of primary and secondary initiatives. Key phases involved in this process are listed below:

The phase involves the gathering and collecting of market data and its related information with the help of different sources & research procedures.

The data procurement stage involves in data gathering and collecting through various data sources.
This stage involves in extensive research. These data sources includes:
Purchased Database: Purchased databases play a crucial role in estimating the market sizes irrespective of the domain. Our purchased database includes:
Primary Research: The Brainy Insights interacts with leading companies and experts of the concerned domain to develop the analyst team’s market understanding and expertise. It improves and substantiates every single data presented in the market reports. Primary research mainly involves in telephonic interviews, E-mail interactions and face-to-face interviews with the raw material providers, manufacturers/producers, distributors, & independent consultants. The interviews that we conduct provides valuable data on market size and industry growth trends prevailing in the market. Our organization also conducts surveys with the various industry experts in order to gain overall insights of the industry/market. For instance, in healthcare industry we conduct surveys with the pharmacists, doctors, surgeons and nurses in order to gain insights and key information of a medical product/device/equipment which the customers are going to usage. Surveys are conducted in the form of questionnaire designed by our own analyst team. Surveys plays an important role in primary research because surveys helps us to identify the key target audiences of the market. Additionally, surveys helps to identify the key target audience engaged with the market. Our survey team conducts the survey by targeting the key audience, thus gaining insights from them. Based on the perspectives of the customers, this information is utilized to formulate market strategies. Moreover, market surveys helps us to understand the current competitive situation of the industry. To be precise, our survey process typically involve with the 360 analysis of the market. This analytical process begins by identifying the prospective customers for a product or service related to the market/industry to obtain data on how a product/service could fit into customers’ lives.

Secondary Research: The secondary data sources includes information published by the on-profit organizations such as World bank, WHO, company fillings, investor presentations, annual reports, national government documents, statistical databases, blogs, articles, white papers and others. From the annual report, we analyse a company’s revenue to understand the key segment and market share of that organization in a particular region. We analyse the company websites and adopt the product mapping technique which is important for deriving the segment revenue. In the product mapping method, we select and categorize the products offered by the companies catering to domain specific market, deduce the product revenue for each of the companies so as to get overall estimation of the market size. We also source data and analyses trends based on information received from supply side and demand side intermediaries in the value chain. The supply side denotes the data gathered from supplier, distributor, wholesaler and the demand side illustrates the data gathered from the end customers for respective market domain.

The supply side for a domain specific market is analysed by:
The demand side for the market is estimated through:
In-house Library: Apart from these third-party sources, we have our in-house library of qualitative and quantitative information. Our in-house database includes market data for various industry and domains. These data are updated on regular basis as per the changing market scenario. Our library includes, historic databases, internal audit reports and archives.
Sometimes there are instances where there is no metadata or raw data available for any domain specific market. For those cases, we use our expertise to forecast and estimate the market size in order to generate comprehensive data sets. Our analyst team adopt a robust research technique in order to produce the estimates:
Data Synthesis: This stage involves the analysis & mapping of all the information obtained from the previous step. It also involves in scrutinizing the data for any discrepancy observed while data gathering related to the market. The data is collected with consideration to the heterogeneity of sources. Robust scientific techniques are in place for synthesizing disparate data sets and provide the essential contextual information that can orient market strategies. The Brainy Insights has extensive experience in data synthesis where the data passes through various stages:


Market Deduction & Formulation: The final stage comprises of assigning data points at appropriate market spaces so as to deduce feasible conclusions. Analyst perspective & subject matter expert based holistic form of market sizing coupled with industry analysis also plays a crucial role in this stage.
This stage involves in finalization of the market size and numbers that we have collected from data integration step. With data interpolation, it is made sure that there is no gap in the market data. Successful trend analysis is done by our analysts using extrapolation techniques, which provide the best possible forecasts for the market.
Data Validation & Market Feedback: Validation is the most important step in the process. Validation & re-validation via an intricately designed process helps us finalize data-points to be used for final calculations.

The Brainy Insights interacts with leading companies and experts of the concerned domain to develop the analyst team’s market understanding and expertise. It improves and substantiates every single data presented in the market reports. The data validation interview and discussion panels are typically composed of the most experienced industry members. The participants include, however, are not limited to:
Moreover, we always validate our data and findings through primary respondents from all the major regions we are working on.


Free Customization
Fortune 500 Clients
Free Yearly Update On Purchase Of Multi/Corporate License
Companies Served Till Date