- +1-315-215-1633
- sales@thebrainyinsights.com

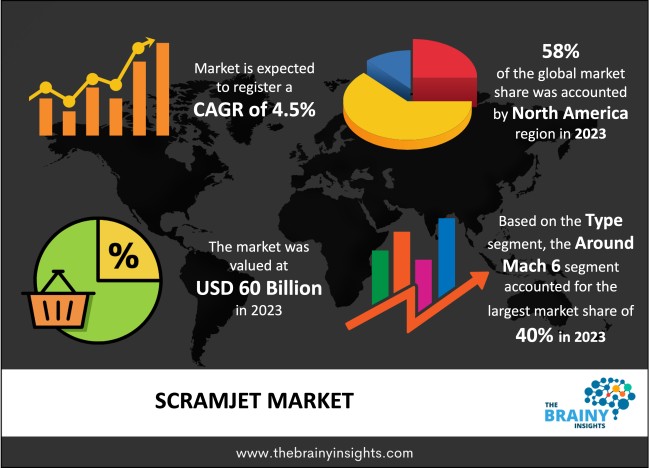
The global Scramjet market was valued at USD 60 billion in 2023 and growing at a CAGR of 4.5% from 2024 to 2033. The market is expected to reach USD 94 billion by 2033. Rising need for reduced in-flight time in the market and technological advancements globally will potentially drive the growth of the Scramjet Market. Whereas, increasing Need for Aging Military Fleets and various strategic initiatives by the private players in the market may drive the growth of the Scramjet Market in the period forecasted.
A scramjet, short for "supersonic combustion ramjet," is an advanced type of jet engine designed for efficient operation at hypersonic speeds, typically exceeding Mach 5. Unlike traditional jet engines that use turbines for air compression, scramjets rely on the vehicle's velocity to compress incoming air. This technology is crucial for enabling faster access to space and supporting hypersonic flight within Earth's atmosphere.
Get an overview of this study by requesting a free sample
Rising need for reduced in-flight time in the market– A primary driver behind the growth of this market is the rising demand for shorter in-flight durations. Supersonic aircraft can cut in-flight times approximately in half compared to conventional commercial jets. The second-generation supersonic jets are estimated to be 30% more efficient than the new generation of subsonic aircraft. This efficiency, coupled with their higher speeds, is expected to significantly boost the growth of the scramjet market.
Strict regulations in the aerospace industry– While the Federal Aviation Administration (FAA) and the U.S. Department of Transportation have established rigorous regulations as criteria for special authorizations for supersonic test flights, supersonic flights remain prohibited in the United States. The FAA has issued final regulations governing civil supersonic test flights in the country.
Increasing Need for Aging Military Fleets- Continual technological advancements are poised to drive the replacement of traditional products. With evolving threats and shifting mission objectives, alongside expensive upgrades and numerous outdated aircraft fleets needing further support, there is a growing demand for supersonic aircraft integrated with advanced surveillance and combat technologies. This surge in demand is expected to significantly contribute to market expansion in the projected period.
The regions analyzed for the market include North America, Europe, South America, Asia Pacific, the Middle East, and Africa. North America emerged as the largest global Scramjet market, accounting for 58% of the total market. Owing to the strong presence of the market players in the region. Whereas Europe exhibits the highest growth rate in the market owing to increasing defense budgets prepared by the European government across various European countries.
North America Region Scramjet Market Share in 2023 - 58%
www.thebrainyinsights.com
Check the geographical analysis of this market by requesting a free sample
Around Mach 6 has dominated the market accounting for 40% of the total market. Owing to increasing government funding in the market. Whereas, Around Mach 3 is expected to provide a lucrative growth rate in the future, owing to the technological breakthrough and providing companies to attain supersonic speed for their purposese in the field of Scramjet Market.
Military Applications have dominated the Scramjet market. Thereby acquiring 45% in the year 2023. Further, it is expected to be the fastest-growing in the market, owing to rapidly growing political concerns across the globe and increasing use of Scramjet use of hyperloop by varied companies in the market.
| Attribute | Description |
|---|---|
| Market Size | Revenue (USD Billion) |
| Market size value in 2023 | USD 60 Billion |
| Market size value in 2033 | USD 94 Billion |
| CAGR (2024 to 2033) | 4.5% |
| Historical data | 2020-2022 |
| Base Year | 2023 |
| Forecast | 2024-2033 |
| Region | The regions analyzed for the market are Asia Pacific, Europe, South America, North America, and Middle East & Africa. Furthermore, the regions are further analyzed at the country level. |
| Segments | Type, Application |
As per The Brainy Insights, the size of the scramjet market was valued at USD 60 billion in 2023 to USD 94 billion by 2033.
The global scramjet market is growing at a CAGR of 4.5% during the forecast period 2024-2033.
The North America region emerged as the largest market for the scramjet.
The rising need for reduced in-flight time in the market will influence the market's growth.
1. Introduction
1.1. Objectives of the Study
1.2. Market Definition
1.3. Research Scope
1.4. Currency
1.5. Key Target Audience
2. Research Methodology and Assumptions
3. Executive Summary
4. Premium Insights
4.1. Porter’s Five Forces Analysis
4.2. Value Chain Analysis
4.3. Top Investment Pockets
4.3.1. Market Attractiveness Analysis by Type
4.3.2. Market Attractiveness Analysis by Application
4.3.3. Market Attractiveness Analysis by Region
4.4. Industry Trends
5. Market Dynamics
5.1. Market Evaluation
5.2. Drivers
5.2.1. Rising need for reduced in-flight time in the market
5.2.2. Technological advancements globally
5.3. Restraints
5.3.1. Strict regulations in the aerospace industry
5.4. Opportunities
5.4.1. Increasing Need for Aging Military Fleets
5.4.2. Various strategic initiatives by the private players in the market
5.5. Challenges
5.5.1. Increased variations in the prices of raw materials
6. Global Scramjet Market Analysis and Forecast, By Type
6.1. Segment Overview
6.2. Around Mach 3
6.3. Around Mach 6
6.4. Other
7. Global Scramjet Market Analysis and Forecast, By Application
7.1. Segment Overview
7.2. Supersonic or Hypersonic Transportation
7.3. Military Applications
7.4. Others
8. Global Scramjet Market Analysis and Forecast, By Regional Analysis
8.1. Segment Overview
8.2. North America
8.2.1. U.S.
8.2.2. Canada
8.2.3. Mexico
8.3. Europe
8.3.1. Germany
8.3.2. France
8.3.3. U.K.
8.3.4. Italy
8.3.5. Spain
8.4. Asia-Pacific
8.4.1. Japan
8.4.2. China
8.4.3. India
8.5. South America
8.5.1. Brazil
8.6. Middle East and Africa
8.6.1. UAE
8.6.2. South Africa
9. Global Scramjet Market-Competitive Landscape
9.1. Overview
9.2. Market Share of Key Players in Global Scramjet Market
9.2.1. Global Company Market Share
9.2.2. North America Company Market Share
9.2.3. Europe Company Market Share
9.2.4. APAC Company Market Share
9.3. Competitive Situations and Trends
9.3.1. Product Launches and Developments
9.3.2. Partnerships, Collaborations, and Agreements
9.3.3. Mergers & Acquisitions
9.3.4. Expansions
10. Company Profiles
10.1. Aerojet Rocketdyne
10.1.1. Business Overview
10.1.2. Company Snapshot
10.1.3. Company Market Share Analysis
10.1.4. Company Product Portfolio
10.1.5. Recent Developments
10.1.6. SWOT Analysis
10.2. NASA
10.2.1. Business Overview
10.2.2. Company Snapshot
10.2.3. Company Market Share Analysis
10.2.4. Company Product Portfolio
10.2.5. Recent Developments
10.2.6. SWOT Analysis
10.3. Boeing
10.3.1. Business Overview
10.3.2. Company Snapshot
10.3.3. Company Market Share Analysis
10.3.4. Company Product Portfolio
10.3.5. Recent Developments
10.3.6. SWOT Analysis
10.4. Northrop Grumman
10.4.1. Business Overview
10.4.2. Company Snapshot
10.4.3. Company Market Share Analysis
10.4.4. Company Product Portfolio
10.4.5. Recent Developments
10.4.6. SWOT Analysis
10.5. Hypersonix Spartan
10.5.1. Business Overview
10.5.2. Company Snapshot
10.5.3. Company Market Share Analysis
10.5.4. Company Product Portfolio
10.5.5. Recent Developments
10.5.6. SWOT Analysis
10.6. Lockheed Martin Corporation
10.6.1. Business Overview
10.6.2. Company Snapshot
10.6.3. Company Market Share Analysis
10.6.4. Company Product Portfolio
10.6.5. Recent Developments
10.6.6. SWOT Analysis
10.7. Beijing Power Machinery Research Institute
10.7.1. Business Overview
10.7.2. Company Snapshot
10.7.3. Company Market Share Analysis
10.7.4. Company Product Portfolio
10.7.5. Recent Developments
10.7.6. SWOT Analysis
10.8. China Aerodynamic Research and Development Center
10.8.1. Business Overview
10.8.2. Company Snapshot
10.8.3. Company Market Share Analysis
10.8.4. Company Product Portfolio
10.8.5. Recent Developments
10.8.6. SWOT Analysis
10.9. National University of Defense Technology
10.9.1. Business Overview
10.9.2. Company Snapshot
10.9.3. Company Market Share Analysis
10.9.4. Company Product Portfolio
10.9.5. Recent Developments
10.9.6. SWOT Analysis
10.10. MBDA
10.10.1. Business Overview
10.10.2. Company Snapshot
10.10.3. Company Market Share Analysis
10.10.4. Company Product Portfolio
10.10.5. Recent Developments
10.10.6. SWOT Analysis
List of Table
1. Global Scramjet Market, By Type, 2020-2033 (USD Billion)
2. Global Around Mach 3, Scramjet Market, By Region, 2020-2033 (USD Billion)
3. Global Around Mach 6, Scramjet Market, By Region, 2020-2033 (USD Billion)
4. Global Others, Scramjet Market, By Region, 2020-2033 (USD Billion)
5. Global Scramjet Market, By Application, 2020-2033 (USD Billion)
6. Global Supersonic or Hypersonic Transportation, Scramjet Market, By Region, 2020-2033 (USD Billion)
7. Global Military Applications, Scramjet Market, By Region, 2020-2033 (USD Billion)
8. Global Others, Scramjet Market, By Region, 2020-2033 (USD Billion)
9. Global Scramjet Market, By Region, 2020-2033 (USD Billion)
10. North America Scramjet Market, By Type, 2020-2033 (USD Billion)
11. North America Scramjet Market, By Application, 2020-2033 (USD Billion)
12. U.S. Scramjet Market, By Type, 2020-2033 (USD Billion)
13. U.S. Scramjet Market, By Application, 2020-2033 (USD Billion)
14. Canada Scramjet Market, By Type, 2020-2033 (USD Billion)
15. Canada Scramjet Market, By Application, 2020-2033 (USD Billion)
16. Mexico Scramjet Market, By Type, 2020-2033 (USD Billion)
17. Mexico Scramjet Market, By Application, 2020-2033 (USD Billion)
18. Europe Scramjet Market, By Type, 2020-2033 (USD Billion)
19. Europe Scramjet Market, By Application, 2020-2033 (USD Billion)
20. Germany Scramjet Market, By Type, 2020-2033 (USD Billion)
21. Germany Scramjet Market, By Application, 2020-2033 (USD Billion)
22. France Scramjet Market, By Type, 2020-2033 (USD Billion)
23. France Scramjet Market, By Application, 2020-2033 (USD Billion)
24. U.K. Scramjet Market, By Type, 2020-2033 (USD Billion)
25. U.K. Scramjet Market, By Application, 2020-2033 (USD Billion)
26. Italy Scramjet Market, By Type, 2020-2033 (USD Billion)
27. Italy Scramjet Market, By Application, 2020-2033 (USD Billion)
28. Spain Scramjet Market, By Type, 2020-2033 (USD Billion)
29. Spain Scramjet Market, By Application, 2020-2033 (USD Billion)
30. Asia Pacific Scramjet Market, By Type, 2020-2033 (USD Billion)
31. Asia Pacific Scramjet Market, By Application, 2020-2033 (USD Billion)
32. Japan Scramjet Market, By Type, 2020-2033 (USD Billion)
33. Japan Scramjet Market, By Application, 2020-2033 (USD Billion)
34. China Scramjet Market, By Type, 2020-2033 (USD Billion)
35. China Scramjet Market, By Application, 2020-2033 (USD Billion)
36. India Scramjet Market, By Type, 2020-2033 (USD Billion)
37. India Scramjet Market, By Application, 2020-2033 (USD Billion)
38. South America Scramjet Market, By Type, 2020-2033 (USD Billion)
39. South America Scramjet Market, By Application, 2020-2033 (USD Billion)
40. Brazil Scramjet Market, By Type, 2020-2033 (USD Billion)
41. Brazil Scramjet Market, By Application, 2020-2033 (USD Billion)
42. Middle East and Africa Scramjet Market, By Type, 2020-2033 (USD Billion)
43. Middle East and Africa Scramjet Market, By Application, 2020-2033 (USD Billion)
44. UAE Scramjet Market, By Type, 2020-2033 (USD Billion)
45. UAE Scramjet Market, By Application, 2020-2033 (USD Billion)
46. South Africa Scramjet Market, By Type, 2020-2033 (USD Billion)
47. South Africa Scramjet Market, By Application, 2020-2033 (USD Billion)
List of Figures
1. Global Scramjet Market Segmentation
2. Global Scramjet Market: Research Methodology
3. Market Size Estimation Methodology: Bottom-Up Approach
4. Market Size Estimation Methodology: Top-Down Approach
5. Data Triangulation
6. Porter’s Five Forces Analysis
7. Value Chain Analysis
8. Global Scramjet Market Attractiveness Analysis by Type
9. Global Scramjet Market Attractiveness Analysis by Application
10. Global Scramjet Market Attractiveness Analysis by Region
11. Global Scramjet Market: Dynamics
12. Global Scramjet Market Share by Type (2023 & 2033)
13. Global Scramjet Market Share by Application (2023 & 2033)
14. Global Scramjet Market Share by Regions (2023 & 2033)
15. Global Scramjet Market Share by Company (2023)
This study forecasts revenue at global, regional, and country levels from 2020 to 2033. The Brainy Insights has segmented the global scramjet market based on below-mentioned segments:
Global Scramjet Market by Type:
Global Scramjet Market by Application:
Global Scramjet Market by Region:
Research has its special purpose to undertake marketing efficiently. In this competitive scenario, businesses need information across all industry verticals; the information about customer wants, market demand, competition, industry trends, distribution channels etc. This information needs to be updated regularly because businesses operate in a dynamic environment. Our organization, The Brainy Insights incorporates scientific and systematic research procedures in order to get proper market insights and industry analysis for overall business success. The analysis consists of studying the market from a miniscule level wherein we implement statistical tools which helps us in examining the data with accuracy and precision.
Our research reports feature both; quantitative and qualitative aspects for any market. Qualitative information for any market research process are fundamental because they reveal the customer needs and wants, usage and consumption for any product/service related to a specific industry. This in turn aids the marketers/investors in knowing certain perceptions of the customers. Qualitative research can enlighten about the different product concepts and designs along with unique service offering that in turn, helps define marketing problems and generate opportunities. On the other hand, quantitative research engages with the data collection process through interviews, e-mail interactions, surveys and pilot studies. Quantitative aspects for the market research are useful to validate the hypotheses generated during qualitative research method, explore empirical patterns in the data with the help of statistical tools, and finally make the market estimations.
The Brainy Insights offers comprehensive research and analysis, based on a wide assortment of factual insights gained through interviews with CXOs and global experts and secondary data from reliable sources. Our analysts and industry specialist assume vital roles in building up statistical tools and analysis models, which are used to analyse the data and arrive at accurate insights with exceedingly informative research discoveries. The data provided by our organization have proven precious to a diverse range of companies, facilitating them to address issues such as determining which products/services are the most appealing, whether or not customers use the product in the manner anticipated, the purchasing intentions of the market and many others.
Our research methodology encompasses an idyllic combination of primary and secondary initiatives. Key phases involved in this process are listed below:

The phase involves the gathering and collecting of market data and its related information with the help of different sources & research procedures.

The data procurement stage involves in data gathering and collecting through various data sources.
This stage involves in extensive research. These data sources includes:
Purchased Database: Purchased databases play a crucial role in estimating the market sizes irrespective of the domain. Our purchased database includes:
Primary Research: The Brainy Insights interacts with leading companies and experts of the concerned domain to develop the analyst team’s market understanding and expertise. It improves and substantiates every single data presented in the market reports. Primary research mainly involves in telephonic interviews, E-mail interactions and face-to-face interviews with the raw material providers, manufacturers/producers, distributors, & independent consultants. The interviews that we conduct provides valuable data on market size and industry growth trends prevailing in the market. Our organization also conducts surveys with the various industry experts in order to gain overall insights of the industry/market. For instance, in healthcare industry we conduct surveys with the pharmacists, doctors, surgeons and nurses in order to gain insights and key information of a medical product/device/equipment which the customers are going to usage. Surveys are conducted in the form of questionnaire designed by our own analyst team. Surveys plays an important role in primary research because surveys helps us to identify the key target audiences of the market. Additionally, surveys helps to identify the key target audience engaged with the market. Our survey team conducts the survey by targeting the key audience, thus gaining insights from them. Based on the perspectives of the customers, this information is utilized to formulate market strategies. Moreover, market surveys helps us to understand the current competitive situation of the industry. To be precise, our survey process typically involve with the 360 analysis of the market. This analytical process begins by identifying the prospective customers for a product or service related to the market/industry to obtain data on how a product/service could fit into customers’ lives.

Secondary Research: The secondary data sources includes information published by the on-profit organizations such as World bank, WHO, company fillings, investor presentations, annual reports, national government documents, statistical databases, blogs, articles, white papers and others. From the annual report, we analyse a company’s revenue to understand the key segment and market share of that organization in a particular region. We analyse the company websites and adopt the product mapping technique which is important for deriving the segment revenue. In the product mapping method, we select and categorize the products offered by the companies catering to domain specific market, deduce the product revenue for each of the companies so as to get overall estimation of the market size. We also source data and analyses trends based on information received from supply side and demand side intermediaries in the value chain. The supply side denotes the data gathered from supplier, distributor, wholesaler and the demand side illustrates the data gathered from the end customers for respective market domain.

The supply side for a domain specific market is analysed by:
The demand side for the market is estimated through:
In-house Library: Apart from these third-party sources, we have our in-house library of qualitative and quantitative information. Our in-house database includes market data for various industry and domains. These data are updated on regular basis as per the changing market scenario. Our library includes, historic databases, internal audit reports and archives.
Sometimes there are instances where there is no metadata or raw data available for any domain specific market. For those cases, we use our expertise to forecast and estimate the market size in order to generate comprehensive data sets. Our analyst team adopt a robust research technique in order to produce the estimates:
Data Synthesis: This stage involves the analysis & mapping of all the information obtained from the previous step. It also involves in scrutinizing the data for any discrepancy observed while data gathering related to the market. The data is collected with consideration to the heterogeneity of sources. Robust scientific techniques are in place for synthesizing disparate data sets and provide the essential contextual information that can orient market strategies. The Brainy Insights has extensive experience in data synthesis where the data passes through various stages:


Market Deduction & Formulation: The final stage comprises of assigning data points at appropriate market spaces so as to deduce feasible conclusions. Analyst perspective & subject matter expert based holistic form of market sizing coupled with industry analysis also plays a crucial role in this stage.
This stage involves in finalization of the market size and numbers that we have collected from data integration step. With data interpolation, it is made sure that there is no gap in the market data. Successful trend analysis is done by our analysts using extrapolation techniques, which provide the best possible forecasts for the market.
Data Validation & Market Feedback: Validation is the most important step in the process. Validation & re-validation via an intricately designed process helps us finalize data-points to be used for final calculations.

The Brainy Insights interacts with leading companies and experts of the concerned domain to develop the analyst team’s market understanding and expertise. It improves and substantiates every single data presented in the market reports. The data validation interview and discussion panels are typically composed of the most experienced industry members. The participants include, however, are not limited to:
Moreover, we always validate our data and findings through primary respondents from all the major regions we are working on.


Free Customization
Fortune 500 Clients
Free Yearly Update On Purchase Of Multi/Corporate License
Companies Served Till Date