- +1-315-215-1633
- sales@thebrainyinsights.com

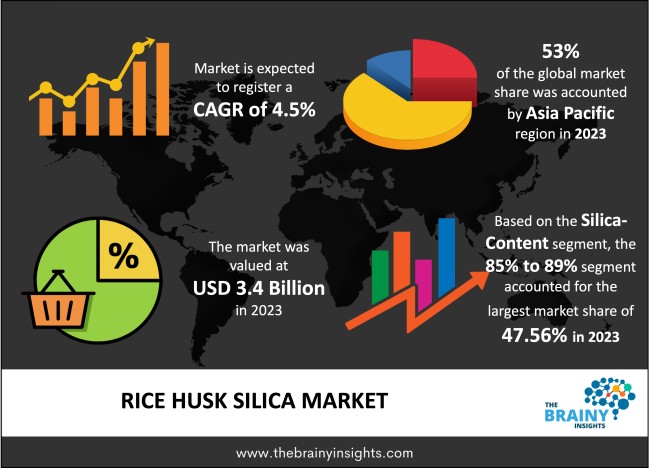
The global Rice Husk Silica market was valued at USD 3.4 billion in 2023 and growing at a CAGR of 4.5% from 2024 to 2033. The market is expected to reach USD 5.28 billion by 2033. Low manufacturing and material costs in the global market and favorable government initiatives in the market will potentially drive the growth of the Rice Husk Silica Market. Whereas, rapidly growing demand for rice husks in the cement and construction industry and rapidly growing technological advancements in the market may drive the growth of the Rice Husk Silica Market in the period forecasted.
Silica, or silicon dioxide (SiO₂), is plentiful in nature, commonly present in quartz and constituting a substantial portion of sand. Yet, in rice husks, silica adopts a biogenic form, indicating it's generated by living organisms, particularly rice plants. In contrast to the crystalline arrangement observed in quartz, the silica contained in rice husks is predominantly amorphous. This quality has significant ramifications for its potential applications and processing methods.
Get an overview of this study by requesting a free sample
Low manufacturing and material costs in the global market– The rice husk ash market thrives on its economical manufacturing process and minimal material expenditures. By utilizing rice husk ash as a primary material, manufacturing expenses are notably reduced, given its status as a byproduct of rice milling, readily accessible, and frequently deemed waste. Additionally, its widespread availability ensures cost-effective sourcing, further bolstering its affordability. Combined with its versatility across multiple sectors including construction, ceramics, and agriculture, the demand for rice husk ash experiences an upsurge. Industries seeking cost-efficient alternatives are particularly drawn to its affordability, driving expansion within the rice husk ash market.
High dependence of manufacturing on the production of rice paddy in the market– The manufacturing of rice husk ash is intricately linked to the production of rice paddy, presenting a significant challenge for the rice husk ash market. Since rice husk ash is a byproduct of rice milling, any fluctuations or disruptions in rice paddy production directly affect its availability and subsequently impact the supply of rice husk ash. Various factors such as adverse weather conditions, changes in agricultural practices, and market volatility can disrupt rice paddy production, leading to shortages and instability in the rice husk ash market. This reliance on rice paddy production highlights the susceptibility of the rice husk ash market to fluctuations in the agricultural sector, posing obstacles to maintaining consistent supply and market stability.
Rapidly growing demand for rice husks in the cement and construction industry- The burgeoning use of rice husk ash in the cement and construction industry signifies a noteworthy opportunity within the rice husk ash market. With its distinct attributes, including high silica content and pozzolanic properties, rice husk ash emerges as an appealing sustainable substitute for conventional construction materials such as cement. By integrating rice husk ash into concrete mixtures, builders can enhance structural integrity, prolong durability, and mitigate environmental impact, providing a green alternative for construction projects. Moreover, its thermal insulation capabilities and resistance to fire render it favorable for a myriad of construction applications, broadening its market appeal. As global awareness and adoption of sustainable construction practices escalate, the demand for rice husk ash within the building sector is poised for expansion, offering lucrative prospects for stakeholders to leverage this evolving trend.
The regions analyzed for the market include North America, Europe, South America, Asia Pacific, the Middle East, and Africa. APAC emerged as the largest global Rice Husk Silica market, accounting for 53% of the total market. Owing to the rapidly growing population in densely populated countries: India and China and the increasing demand for rice in the market in the period forecasted. North America exhibits the highest growth rate in the market owing to the rapidly growing agriculture industry and increasing technological advancements in the region.
APAC Region Rice Husk Silica Market Share in 2023 - 53%
www.thebrainyinsights.com
Check the geographical analysis of this market by requesting a free sample
Rice husk boasting a silica content ranging from 85% to 89% dominated the rice husk ash market in 2023, capturing a substantial market share of 47.56% in the year 2023. This elevated silica content renders it highly sought after for diverse industrial applications spanning construction, manufacturing, agriculture, and water treatment. Silica plays a pivotal role in reinforcing concrete and cement due to its strengthening properties, while also being indispensable in the production of ceramics, glass, and refractory materials. Moreover, its advantages extend to agriculture, where it serves as a beneficial soil amendment, and to water treatment processes, further solidifying its significance in the market.
In 2023, the building and construction sectors emerged as the top consumers of rice husk ash, capturing a market share of 44.1%. This can be attributed to the exceptional properties it offers. Acting as a pozzolanic material, rice husk ash enhances the robustness and longevity of concrete, thereby reducing the reliance on cement and promoting sustainable construction practices. Its lightweight characteristic renders it suitable for insulating materials, facilitating energy-efficient building designs. Moreover, its widespread availability and cost-effectiveness propel its integration into construction projects, especially in regions abundant in rice production. Consequently, the utilization of rice husk ash in building and construction is anticipated to rise, serving as a key driver for the market in the foreseeable future.
| Attribute | Description |
|---|---|
| Market Size | Revenue (USD Billion) |
| Market size value in 2023 | USD 3.4 Billion |
| Market size value in 2033 | USD 5.28 Billion |
| CAGR (2024 to 2033) | 4.5% |
| Historical data | 2020-2022 |
| Base Year | 2023 |
| Forecast | 2024-2033 |
| Region | The regions analyzed for the market are Asia Pacific, Europe, South America, North America, and Middle East & Africa. Furthermore, the regions are further analyzed at the country level. |
| Segments | Application, Silica Content |
As per The Brainy Insights, the size of the rice husk silica market was valued at USD 3.4 billion in 2023 to USD 5.28 billion by 2033.
The global rice husk silica market is growing at a CAGR of 4.5% during the forecast period 2024-2033.
The Asia Pacific region emerged as the largest market for the rice husk silica.
The low manufacturing and material costs in the global market will influence the market's growth.
List of Table
1. Global Rice Husk Silica Market, By Application, 2020-2033 (USD Billion)
2. Global Building and Construction, Rice Husk Silica Market, By Region, 2020-2033 (USD Billion)
3. Global Steel Industry, Rice Husk Silica Market, By Region, 2020-2033 (USD Billion)
4. Global Silica, Rice Husk Silica Market, By Region, 2020-2033 (USD Billion)
5. Global Ceramics & Refractory, Rice Husk Silica Market, By Region, 2020-2033 (USD Billion)
6. Global Rubber, Rice Husk Silica Market, By Region, 2020-2033 (USD Billion)
7. Global Rice Husk Silica Market, By Silica Content, 2020-2033 (USD Billion)
8. Global 80%-84%, Rice Husk Silica Market, By Region, 2020-2033 (USD Billion)
9. Global 85%-89%, Rice Husk Silica Market, By Region, 2020-2033 (USD Billion)
10. Global 90%-94%, Rice Husk Silica Market, By Region, 2020-2033 (USD Billion)
11. Global Greater than 95%, Rice Husk Silica Market, By Region, 2020-2033 (USD Billion)
12. Global Rice Husk Silica Market, By Region, 2020-2033 (USD Billion)
13. North America Rice Husk Silica Market, By Application, 2020-2033 (USD Billion)
14. North America Rice Husk Silica Market, By Silica Content, 2020-2033 (USD Billion)
15. U.S. Rice Husk Silica Market, By Application, 2020-2033 (USD Billion)
16. U.S. Rice Husk Silica Market, By Silica Content, 2020-2033 (USD Billion)
17. Canada Rice Husk Silica Market, By Application, 2020-2033 (USD Billion)
18. Canada Rice Husk Silica Market, By Silica Content, 2020-2033 (USD Billion)
19. Mexico Rice Husk Silica Market, By Application, 2020-2033 (USD Billion)
20. Mexico Rice Husk Silica Market, By Silica Content, 2020-2033 (USD Billion)
21. Europe Rice Husk Silica Market, By Application, 2020-2033 (USD Billion)
22. Europe Rice Husk Silica Market, By Silica Content, 2020-2033 (USD Billion)
23. Germany Rice Husk Silica Market, By Application, 2020-2033 (USD Billion)
24. Germany Rice Husk Silica Market, By Silica Content, 2020-2033 (USD Billion)
25. France Rice Husk Silica Market, By Application, 2020-2033 (USD Billion)
26. France Rice Husk Silica Market, By Silica Content, 2020-2033 (USD Billion)
27. U.K. Rice Husk Silica Market, By Application, 2020-2033 (USD Billion)
28. U.K. Rice Husk Silica Market, By Silica Content, 2020-2033 (USD Billion)
29. Italy Rice Husk Silica Market, By Application, 2020-2033 (USD Billion)
30. Italy Rice Husk Silica Market, By Silica Content, 2020-2033 (USD Billion)
31. Spain Rice Husk Silica Market, By Application, 2020-2033 (USD Billion)
32. Spain Rice Husk Silica Market, By Silica Content, 2020-2033 (USD Billion)
33. Asia Pacific Rice Husk Silica Market, By Application, 2020-2033 (USD Billion)
34. Asia Pacific Rice Husk Silica Market, By Silica Content, 2020-2033 (USD Billion)
35. Japan Rice Husk Silica Market, By Application, 2020-2033 (USD Billion)
36. Japan Rice Husk Silica Market, By Silica Content, 2020-2033 (USD Billion)
37. China Rice Husk Silica Market, By Application, 2020-2033 (USD Billion)
38. China Rice Husk Silica Market, By Silica Content, 2020-2033 (USD Billion)
39. India Rice Husk Silica Market, By Application, 2020-2033 (USD Billion)
40. India Rice Husk Silica Market, By Silica Content, 2020-2033 (USD Billion)
41. South America Rice Husk Silica Market, By Application, 2020-2033 (USD Billion)
42. South America Rice Husk Silica Market, By Silica Content, 2020-2033 (USD Billion)
43. Brazil Rice Husk Silica Market, By Application, 2020-2033 (USD Billion)
44. Brazil Rice Husk Silica Market, By Silica Content, 2020-2033 (USD Billion)
45. Middle East and Africa Rice Husk Silica Market, By Application, 2020-2033 (USD Billion)
46. Middle East and Africa Rice Husk Silica Market, By Silica Content, 2020-2033 (USD Billion)
47. UAE Rice Husk Silica Market, By Application, 2020-2033 (USD Billion)
48. UAE Rice Husk Silica Market, By Silica Content, 2020-2033 (USD Billion)
49. South Africa Rice Husk Silica Market, By Application, 2020-2033 (USD Billion)
50. South Africa Rice Husk Silica Market, By Silica Content, 2020-2033 (USD Billion)
List of Figures
1. Global Rice Husk Silica Market Segmentation
2. Global Rice Husk Silica Market: Research Methodology
3. Market Size Estimation Methodology: Bottom-Up Approach
4. Market Size Estimation Methodology: Top-Down Approach
5. Data Triangulation
6. Porter’s Five Forces Analysis
7. Value Chain Analysis
8. Global Rice Husk Silica Market Attractiveness Analysis by Application
9. Global Rice Husk Silica Market Attractiveness Analysis by Silica Content
10. Global Rice Husk Silica Market Attractiveness Analysis by Region
11. Global Rice Husk Silica Market: Dynamics
12. Global Rice Husk Silica Market Share by Application (2023 & 2033)
13. Global Rice Husk Silica Market Share by Silica Content (2023 & 2033)
14. Global Rice Husk Silica Market Share by Regions (2023 & 2033)
15. Global Rice Husk Silica Market Share by Company (2023)
1. Introduction
1.1. Objectives of the Study
1.2. Market Definition
1.3. Research Scope
1.4. Currency
1.5. Key Target Audience
2. Research Methodology and Assumptions
3. Executive Summary
4. Premium Insights
4.1. Porter’s Five Forces Analysis
4.2. Value Chain Analysis
4.3. Top Investment Pockets
4.3.1. Market Attractiveness Analysis by Application
4.3.2. Market Attractiveness Analysis by Silica Content
4.3.3. Market Attractiveness Analysis by Region
4.4. Industry Trends
5. Market Dynamics
5.1. Market Evaluation
5.2. Drivers
5.2.1. Low manufacturing and material costs in the global market
5.2.2. Favourable government initiatives in the market
5.3. Restraints
5.3.1. High dependence of manufacturing on the production of rice paddy in the market
5.4. Opportunities
5.4.1. Rapidly growing demand for rice husks in the cement and construction industry
5.4.2. Rapidly growing technological advancements in the market
5.5. Challenges
5.5.1. Lack of Awareness of Rice Husk Silica Market
6. Global Rice Husk Silica Market Analysis and Forecast, By Application
6.1. Segment Overview
6.2. Building & Construction
6.3. Steel Industry
6.4. Silica
6.5. Ceramics & Refractory
6.6. Rubber
7. Global Rice Husk Silica Market Analysis and Forecast, By Silica Content
7.1. Segment Overview
7.2. 80-84%
7.3. 85-89%
7.4. 90-94%
7.5. Greater than 95%
8. Global Rice Husk Silica Market Analysis and Forecast, By Regional Analysis
8.1. Segment Overview
8.2. North America
8.2.1. U.S.
8.2.2. Canada
8.2.3. Mexico
8.3. Europe
8.3.1. Germany
8.3.2. France
8.3.3. U.K.
8.3.4. Italy
8.3.5. Spain
8.4. Asia-Pacific
8.4.1. Japan
8.4.2. China
8.4.3. India
8.5. South America
8.5.1. Brazil
8.6. Middle East and Africa
8.6.1. UAE
8.6.2. South Africa
9. Global Rice Husk Silica Market-Competitive Landscape
9.1. Overview
9.2. Market Share of Key Players in Global Rice Husk Silica Market
9.2.1. Global Company Market Share
9.2.2. North America Company Market Share
9.2.3. Europe Company Market Share
9.2.4. APAC Company Market Share
9.3. Competitive Situations and Trends
9.3.1. Product Launches and Developments
9.3.2. Partnerships, Collaborations, and Agreements
9.3.3. Mergers & Acquisitions
9.3.4. Expansions
10. Company Profiles
10.1. Wadham Energy
10.1.1. Business Overview
10.1.2. Company Snapshot
10.1.3. Company Market Share Analysis
10.1.4. Company Product Portfolio
10.1.5. Recent Developments
10.1.6. SWOT Analysis
10.2. Yihai Kerry
10.2.1. Business Overview
10.2.2. Company Snapshot
10.2.3. Company Market Share Analysis
10.2.4. Company Product Portfolio
10.2.5. Recent Developments
10.2.6. SWOT Analysis
10.3. Agrilectric Power
10.3.1. Business Overview
10.3.2. Company Snapshot
10.3.3. Company Market Share Analysis
10.3.4. Company Product Portfolio
10.3.5. Recent Developments
10.3.6. SWOT Analysis
10.4. Oryzasil
10.4.1. Business Overview
10.4.2. Company Snapshot
10.4.3. Company Market Share Analysis
10.4.4. Company Product Portfolio
10.4.5. Recent Developments
10.4.6. SWOT Analysis
10.5. Jiangxi Jinkang Advanced Material
10.5.1. Business Overview
10.5.2. Company Snapshot
10.5.3. Company Market Share Analysis
10.5.4. Company Product Portfolio
10.5.5. Recent Developments
10.5.6. SWOT Analysis
10.6. Chunhuaqiushi
10.6.1. Business Overview
10.6.2. Company Snapshot
10.6.3. Company Market Share Analysis
10.6.4. Company Product Portfolio
10.6.5. Recent Developments
10.6.6. SWOT Analysis
10.7. Anhui Evosil Nanomaterials Technology
10.7.1. Business Overview
10.7.2. Company Snapshot
10.7.3. Company Market Share Analysis
10.7.4. Company Product Portfolio
10.7.5. Recent Developments
10.7.6. SWOT Analysis
10.8. Green Silica Group
10.8.1. Business Overview
10.8.2. Company Snapshot
10.8.3. Company Market Share Analysis
10.8.4. Company Product Portfolio
10.8.5. Recent Developments
10.8.6. SWOT Analysis
10.9. BSB Nanotechnology
10.9.1. Business Overview
10.9.2. Company Snapshot
10.9.3. Company Market Share Analysis
10.9.4. Company Product Portfolio
10.9.5. Recent Developments
10.9.6. SWOT Analysis
10.10. Jiangsu Han Fang Technology
10.10.1. Business Overview
10.10.2. Company Snapshot
10.10.3. Company Market Share Analysis
10.10.4. Company Product Portfolio
10.10.5. Recent Developments
10.10.6. SWOT Analysis
This study forecasts revenue at global, regional, and country levels from 2020 to 2033. The Brainy Insights has segmented the global rice husk silica market based on below-mentioned segments:
Global Rice Husk Silica Market by Application:
Global Rice Husk Silica Market by Silica Content:
Global Rice Husk Silica Market by Region:
Research has its special purpose to undertake marketing efficiently. In this competitive scenario, businesses need information across all industry verticals; the information about customer wants, market demand, competition, industry trends, distribution channels etc. This information needs to be updated regularly because businesses operate in a dynamic environment. Our organization, The Brainy Insights incorporates scientific and systematic research procedures in order to get proper market insights and industry analysis for overall business success. The analysis consists of studying the market from a miniscule level wherein we implement statistical tools which helps us in examining the data with accuracy and precision.
Our research reports feature both; quantitative and qualitative aspects for any market. Qualitative information for any market research process are fundamental because they reveal the customer needs and wants, usage and consumption for any product/service related to a specific industry. This in turn aids the marketers/investors in knowing certain perceptions of the customers. Qualitative research can enlighten about the different product concepts and designs along with unique service offering that in turn, helps define marketing problems and generate opportunities. On the other hand, quantitative research engages with the data collection process through interviews, e-mail interactions, surveys and pilot studies. Quantitative aspects for the market research are useful to validate the hypotheses generated during qualitative research method, explore empirical patterns in the data with the help of statistical tools, and finally make the market estimations.
The Brainy Insights offers comprehensive research and analysis, based on a wide assortment of factual insights gained through interviews with CXOs and global experts and secondary data from reliable sources. Our analysts and industry specialist assume vital roles in building up statistical tools and analysis models, which are used to analyse the data and arrive at accurate insights with exceedingly informative research discoveries. The data provided by our organization have proven precious to a diverse range of companies, facilitating them to address issues such as determining which products/services are the most appealing, whether or not customers use the product in the manner anticipated, the purchasing intentions of the market and many others.
Our research methodology encompasses an idyllic combination of primary and secondary initiatives. Key phases involved in this process are listed below:

The phase involves the gathering and collecting of market data and its related information with the help of different sources & research procedures.

The data procurement stage involves in data gathering and collecting through various data sources.
This stage involves in extensive research. These data sources includes:
Purchased Database: Purchased databases play a crucial role in estimating the market sizes irrespective of the domain. Our purchased database includes:
Primary Research: The Brainy Insights interacts with leading companies and experts of the concerned domain to develop the analyst team’s market understanding and expertise. It improves and substantiates every single data presented in the market reports. Primary research mainly involves in telephonic interviews, E-mail interactions and face-to-face interviews with the raw material providers, manufacturers/producers, distributors, & independent consultants. The interviews that we conduct provides valuable data on market size and industry growth trends prevailing in the market. Our organization also conducts surveys with the various industry experts in order to gain overall insights of the industry/market. For instance, in healthcare industry we conduct surveys with the pharmacists, doctors, surgeons and nurses in order to gain insights and key information of a medical product/device/equipment which the customers are going to usage. Surveys are conducted in the form of questionnaire designed by our own analyst team. Surveys plays an important role in primary research because surveys helps us to identify the key target audiences of the market. Additionally, surveys helps to identify the key target audience engaged with the market. Our survey team conducts the survey by targeting the key audience, thus gaining insights from them. Based on the perspectives of the customers, this information is utilized to formulate market strategies. Moreover, market surveys helps us to understand the current competitive situation of the industry. To be precise, our survey process typically involve with the 360 analysis of the market. This analytical process begins by identifying the prospective customers for a product or service related to the market/industry to obtain data on how a product/service could fit into customers’ lives.

Secondary Research: The secondary data sources includes information published by the on-profit organizations such as World bank, WHO, company fillings, investor presentations, annual reports, national government documents, statistical databases, blogs, articles, white papers and others. From the annual report, we analyse a company’s revenue to understand the key segment and market share of that organization in a particular region. We analyse the company websites and adopt the product mapping technique which is important for deriving the segment revenue. In the product mapping method, we select and categorize the products offered by the companies catering to domain specific market, deduce the product revenue for each of the companies so as to get overall estimation of the market size. We also source data and analyses trends based on information received from supply side and demand side intermediaries in the value chain. The supply side denotes the data gathered from supplier, distributor, wholesaler and the demand side illustrates the data gathered from the end customers for respective market domain.

The supply side for a domain specific market is analysed by:
The demand side for the market is estimated through:
In-house Library: Apart from these third-party sources, we have our in-house library of qualitative and quantitative information. Our in-house database includes market data for various industry and domains. These data are updated on regular basis as per the changing market scenario. Our library includes, historic databases, internal audit reports and archives.
Sometimes there are instances where there is no metadata or raw data available for any domain specific market. For those cases, we use our expertise to forecast and estimate the market size in order to generate comprehensive data sets. Our analyst team adopt a robust research technique in order to produce the estimates:
Data Synthesis: This stage involves the analysis & mapping of all the information obtained from the previous step. It also involves in scrutinizing the data for any discrepancy observed while data gathering related to the market. The data is collected with consideration to the heterogeneity of sources. Robust scientific techniques are in place for synthesizing disparate data sets and provide the essential contextual information that can orient market strategies. The Brainy Insights has extensive experience in data synthesis where the data passes through various stages:


Market Deduction & Formulation: The final stage comprises of assigning data points at appropriate market spaces so as to deduce feasible conclusions. Analyst perspective & subject matter expert based holistic form of market sizing coupled with industry analysis also plays a crucial role in this stage.
This stage involves in finalization of the market size and numbers that we have collected from data integration step. With data interpolation, it is made sure that there is no gap in the market data. Successful trend analysis is done by our analysts using extrapolation techniques, which provide the best possible forecasts for the market.
Data Validation & Market Feedback: Validation is the most important step in the process. Validation & re-validation via an intricately designed process helps us finalize data-points to be used for final calculations.

The Brainy Insights interacts with leading companies and experts of the concerned domain to develop the analyst team’s market understanding and expertise. It improves and substantiates every single data presented in the market reports. The data validation interview and discussion panels are typically composed of the most experienced industry members. The participants include, however, are not limited to:
Moreover, we always validate our data and findings through primary respondents from all the major regions we are working on.


Free Customization
Fortune 500 Clients
Free Yearly Update On Purchase Of Multi/Corporate License
Companies Served Till Date