- +1-315-215-1633
- sales@thebrainyinsights.com

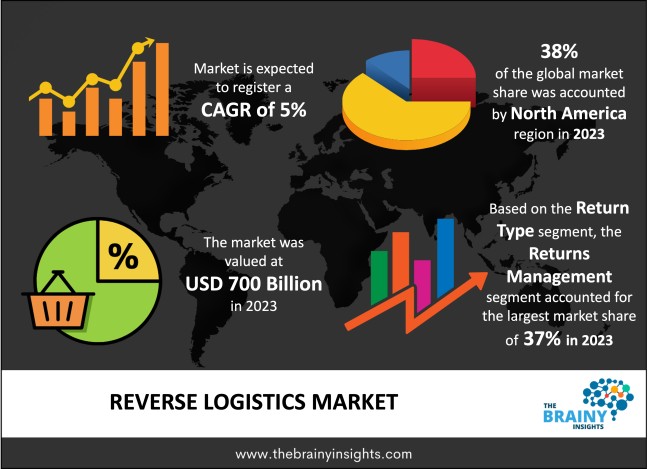
The global reverse logistics market was valued at USD 700 billion in 2023 and grew at a CAGR of 5% from 2024 to 2033. The market is expected to reach USD 1140.22 billion by 2033. The rapid rise of e-commerce will drive the growth of the global reverse logistics market.
Return logistics is basically the process of managing the returns of goods from customers to their supplier or origin. The way logistics refers to the delivery of goods to customers in a timely manner ensuring that the goods reach them in pristine condition without any damages, reverse logistics refers to the reversal of the same process wherein the goods are sent back from the customer. Reverse logistics emphasis on recovery and reducing waste to facilitate environmental sustainability. It involves multiple stages. The first stage is the customer seeking return and approval of the same by the supplier or delivery partner. The returned product is picked up by delivery agents and then it is assessed or inspected to check the contents. The inspection enables the categorization of the good based on its recyclability or refurbishment potential. After categorization the goods are either repaired, recycled, refurbished or disposed. Reverse logistics is vital to e-commerce as it enhances customer satisfaction by allowing them to return goods when it doesn’t meet their expectations. It also enhances consumer trust. It reduces waste as customers don’t accumulate things they don’t like or use. It enables suppliers to recover value from returned goods and contributes positively to the environment by fostering a conducive framework for circular economy. Reverse logistics is seen beyond retail across many sectors.
Get an overview of this study by requesting a free sample
The rising emphasis on environmental sustainability – the growing concerns about climate change and its severe consequences for the global economies has increases the need to adopt sustainable and eco-friendly practices. Promoting circular economy is one of the vita steps towards environmental sustainability as it optimizes resources and reduces waste which in turn reduces carbon footprints. Reverse logistics facilitates circular economy as it enables businesses to extract value from returned products by recycling and refurbishing them. recycling and refurbishing reduce waste which is beneficial for businesses and the environment. Reverse logistics have systems in place that ensure proper disposal of damaged goods or goods that cannot be recycled or refurbished. Reverse logistics streamlines regulatory compliance for businesses. it also takes care of their corporate social responsibility by facilitating positive and green contributions to the economy through a well-established process of reverse logistics. Therefore, the rising emphasis on environmental sustainability will contribute to the market’s growth.
The cost challenges of reverse logistics – Reverse logistics is a far more complex process than forward logistics as it is a more complex process. Forward logistics contain new goods in intact conditions that are delivered to customers. Reverse logistics contain goods in various different conditions. It can be not used at all, lightly used, or damaged. It can be damaged before reaching the customer or damaged by the customer. Therefore, it requires intricate systems in place to document the returns with meticulous inspections and sorting of returned goods. The time-lines differ in reverse logistics with varying different return periods and pick-up delivery schedules. The inspection and sorting are labour intensive processes which increase costs. recycling or refurbishing also incur costs. therefore, the costs and complexities of reverse logistics will hamper the market’s growth.
Technological advancements – The complexities of reverse logistics contribute to delays and increased costs. this inefficiency has led to technological advancements that aim to enhance the process to make it faster and more effective. For instance, the integration of IoT devices enables real time monitoring of goods which increases the efficiency of logistics. Similar RFID technology also improves real time monitoring and locating goods ensures they aren’t lost or stolen. It improves the retrieval of goods with reduces downtime. These systems digitize the logistics process which enables the collection and storage of important data about returned goods which facilitates analysis and optimization of resources. It also paves the way for insights and predictions based on the data, enabling companies to stay proactive in logistics. These systems streamline processes and reduce human errors. Therefore, technological advancements have accelerated reverse logistics making them more efficient and this will continue to contribute to the market’s growth during the forecast period.
The regions analysed for the market include North America, Europe, South America, Asia Pacific, the Middle East, and Africa. North America emerged as the most significant global reverse logistics market, with a 38% market revenue share in 2023.
The region has a vast e-commerce network with well-established logistics infrastructure that enables efficient forward and reverse logistics. The presence of a wide network of warehouses and transportation channels with seamless connectivity ensure a smooth transition or operation of logistics. The growing e-commerce network facilitated by the convenience of online shopping and advancements in the e-commerce market that have enabled easy and user-friendly procedures to improve customer satisfaction also contribute to the market’s growth. the growing emphasis on environmental sustainability has also contributed to the reverse logistics market as it promotes circular economy thereby reducing waste and carbon footprints. Companies and businesses in the region are open to adopting these systems to ensure compliance as well as to fulfil their corporate social responsibility agendas. The region is at the forefront of technological advancements that improve reverse logistics making it more efficient and contributing to the region’s dominance in the market.
North America Region Reverse Logistics Market Share in 2023 - 38%
www.thebrainyinsights.com
Check the geographical analysis of this market by requesting a free sample
The return type segment is divided into returns management, remanufacturing or refurbishment, packaging management, end of life, and others. The returns management segment dominated the market, with a market share of around 37% in 2023. Returns management systems is basically a system designed to handle the returns process of goods from consumers to the good’s point of origin in a streamlined manner. These systems handle everything from the first step of authorizing the return to the return payment of the item or not according to the product’s condition. These systems combine reverse logistics and customer relationship management systems. It works for every stakeholder from customer, supplier to delivery platform and delivery partner. It enables them to monitor the journey of the goods. It offers information on the pick-up timings, returned products inspection details, payment details and much more. It automates and streamlines process to make it more efficient. Returns managements system is central to reverse logistics and therefore dominated the market.
The service type segment is divided into transportation, warehousing, reselling, replacement management and others. The transportation segment dominated the market, with a market share of around 44% in 2023. Transportation refers to the movement of goods from one place to another and it is a vital component of reverse logistics. It is vital as efficient transportation of goods of diverse natures in varying conditions to proper facilities is the first step towards value recovery and sustainability. Efficient transportation is critical to the timelines of returns and faster transportation ensures reduced downtime and enhanced effectiveness and customer satisfaction. Well-coordinated transportation networks with a wide-geographical reach are necessary to ensure every customer receives the same treatment despite their pin-codes. Well-connected networks also ensure faster reverse logistics without long commutes. Optimizing costs for reverse logistics requires optimizing transportation costs by optimizing transportation routes. Therefore, the critical role of transportation in ensuring timely returns and cost optimizations can be attributed for its dominance in the market.
The end user segment is divided into retail and e-commerce, reusable packaging, automotive, pharmaceutical and others. The retail and e-commerce segment dominated the market, with a market share of around 45% in 2023. Retail and e-commerce refer to physical sale and purchase of goods and online sale and purchase of goods respectively. Customers are the forefront of these industries and their satisfaction is paramount. Therefore, the retail and e-commerce industry have robust inventory, customer support, after service and returns systems in place to enhance customer satisfaction. The rapid expansion of retail and e-commerce has increased returns and facilitated reverse logistics in the industry. Reverse logistics is vital in the industry to manage the high load or volumes of returned goods in a timely and streamlined manner to maintain customer satisfaction and ensure regulatory compliance concerning environmental sustainability. Reverse logistics reduces waste and optimizes resources. It also offers a centralized system to understand and analyse returns which offers insights for proactive inventory management.
| Attribute | Description |
|---|---|
| Market Size | Revenue (USD Billion) |
| Market size value in 2023 | USD 700 Billion |
| Market size value in 2033 | USD 1140.22 Billion |
| CAGR (2024 to 2033) | 5% |
| Historical data | 2020-2022 |
| Base Year | 2023 |
| Forecast | 2024-2033 |
| Region | The regions analysed for the market are Asia Pacific, Europe, South America, North America, and Middle East and Africa. Furthermore, the regions are further analysed at the country level. |
| Segments | Return Type, Service Type and End User |
As per The Brainy Insights, the size of the global reverse logistics market was valued at USD 700 billion in 2023 to USD 1140.22 billion by 2033.
Global reverse logistics market is growing at a CAGR of 5% during the forecast period 2024-2033.
The market's growth will be influenced by the rising emphasis on environmental sustainability.
The cost challenges of reverse logistics could hamper the market growth.
This study forecasts revenue at global, regional, and country levels from 2020 to 2033. The Brainy Insights has segmented the global reverse logistics market based on below mentioned segments:
Global Reverse Logistics Market by Return Type:
Global Reverse Logistics Market by Service Type:
Global Reverse Logistics Market by End User:
Global Reverse Logistics Market by Region:
Research has its special purpose to undertake marketing efficiently. In this competitive scenario, businesses need information across all industry verticals; the information about customer wants, market demand, competition, industry trends, distribution channels etc. This information needs to be updated regularly because businesses operate in a dynamic environment. Our organization, The Brainy Insights incorporates scientific and systematic research procedures in order to get proper market insights and industry analysis for overall business success. The analysis consists of studying the market from a miniscule level wherein we implement statistical tools which helps us in examining the data with accuracy and precision.
Our research reports feature both; quantitative and qualitative aspects for any market. Qualitative information for any market research process are fundamental because they reveal the customer needs and wants, usage and consumption for any product/service related to a specific industry. This in turn aids the marketers/investors in knowing certain perceptions of the customers. Qualitative research can enlighten about the different product concepts and designs along with unique service offering that in turn, helps define marketing problems and generate opportunities. On the other hand, quantitative research engages with the data collection process through interviews, e-mail interactions, surveys and pilot studies. Quantitative aspects for the market research are useful to validate the hypotheses generated during qualitative research method, explore empirical patterns in the data with the help of statistical tools, and finally make the market estimations.
The Brainy Insights offers comprehensive research and analysis, based on a wide assortment of factual insights gained through interviews with CXOs and global experts and secondary data from reliable sources. Our analysts and industry specialist assume vital roles in building up statistical tools and analysis models, which are used to analyse the data and arrive at accurate insights with exceedingly informative research discoveries. The data provided by our organization have proven precious to a diverse range of companies, facilitating them to address issues such as determining which products/services are the most appealing, whether or not customers use the product in the manner anticipated, the purchasing intentions of the market and many others.
Our research methodology encompasses an idyllic combination of primary and secondary initiatives. Key phases involved in this process are listed below:

The phase involves the gathering and collecting of market data and its related information with the help of different sources & research procedures.

The data procurement stage involves in data gathering and collecting through various data sources.
This stage involves in extensive research. These data sources includes:
Purchased Database: Purchased databases play a crucial role in estimating the market sizes irrespective of the domain. Our purchased database includes:
Primary Research: The Brainy Insights interacts with leading companies and experts of the concerned domain to develop the analyst team’s market understanding and expertise. It improves and substantiates every single data presented in the market reports. Primary research mainly involves in telephonic interviews, E-mail interactions and face-to-face interviews with the raw material providers, manufacturers/producers, distributors, & independent consultants. The interviews that we conduct provides valuable data on market size and industry growth trends prevailing in the market. Our organization also conducts surveys with the various industry experts in order to gain overall insights of the industry/market. For instance, in healthcare industry we conduct surveys with the pharmacists, doctors, surgeons and nurses in order to gain insights and key information of a medical product/device/equipment which the customers are going to usage. Surveys are conducted in the form of questionnaire designed by our own analyst team. Surveys plays an important role in primary research because surveys helps us to identify the key target audiences of the market. Additionally, surveys helps to identify the key target audience engaged with the market. Our survey team conducts the survey by targeting the key audience, thus gaining insights from them. Based on the perspectives of the customers, this information is utilized to formulate market strategies. Moreover, market surveys helps us to understand the current competitive situation of the industry. To be precise, our survey process typically involve with the 360 analysis of the market. This analytical process begins by identifying the prospective customers for a product or service related to the market/industry to obtain data on how a product/service could fit into customers’ lives.

Secondary Research: The secondary data sources includes information published by the on-profit organizations such as World bank, WHO, company fillings, investor presentations, annual reports, national government documents, statistical databases, blogs, articles, white papers and others. From the annual report, we analyse a company’s revenue to understand the key segment and market share of that organization in a particular region. We analyse the company websites and adopt the product mapping technique which is important for deriving the segment revenue. In the product mapping method, we select and categorize the products offered by the companies catering to domain specific market, deduce the product revenue for each of the companies so as to get overall estimation of the market size. We also source data and analyses trends based on information received from supply side and demand side intermediaries in the value chain. The supply side denotes the data gathered from supplier, distributor, wholesaler and the demand side illustrates the data gathered from the end customers for respective market domain.

The supply side for a domain specific market is analysed by:
The demand side for the market is estimated through:
In-house Library: Apart from these third-party sources, we have our in-house library of qualitative and quantitative information. Our in-house database includes market data for various industry and domains. These data are updated on regular basis as per the changing market scenario. Our library includes, historic databases, internal audit reports and archives.
Sometimes there are instances where there is no metadata or raw data available for any domain specific market. For those cases, we use our expertise to forecast and estimate the market size in order to generate comprehensive data sets. Our analyst team adopt a robust research technique in order to produce the estimates:
Data Synthesis: This stage involves the analysis & mapping of all the information obtained from the previous step. It also involves in scrutinizing the data for any discrepancy observed while data gathering related to the market. The data is collected with consideration to the heterogeneity of sources. Robust scientific techniques are in place for synthesizing disparate data sets and provide the essential contextual information that can orient market strategies. The Brainy Insights has extensive experience in data synthesis where the data passes through various stages:


Market Deduction & Formulation: The final stage comprises of assigning data points at appropriate market spaces so as to deduce feasible conclusions. Analyst perspective & subject matter expert based holistic form of market sizing coupled with industry analysis also plays a crucial role in this stage.
This stage involves in finalization of the market size and numbers that we have collected from data integration step. With data interpolation, it is made sure that there is no gap in the market data. Successful trend analysis is done by our analysts using extrapolation techniques, which provide the best possible forecasts for the market.
Data Validation & Market Feedback: Validation is the most important step in the process. Validation & re-validation via an intricately designed process helps us finalize data-points to be used for final calculations.

The Brainy Insights interacts with leading companies and experts of the concerned domain to develop the analyst team’s market understanding and expertise. It improves and substantiates every single data presented in the market reports. The data validation interview and discussion panels are typically composed of the most experienced industry members. The participants include, however, are not limited to:
Moreover, we always validate our data and findings through primary respondents from all the major regions we are working on.


Free Customization
Fortune 500 Clients
Free Yearly Update On Purchase Of Multi/Corporate License
Companies Served Till Date