- +1-315-215-1633
- sales@thebrainyinsights.com

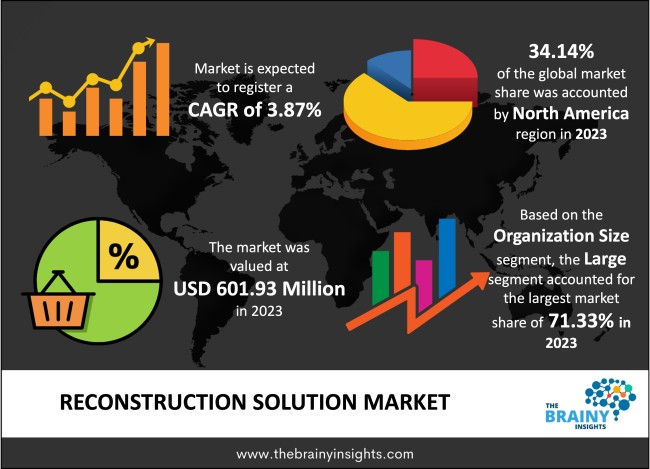
The global Reconstruction Solution market was valued at USD 601.93 Million in 2023 and growing at a CAGR of 3.87% from 2024 to 2033. The market is expected to reach USD 879.93 Million by 2033. Recent trends suggest that China, the US, and India will hold half of all the work in the construction and engineering sectors worldwide. This is due to the economic development of these countries, which hold more than a third of the global population and economic output. The US and Canada are the 2nd and 8th largest construction markets globally, based on one article from 2024, and they have an estimated value of USD 1,579 billion for the building sector in the US and USD 294 billion for the Canadian sector. Based on one of the studies, the investment value in the construction sector increased by 1% in the US. These factors are eventually driving the growth of the reconstruction solution market.
Based on one of the studies of 2024, the top 10 construction markets will hold around 70% of the work done in construction by 2037, and it will hold over USD 9.7 trillion in 2037. Also, the ASEAN tiger economies like Hong Kong, South Korea, Singapore, Taiwan, India, and Bangladesh are estimated to show significant growth in the forecasting period. In the near future, it is estimated that India's growth will surpass the US's, and by 2037, it will become a construction powerhouse of around USD 1 trillion globally. Moreover, the renovation wave in Europe is also impacting construction work as the aim is to double the renovation rate of residential and non-residential buildings to decrease greenhouse gas emissions by 60% in 2030. The focus on making buildings more efficient provides the possibility of decreasing global energy demand by 12%. Based on one of the studies, the building consumption of world energy is around 30%. The industry uses 38% of its share, and transport uses around 26% of global supplies. As there is a focus on saving energy, there is a possibility of decreasing the energy intensity by 38%. If this target is achieved, the global energy demand will decrease by 12%. Also, it has been observed that retrofitting older buildings helps save energy. Besides saving energy, it also helps decrease staff sickness by 20%, improves employee productivity, and creates around 3.2 million jobs yearly. Also, retrofitted buildings are helping to increase their asset value by 15%. Retrofitting is considered the best solution for improving the environment in the cities. Also, based on many studies, around two-thirds of the existing buildings will be standing by 2050. As buildings account for 70% of the city's carbon emissions, there is a good opportunity for retrofitting the existing real estate. These factors create a demand for software solutions like BIM, etc. For instance, there is a plant that retrofits the present World Trade Center (WTC) in Brussels. It will help make it the most energy-efficient building in the capital of Belgium. In its construction, approximately 95% of all the existing equipment and materials will be recycled and reused, and 65% of the present building will be maintained, restricting the requirement for new construction materials. Also, around 30,000 tonnes of the concrete will be reused from the demolition site, and another 1,000 tonnes of the materials and products like the carpets, wood panelling and insulation will be used again on site or in other locations. It also uses software that helps with reconstruction. Hence, all these factors drive the Reconstruction Solution market.
Get an overview of this study by requesting a free sample
Growing demand for green buildings renovation and retrofits – Based on one of the studies of 2021, green buildings have become the key priority, and hence, the green building activity is growing. The survey suggests that in 2021, 28% agreed with implementing green strategies in over 60% of their projects. In 2024, this will increase to 42% of respondents who will implement green strategies over 60% of the project. Another stat states that the new green building decreases operating costs by 10.5% in the first year, and the reduction will be 16.9% in the next five years. The return will be even higher for the green renovations and retrofits. The renovation and retrofits are broadly happening due to environmental regulations. All these factors are eventually driving the Reconstruction Solution market.
High Cost– The high cost of software solutions like BIM etc. used in the construction sector hinders the market. This high initial cost consists of expenditures regarding software acquisition, hardware upgrades, and personnel training, all of which help effectively work the software. All these factors are acting as restraints for the market to grow.
Growing focus on renovation – Many factors drive the global renovation drive. The first of them is an economic factor. There is a shortage of housing. For instance, between 2012 and 2022, the housing gap grew to 2.3 million homes. Many people are looking for homes, leading to an upsurge in prices. Hence, most of the present homeowners prefer renovating their homes instead of finding new constrictions that meet specific requirements. Another factor which is driving the renovation is inflation. Renovation of a house is cheaper than building a new one. The renovation of a home costs USD 100 per square foot on average, but building a new house costs around USD 150 per square foot. It is creating a demand for reconstruction software solutions. All these factors would, in turn, drive the Reconstruction Solution market in the forecasting period.
The regions analyzed for the market include North America, Europe, South America, Asia Pacific, the Middle East, and Africa. North America emerged as the largest market for the global Reconstruction Solution market, with a 34.14% share of the market revenue in 2023. This market share is attributed to the surge in technology adoption in the region due to appropriate infrastructure. Also, the present infrastructure requires innovation in several cities. Based on one article, 90% of the buildings in New York City will be standing in 2050. These builds hold for 70% of the carbon emissions of the city. Historic windows, poor insulation and ageing plumbing are making the building inefficient for modern citizens. Hence, renovation of the older building is required. All these factors are driving the reconstruction solution market in the region.
North America Region Reconstruction Solution Market Share in 2023 - 34.14%
www.thebrainyinsights.com
Check the geographical analysis of this market by requesting a free sample
The organization size segment is divided into large and SMES. The large segment dominated the market, with a market share of around 71.33% in 2023. This significant market share is attributed to the presence of a broad legacy system in the large organizations that are being updated. These advanced software solutions offer a better, more secure, and more flexible solution.
The deployment type segment is divided into cloud and on-premise. Cloud segment dominated the market, with a market share of around 72.45% in 2023. This market share is attributed to the scalability offered by cloud platforms. These platforms help adapt computing resources based on requirements without the need for large capital investments.
The type segment is divided into solution and services. Solution segment dominated the market, with a market share of around 64.44% in 2023. This market share is attributed to the growing use of solution software. This software enhances efficiency and productivity, which leads to a better result with fewer resources.
| Attribute | Description |
|---|---|
| Market Size | Revenue (USD Million) |
| Market size value in 2023 | USD 601.93 Million |
| Market size value in 2033 | USD 879.93 Million |
| CAGR (2024 to 2033) | 3.87% |
| Historical data | 2020-2022 |
| Base Year | 2023 |
| Forecast | 2024-2033 |
| Region | The regions analyzed for the market are Asia Pacific, Europe, South America, North America, and Middle East & Africa. Furthermore, the regions are further analyzed at the country level. |
| Segments | Organization Size, Deployment Type and Type |
North America region emerged as the largest market for the Reconstruction Solution.
The market's growth will be influenced by growing demand for green buildings renovation and retrofits.
High cost hamper the market growth.
Growing focus on renovation will provide huge opportunities to the market.
Key players are Autodesk Inc., NavVis, Reconstruct Me, Bentley Systems Incorporated, Skyline Software Systems Inc., 3DHISTECH Ltd., ELCOVISION 10, Pix4D SA and BioVis3D among others.
1. Introduction
1.1. Objectives of the Study
1.2. Market Definition
1.3. Research Scope
1.4. Currency
1.5. Key Target Audience
2. Research Methodology and Assumptions
3. Executive Summary
4. Premium Insights
4.1. Porter’s Five Forces Analysis
4.2. Value Chain Analysis
4.3. Top Investment Pockets
4.3.1. Market Attractiveness Analysis By Organization Size
4.3.2. Market Attractiveness Analysis By Deployment Type
4.3.3. Market Attractiveness Analysis By Type
4.3.4. Market Attractiveness Analysis By Region
4.4. Industry Trends
5. Market Dynamics
5.1. Market Evaluation
5.2. Drivers
5.2.1. Growing demand for green buildings renovation and retrofits
5.3. Restraints
5.3.1. High Cost
5.4. Opportunities
5.4.1. Growing focus on renovation
5.5. Challenges
5.5.1. Economic slowdown
6. Global Reconstruction Solution Market Analysis and Forecast, By Organization Size
6.1. Segment Overview
6.2. Large
6.3. SMEs
7. Global Reconstruction Solution Market Analysis and Forecast, By Deployment Type
7.1. Segment Overview
7.2. Cloud
7.3. On-Premise
8. Global Reconstruction Solution Market Analysis and Forecast, By Type
8.1. Segment Overview
8.2. Solution
8.3. Services
9. Global Reconstruction Solution Market Analysis and Forecast, By Regional Analysis
9.1. Segment Overview
9.2. North America
9.2.1. U.S.
9.2.2. Canada
9.2.3. Mexico
9.3. Europe
9.3.1. Germany
9.3.2. France
9.3.3. U.K.
9.3.4. Italy
9.3.5. Spain
9.4. Asia-Pacific
9.4.1. Japan
9.4.2. China
9.4.3. India
9.5. South America
9.5.1. Brazil
9.6. Middle East and Africa
9.6.1. UAE
9.6.2. South Africa
10. Global Reconstruction Solution Market-Competitive Landscape
10.1. Overview
10.2. Market Share of Key Players in Global Reconstruction Solution Market
10.2.1. Global Company Market Share
10.2.2. North America Company Market Share
10.2.3. Europe Company Market Share
10.2.4. APAC Company Market Share
10.3. Competitive Situations and Trends
10.3.1. Organization Size Launches and Developments
10.3.2. Partnerships, Collaborations, and Agreements
10.3.3. Mergers & Acquisitions
10.3.4. Expansions
11. Company Profiles
11.1. Autodesk Inc.
11.1.1. Business Overview
11.1.2. Company Snapshot
11.1.3. Company Market Share Analysis
11.1.4. Company Organization Size Portfolio
11.1.5. Recent Developments
11.1.6. SWOT Analysis
11.2. NavVis
11.2.1. Business Overview
11.2.2. Company Snapshot
11.2.3. Company Market Share Analysis
11.2.4. Company Organization Size Portfolio
11.2.5. Recent Developments
11.2.6. SWOT Analysis
11.3. Reconstruct Me
11.3.1. Business Overview
11.3.2. Company Snapshot
11.3.3. Company Market Share Analysis
11.3.4. Company Organization Size Portfolio
11.3.5. Recent Developments
11.3.6. SWOT Analysis
11.4. Bentley Systems Incorporated
11.4.1. Business Overview
11.4.2. Company Snapshot
11.4.3. Company Market Share Analysis
11.4.4. Company Organization Size Portfolio
11.4.5. Recent Developments
11.4.6. SWOT Analysis
11.5. Skyline Software Systems Inc.
11.5.1. Business Overview
11.5.2. Company Snapshot
11.5.3. Company Market Share Analysis
11.5.4. Company Organization Size Portfolio
11.5.5. Recent Developments
11.5.6. SWOT Analysis
11.6. 3DHISTECH Ltd.
11.6.1. Business Overview
11.6.2. Company Snapshot
11.6.3. Company Market Share Analysis
11.6.4. Company Organization Size Portfolio
11.6.5. Recent Developments
11.6.6. SWOT Analysis
11.7. ELCOVISION 10
11.7.1. Business Overview
11.7.2. Company Snapshot
11.7.3. Company Market Share Analysis
11.7.4. Company Organization Size Portfolio
11.7.5. Recent Developments
11.7.6. SWOT Analysis
11.8. Pix4D SA
11.8.1. Business Overview
11.8.2. Company Snapshot
11.8.3. Company Market Share Analysis
11.8.4. Company Organization Size Portfolio
11.8.5. Recent Developments
11.8.6. SWOT Analysis
11.9. BioVis3D
11.9.1. Business Overview
11.9.2. Company Snapshot
11.9.3. Company Market Share Analysis
11.9.4. Company Organization Size Portfolio
11.9.5. Recent Developments
11.9.6. SWOT Analysis
List of Table
1. Global Reconstruction Solution Market, By Organization Size, 2020-2033 (USD Million)
2. Global Large, Reconstruction Solution Market, By Region, 2020-2033 (USD Million)
3. Global SMEs, Reconstruction Solution Market, By Region, 2020-2033 (USD Million)
4. Global Reconstruction Solution Market, By Deployment Type, 2020-2033 (USD Million)
5. Global Cloud, Reconstruction Solution Market, By Region, 2020-2033 (USD Million)
6. Global On-Premise, Reconstruction Solution Market, By Region, 2020-2033 (USD Million)
7. Global Reconstruction Solution Market, By Type, 2020-2033 (USD Million)
8. Global Solution, Reconstruction Solution Market, By Region, 2020-2033 (USD Million)
9. Global Services, Reconstruction Solution Market, By Region, 2020-2033 (USD Million)
10. North America Reconstruction Solution Market, By Organization Size, 2020-2033 (USD Million)
11. North America Reconstruction Solution Market, By Deployment Type, 2020-2033 (USD Million)
12. North America Reconstruction Solution Market, By Type, 2020-2033 (USD Million)
13. U.S. Reconstruction Solution Market, By Organization Size, 2020-2033 (USD Million)
14. U.S. Reconstruction Solution Market, By Deployment Type, 2020-2033 (USD Million)
15. U.S. Reconstruction Solution Market, By Type, 2020-2033 (USD Million)
16. Canada Reconstruction Solution Market, By Organization Size, 2020-2033 (USD Million)
17. Canada Reconstruction Solution Market, By Deployment Type, 2020-2033 (USD Million)
18. Canada Reconstruction Solution Market, By Type, 2020-2033 (USD Million)
19. Mexico Reconstruction Solution Market, By Organization Size, 2020-2033 (USD Million)
20. Mexico Reconstruction Solution Market, By Deployment Type, 2020-2033 (USD Million)
21. Mexico Reconstruction Solution Market, By Type, 2020-2033 (USD Million)
22. Europe Reconstruction Solution Market, By Organization Size, 2020-2033 (USD Million)
23. Europe Reconstruction Solution Market, By Deployment Type, 2020-2033 (USD Million)
24. Europe Reconstruction Solution Market, By Type, 2020-2033 (USD Million)
25. Germany Reconstruction Solution Market, By Organization Size, 2020-2033 (USD Million)
26. Germany Reconstruction Solution Market, By Deployment Type, 2020-2033 (USD Million)
27. Germany Reconstruction Solution Market, By Type, 2020-2033 (USD Million)
28. France Reconstruction Solution Market, By Organization Size, 2020-2033 (USD Million)
29. France Reconstruction Solution Market, By Deployment Type, 2020-2033 (USD Million)
30. France Reconstruction Solution Market, By Type, 2020-2033 (USD Million)
31. U.K. Reconstruction Solution Market, By Organization Size, 2020-2033 (USD Million)
32. U.K. Reconstruction Solution Market, By Deployment Type, 2020-2033 (USD Million)
33. U.K. Reconstruction Solution Market, By Type, 2020-2033 (USD Million)
34. Italy Reconstruction Solution Market, By Organization Size, 2020-2033 (USD Million)
35. Italy Reconstruction Solution Market, By Deployment Type, 2020-2033 (USD Million)
36. Italy Reconstruction Solution Market, By Type, 2020-2033 (USD Million)
37. Spain Reconstruction Solution Market, By Organization Size, 2020-2033 (USD Million)
38. Spain Reconstruction Solution Market, By Deployment Type, 2020-2033 (USD Million)
39. Spain Reconstruction Solution Market, By Type, 2020-2033 (USD Million)
40. Asia Pacific Reconstruction Solution Market, By Organization Size, 2020-2033 (USD Million)
41. Asia Pacific Reconstruction Solution Market, By Deployment Type, 2020-2033 (USD Million)
42. Asia Pacific Reconstruction Solution Market, By Type, 2020-2033 (USD Million)
43. Japan Reconstruction Solution Market, By Organization Size, 2020-2033 (USD Million)
44. Japan Reconstruction Solution Market, By Deployment Type, 2020-2033 (USD Million)
45. Japan Reconstruction Solution Market, By Type, 2020-2033 (USD Million)
46. China Reconstruction Solution Market, By Organization Size, 2020-2033 (USD Million)
47. China Reconstruction Solution Market, By Deployment Type, 2020-2033 (USD Million)
48. China Reconstruction Solution Market, By Type, 2020-2033 (USD Million)
49. India Reconstruction Solution Market, By Organization Size, 2020-2033 (USD Million)
50. India Reconstruction Solution Market, By Deployment Type, 2020-2033 (USD Million)
51. India Reconstruction Solution Market, By Type, 2020-2033 (USD Million)
52. South America Reconstruction Solution Market, By Organization Size, 2020-2033 (USD Million)
53. South America Reconstruction Solution Market, By Deployment Type, 2020-2033 (USD Million)
54. South America Reconstruction Solution Market, By Type, 2020-2033 (USD Million)
55. Brazil Reconstruction Solution Market, By Organization Size, 2020-2033 (USD Million)
56. Brazil Reconstruction Solution Market, By Type, 2020-2033 (USD Million)
57. Brazil Reconstruction Solution Market, By Deployment Type, 2020-2033 (USD Million)
58. Middle East and Africa Reconstruction Solution Market, By Organization Size, 2020-2033 (USD Million)
59. Middle East and Africa Reconstruction Solution Market, By Deployment Type, 2020-2033 (USD Million)
60. Middle East and Africa Reconstruction Solution Market, By Type, 2020-2033 (USD Million)
61. UAE Reconstruction Solution Market, By Organization Size, 2020-2033 (USD Million)
62. UAE Reconstruction Solution Market, By Deployment Type, 2020-2033 (USD Million)
63. UAE Reconstruction Solution Market, By Type, 2020-2033 (USD Million)
64. South Africa Reconstruction Solution Market, By Organization Size, 2020-2033 (USD Million)
65. South Africa Reconstruction Solution Market, By Deployment Type, 2020-2033 (USD Million)
66. South Africa Reconstruction Solution Market, By Type, 2020-2033 (USD Million)
List of Figures
1. Global Reconstruction Solution Market Segmentation
2. Global Reconstruction Solution Market: Research Methodology
3. Market Size Estimation Methodology: Bottom-Up Approach
4. Market Size Estimation Methodology: Top-Down Approach
5. Data Triangulation
6. Porter’s Five Forces Analysis
7. Value Chain Analysis
8. Global Reconstruction Solution Market Attractiveness Analysis By Organization Size
9. Global Reconstruction Solution Market Attractiveness Analysis By Deployment Type
10. Global Reconstruction Solution Market Attractiveness Analysis By Type
11. Global Reconstruction Solution Market Attractiveness Analysis By Region
12. Global Reconstruction Solution Market: Dynamics
13. Global Reconstruction Solution Market Share By Organization Size (2023 & 2033)
14. Global Reconstruction Solution Market Share By Deployment Type (2023 & 2033)
15. Global Reconstruction Solution Market Share By Type (2023 & 2033)
16. Global Reconstruction Solution Market Share By Regions (2023 & 2033)
17. Global Reconstruction Solution Market Share By Company (2023)
This study forecasts revenue at global, regional, and country levels from 2020 to 2033. The Brainy Insights has segmented the global Reconstruction Solution market based on below mentioned segments:
Global Reconstruction Solution Market by Organization Size:
Global Reconstruction Solution Market by Deployment Type:
Global Reconstruction Solution Market by Type:
Global Reconstruction Solution by Region:
Research has its special purpose to undertake marketing efficiently. In this competitive scenario, businesses need information across all industry verticals; the information about customer wants, market demand, competition, industry trends, distribution channels etc. This information needs to be updated regularly because businesses operate in a dynamic environment. Our organization, The Brainy Insights incorporates scientific and systematic research procedures in order to get proper market insights and industry analysis for overall business success. The analysis consists of studying the market from a miniscule level wherein we implement statistical tools which helps us in examining the data with accuracy and precision.
Our research reports feature both; quantitative and qualitative aspects for any market. Qualitative information for any market research process are fundamental because they reveal the customer needs and wants, usage and consumption for any product/service related to a specific industry. This in turn aids the marketers/investors in knowing certain perceptions of the customers. Qualitative research can enlighten about the different product concepts and designs along with unique service offering that in turn, helps define marketing problems and generate opportunities. On the other hand, quantitative research engages with the data collection process through interviews, e-mail interactions, surveys and pilot studies. Quantitative aspects for the market research are useful to validate the hypotheses generated during qualitative research method, explore empirical patterns in the data with the help of statistical tools, and finally make the market estimations.
The Brainy Insights offers comprehensive research and analysis, based on a wide assortment of factual insights gained through interviews with CXOs and global experts and secondary data from reliable sources. Our analysts and industry specialist assume vital roles in building up statistical tools and analysis models, which are used to analyse the data and arrive at accurate insights with exceedingly informative research discoveries. The data provided by our organization have proven precious to a diverse range of companies, facilitating them to address issues such as determining which products/services are the most appealing, whether or not customers use the product in the manner anticipated, the purchasing intentions of the market and many others.
Our research methodology encompasses an idyllic combination of primary and secondary initiatives. Key phases involved in this process are listed below:

The phase involves the gathering and collecting of market data and its related information with the help of different sources & research procedures.

The data procurement stage involves in data gathering and collecting through various data sources.
This stage involves in extensive research. These data sources includes:
Purchased Database: Purchased databases play a crucial role in estimating the market sizes irrespective of the domain. Our purchased database includes:
Primary Research: The Brainy Insights interacts with leading companies and experts of the concerned domain to develop the analyst team’s market understanding and expertise. It improves and substantiates every single data presented in the market reports. Primary research mainly involves in telephonic interviews, E-mail interactions and face-to-face interviews with the raw material providers, manufacturers/producers, distributors, & independent consultants. The interviews that we conduct provides valuable data on market size and industry growth trends prevailing in the market. Our organization also conducts surveys with the various industry experts in order to gain overall insights of the industry/market. For instance, in healthcare industry we conduct surveys with the pharmacists, doctors, surgeons and nurses in order to gain insights and key information of a medical product/device/equipment which the customers are going to usage. Surveys are conducted in the form of questionnaire designed by our own analyst team. Surveys plays an important role in primary research because surveys helps us to identify the key target audiences of the market. Additionally, surveys helps to identify the key target audience engaged with the market. Our survey team conducts the survey by targeting the key audience, thus gaining insights from them. Based on the perspectives of the customers, this information is utilized to formulate market strategies. Moreover, market surveys helps us to understand the current competitive situation of the industry. To be precise, our survey process typically involve with the 360 analysis of the market. This analytical process begins by identifying the prospective customers for a product or service related to the market/industry to obtain data on how a product/service could fit into customers’ lives.

Secondary Research: The secondary data sources includes information published by the on-profit organizations such as World bank, WHO, company fillings, investor presentations, annual reports, national government documents, statistical databases, blogs, articles, white papers and others. From the annual report, we analyse a company’s revenue to understand the key segment and market share of that organization in a particular region. We analyse the company websites and adopt the product mapping technique which is important for deriving the segment revenue. In the product mapping method, we select and categorize the products offered by the companies catering to domain specific market, deduce the product revenue for each of the companies so as to get overall estimation of the market size. We also source data and analyses trends based on information received from supply side and demand side intermediaries in the value chain. The supply side denotes the data gathered from supplier, distributor, wholesaler and the demand side illustrates the data gathered from the end customers for respective market domain.

The supply side for a domain specific market is analysed by:
The demand side for the market is estimated through:
In-house Library: Apart from these third-party sources, we have our in-house library of qualitative and quantitative information. Our in-house database includes market data for various industry and domains. These data are updated on regular basis as per the changing market scenario. Our library includes, historic databases, internal audit reports and archives.
Sometimes there are instances where there is no metadata or raw data available for any domain specific market. For those cases, we use our expertise to forecast and estimate the market size in order to generate comprehensive data sets. Our analyst team adopt a robust research technique in order to produce the estimates:
Data Synthesis: This stage involves the analysis & mapping of all the information obtained from the previous step. It also involves in scrutinizing the data for any discrepancy observed while data gathering related to the market. The data is collected with consideration to the heterogeneity of sources. Robust scientific techniques are in place for synthesizing disparate data sets and provide the essential contextual information that can orient market strategies. The Brainy Insights has extensive experience in data synthesis where the data passes through various stages:


Market Deduction & Formulation: The final stage comprises of assigning data points at appropriate market spaces so as to deduce feasible conclusions. Analyst perspective & subject matter expert based holistic form of market sizing coupled with industry analysis also plays a crucial role in this stage.
This stage involves in finalization of the market size and numbers that we have collected from data integration step. With data interpolation, it is made sure that there is no gap in the market data. Successful trend analysis is done by our analysts using extrapolation techniques, which provide the best possible forecasts for the market.
Data Validation & Market Feedback: Validation is the most important step in the process. Validation & re-validation via an intricately designed process helps us finalize data-points to be used for final calculations.

The Brainy Insights interacts with leading companies and experts of the concerned domain to develop the analyst team’s market understanding and expertise. It improves and substantiates every single data presented in the market reports. The data validation interview and discussion panels are typically composed of the most experienced industry members. The participants include, however, are not limited to:
Moreover, we always validate our data and findings through primary respondents from all the major regions we are working on.


Free Customization
Fortune 500 Clients
Free Yearly Update On Purchase Of Multi/Corporate License
Companies Served Till Date