- +1-315-215-1633
- sales@thebrainyinsights.com

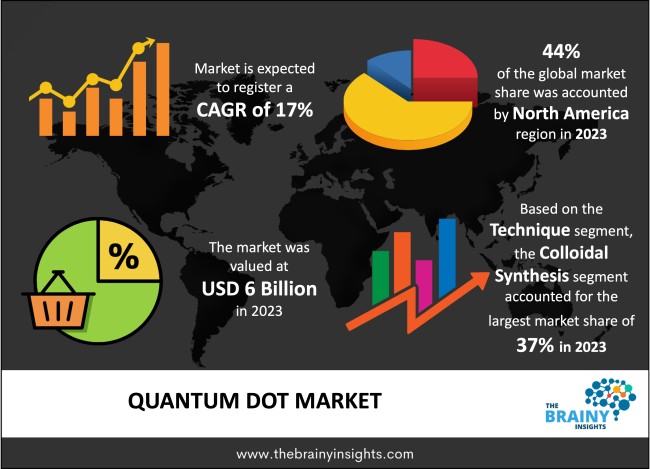
The global quantum dot market was valued at USD 6 billion in 2023 and grew at a CAGR of 17% from 2024 to 2033. The market is expected to reach USD 28.84 billion by 2033. The increasing demand for consumer electronics will drive the growth of the global quantum dot market.
Quantum dots are part of semiconductors. They are small in size. They measure in nanometres. However, their small size is what provides them with their excellent optical and electronic properties. the name quantum dot is given to them to reflect their quantum mechanical properties they exhibit given their small size. The excellent optical properties combined with their ability to reflect or emit light colours with extreme precision make them ideal for producing vivid images, such as those seen on LED TV screens. The light emissions can be adjusted to produce the precise colours as required. This vivid imaging ability is utilized in the healthcare sector in diagnostics and other imaging. They are also highly valuable in efficient conversion of light energy to electric energy through solar panels. They are highly valuable and fundamental in a range of applications with untapped potential which can be discovered with emerging technologies in the coming future.
Get an overview of this study by requesting a free sample
The increasing demand for consumer electronics – The rising population, urbanization, increasing disposable income, automation and digitization of economies, greater access to smart connected devices and data connectivity have contributed to an increasing demand for consumer electronics. With such extensive consumer demand which is ever-growing, the market has become highly saturated and competitive. The competition has driven advancements and product innovations aimed at increasing market share. Quantum dots have been fundamental in these innovations, enhancing the display and imaging quality of consumer electronics. It is vital in the production of HD, HDR, 4K and UHD images. Therefore, the increasing demand for consumer electronics will drive the global quantum dot market’s growth given the fundamental nature of quantum dots in improving displays and imaging of these products.
The costs of quantum dot – The materials used in quantum dot production are expensive. The synthesis of these materials through specialized equipment in controlled environment further add to the costs. these processes are complicated and complex which makes its commercial scale production quite challenging. Commercial scale production is vulnerable to quality degradation, which further increases cost of production. The continuous research and development (R&D) to production, synthesis and application of quantum dots also adds to costs. therefore, the costs of quantum dots will hamper the market’s growth.
Technological advancements – The growing need for quantum dots in the expanding digital world has made it a priority sector for many governments. It has led to increased funding for research and development along with growing collaboration, partnerships and programmes supporting the quantum dot market. these advancements are aimed at improving the synthesis and thereby the production of quantum dots in a cost-effective manner without compromising consistent quality. this contributes to increased production of quantum dots. The scalability contributes to reduced production costs, which benefits the market’s growth. more research contributes to expanding applications of quantum dots in new products and fields.
The regions analysed for the market include North America, Europe, South America, Asia Pacific, the Middle East, and Africa. North America emerged as the most significant global quantum dot market, with a 44% market revenue share in 2023.
The region has a well-established, mature and advanced research and development infrastructure with key market players, technology and electronics companies, academic and research institutions supporting constant advancements and innovations in quantum dots. The government of United States has significantly increased the spending on quantum dots and related fields to stay ahead in the game and gain a competitive advantage over China. The regional regulatory environment fosters collaborations and partnerships as well. the presence of key market players with manufacturing capabilities to support the market demand of quantum dots also contributes to the market’s growth.
North America Region Quantum Dot Market Share in 2023 - 44%
www.thebrainyinsights.com
Check the geographical analysis of this market by requesting a free sample
The technique segment is divided into colloidal synthesis, fabrication, bio-molecular self-assembly, viral assembly, electrochemical assembly, and bulk-manufacturing. The colloidal synthesis segment dominated the market, with a market share of around 37% in 2023. Colloidal synthesis is the production of quantum dots in a liquid medium. The production is achieved through a controlled chemical process in a controlled environment. The process is followed by purification to attain the most uniform and high-quality quantum dots. Colloidal synthesis offers precision and control over the dimensions of the quantum dots. These dimensions can be altered or modified according to needs and requirements of the products. it also offers consistent quality. it is scalable and versatile. It is a cost-effective method, making it the preferred choice of majority of the market players.
The product type segment is divided into QD medical devices, QD displays, QD solar cells, QD photodetectors/QD sensors, QD lasers, QD lighting (LED) solutions, batteries and energy-storage systems, QD transistors, and QD tags. The QD displays segment dominated the market, with a market share of around 35% in 2023. Displays are a fundamental component of majority of the electronic devices. Displays are the key component of user interference. It significant impacts the experience with the device. Quantum dots improve displays making them highly valuable in the market. it improves imaging facilitating the display of vivid and life-like images on screen, thereby enhancing customer experience and future sales.
The material segment is divided into cadmium-based quantum dots, cadmium-free quantum dots, silicon, graphene, and lead sulphide. The cadmium-based quantum dots segment dominated the market, with a market share of around 42% in 2023. Cadmium exhibits exceptional optical properties making it the dominant material for quantum dot production. It is also highly tenable enabling better control over colour composition and image quality. enhanced optical properties make it ideal for production of quantum dots that are used in electronics, medical devices and equipment that requires precise imaging. It is reliable, stable and offer better visuals. Furthermore, it is well tested and known technology.
The application segment is divided into consumer, commercial, telecommunications, healthcare, defence, and others. The healthcare segment dominated the market, with a market share of around 36% in 2023. Quantum dots are used to enhance the imaging and display in diagnostics processes in healthcare. Diagnostics processes are a fundamental component of healthcare sector being the first step towards identifying the ailment and defining further treatment course. It needs to accurate and reliable for optimum patient outcomes. quantum dots enable this precision and accuracy in imaging. They are also used in drug delivery and the development of personalized medicine.
| Attribute | Description |
|---|---|
| Market Size | Revenue (USD Billion) |
| Market size value in 2023 | USD 6 Billion |
| Market size value in 2033 | USD 28.84 Billion |
| CAGR (2024 to 2033) | 17% |
| Historical data | 2020-2022 |
| Base Year | 2023 |
| Forecast | 2024-2033 |
| Region | The regions analysed for the market are Asia Pacific, Europe, South America, North America, and Middle East and Africa. Furthermore, the regions are further analysed at the country level. |
| Segments | Technique, Product Type, Material and Application |
As per The Brainy Insights, the size of the global quantum dot market was valued at USD 6 billion in 2023 to USD 28.84 billion by 2033.
Global quantum dot market is growing at a CAGR of 17% during the forecast period 2024-2033.
The market's growth will be influenced by the increasing demand for consumer electronics.
The costs of quantum dot could hamper the market growth.
This study forecasts revenue at global, regional, and country levels from 2020 to 2033. The Brainy Insights has segmented the global quantum dot market based on below mentioned segments:
Global Quantum Dot Market by Technique:
Global Quantum Dot Market by Product Type:
Global Quantum Dot Market by Material:
Global Quantum Dot Market by Application:
Global Quantum Dot Market by Region:
Research has its special purpose to undertake marketing efficiently. In this competitive scenario, businesses need information across all industry verticals; the information about customer wants, market demand, competition, industry trends, distribution channels etc. This information needs to be updated regularly because businesses operate in a dynamic environment. Our organization, The Brainy Insights incorporates scientific and systematic research procedures in order to get proper market insights and industry analysis for overall business success. The analysis consists of studying the market from a miniscule level wherein we implement statistical tools which helps us in examining the data with accuracy and precision.
Our research reports feature both; quantitative and qualitative aspects for any market. Qualitative information for any market research process are fundamental because they reveal the customer needs and wants, usage and consumption for any product/service related to a specific industry. This in turn aids the marketers/investors in knowing certain perceptions of the customers. Qualitative research can enlighten about the different product concepts and designs along with unique service offering that in turn, helps define marketing problems and generate opportunities. On the other hand, quantitative research engages with the data collection process through interviews, e-mail interactions, surveys and pilot studies. Quantitative aspects for the market research are useful to validate the hypotheses generated during qualitative research method, explore empirical patterns in the data with the help of statistical tools, and finally make the market estimations.
The Brainy Insights offers comprehensive research and analysis, based on a wide assortment of factual insights gained through interviews with CXOs and global experts and secondary data from reliable sources. Our analysts and industry specialist assume vital roles in building up statistical tools and analysis models, which are used to analyse the data and arrive at accurate insights with exceedingly informative research discoveries. The data provided by our organization have proven precious to a diverse range of companies, facilitating them to address issues such as determining which products/services are the most appealing, whether or not customers use the product in the manner anticipated, the purchasing intentions of the market and many others.
Our research methodology encompasses an idyllic combination of primary and secondary initiatives. Key phases involved in this process are listed below:

The phase involves the gathering and collecting of market data and its related information with the help of different sources & research procedures.

The data procurement stage involves in data gathering and collecting through various data sources.
This stage involves in extensive research. These data sources includes:
Purchased Database: Purchased databases play a crucial role in estimating the market sizes irrespective of the domain. Our purchased database includes:
Primary Research: The Brainy Insights interacts with leading companies and experts of the concerned domain to develop the analyst team’s market understanding and expertise. It improves and substantiates every single data presented in the market reports. Primary research mainly involves in telephonic interviews, E-mail interactions and face-to-face interviews with the raw material providers, manufacturers/producers, distributors, & independent consultants. The interviews that we conduct provides valuable data on market size and industry growth trends prevailing in the market. Our organization also conducts surveys with the various industry experts in order to gain overall insights of the industry/market. For instance, in healthcare industry we conduct surveys with the pharmacists, doctors, surgeons and nurses in order to gain insights and key information of a medical product/device/equipment which the customers are going to usage. Surveys are conducted in the form of questionnaire designed by our own analyst team. Surveys plays an important role in primary research because surveys helps us to identify the key target audiences of the market. Additionally, surveys helps to identify the key target audience engaged with the market. Our survey team conducts the survey by targeting the key audience, thus gaining insights from them. Based on the perspectives of the customers, this information is utilized to formulate market strategies. Moreover, market surveys helps us to understand the current competitive situation of the industry. To be precise, our survey process typically involve with the 360 analysis of the market. This analytical process begins by identifying the prospective customers for a product or service related to the market/industry to obtain data on how a product/service could fit into customers’ lives.

Secondary Research: The secondary data sources includes information published by the on-profit organizations such as World bank, WHO, company fillings, investor presentations, annual reports, national government documents, statistical databases, blogs, articles, white papers and others. From the annual report, we analyse a company’s revenue to understand the key segment and market share of that organization in a particular region. We analyse the company websites and adopt the product mapping technique which is important for deriving the segment revenue. In the product mapping method, we select and categorize the products offered by the companies catering to domain specific market, deduce the product revenue for each of the companies so as to get overall estimation of the market size. We also source data and analyses trends based on information received from supply side and demand side intermediaries in the value chain. The supply side denotes the data gathered from supplier, distributor, wholesaler and the demand side illustrates the data gathered from the end customers for respective market domain.

The supply side for a domain specific market is analysed by:
The demand side for the market is estimated through:
In-house Library: Apart from these third-party sources, we have our in-house library of qualitative and quantitative information. Our in-house database includes market data for various industry and domains. These data are updated on regular basis as per the changing market scenario. Our library includes, historic databases, internal audit reports and archives.
Sometimes there are instances where there is no metadata or raw data available for any domain specific market. For those cases, we use our expertise to forecast and estimate the market size in order to generate comprehensive data sets. Our analyst team adopt a robust research technique in order to produce the estimates:
Data Synthesis: This stage involves the analysis & mapping of all the information obtained from the previous step. It also involves in scrutinizing the data for any discrepancy observed while data gathering related to the market. The data is collected with consideration to the heterogeneity of sources. Robust scientific techniques are in place for synthesizing disparate data sets and provide the essential contextual information that can orient market strategies. The Brainy Insights has extensive experience in data synthesis where the data passes through various stages:


Market Deduction & Formulation: The final stage comprises of assigning data points at appropriate market spaces so as to deduce feasible conclusions. Analyst perspective & subject matter expert based holistic form of market sizing coupled with industry analysis also plays a crucial role in this stage.
This stage involves in finalization of the market size and numbers that we have collected from data integration step. With data interpolation, it is made sure that there is no gap in the market data. Successful trend analysis is done by our analysts using extrapolation techniques, which provide the best possible forecasts for the market.
Data Validation & Market Feedback: Validation is the most important step in the process. Validation & re-validation via an intricately designed process helps us finalize data-points to be used for final calculations.

The Brainy Insights interacts with leading companies and experts of the concerned domain to develop the analyst team’s market understanding and expertise. It improves and substantiates every single data presented in the market reports. The data validation interview and discussion panels are typically composed of the most experienced industry members. The participants include, however, are not limited to:
Moreover, we always validate our data and findings through primary respondents from all the major regions we are working on.


Free Customization
Fortune 500 Clients
Free Yearly Update On Purchase Of Multi/Corporate License
Companies Served Till Date