- +1-315-215-1633
- sales@thebrainyinsights.com

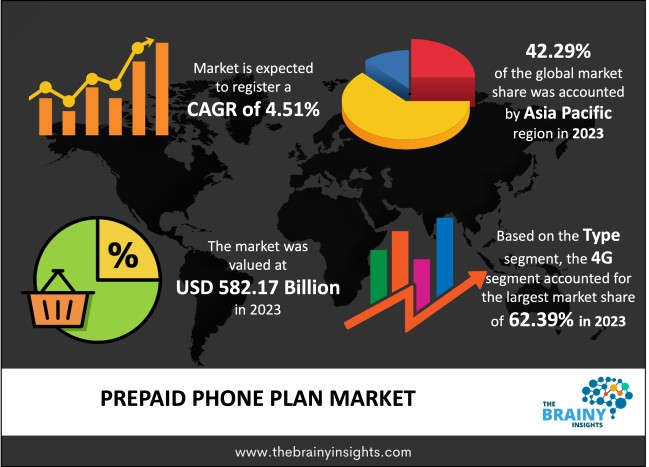
The global Prepaid Phone Plan market generated USD 582.17 Billion revenue in 2023 and is projected to grow at a CAGR of 4.51% from 2024 to 2033. The market is expected to reach USD 904.96 Billion by 2033. Sometimes, customers require affordable communication services where prepaid plan solutions fill the gap. Prepaid plans have flexible tariffs, allowing users to set expenses for using services and not face bills for additional services they did not use. Furthermore, prepaid tariffs are especially suitable for occasional users, people with low and unstable incomes, and those planning their expenditures. In addition, due to the convenience, brand image, and customer care offered, consumer interest plays a greater role in the prepaid phone plan market. Such flexibility will help companies capture consumers' attention and boost the chances of finding favour in these ever-crowded markets.
A prepaid phone plan is an aspect of mobile phone use where people use their mobile phone services and pay before they can continue to use any more services offered by the phone. In the prepaid model, the customers are offered a package in which they pay a certain amount for a particular period to use talk time, messages, and even data if allowed. Once the balance has been finished, the user needs to renew plans or add more credit to their account, also called “top-up reloading.” These plans are convenient and provide users with choices and cost management since they can check their usage in detail. Often, the customer does not have to sign yearly contracts or go through credit checks when subscribing to a prepaid plan. This aspect is the perfect solution for someone who does not want to be locked into a yearly contract or has a non-existent credit rating in the United States. If this is the case, prepaid phone services are flexible and usually available in packages or parts depending on the users’ needs. There are plans where you can have an open line for calling and texting and a given data option; there are also plans with additional minute and texting fees. Also, it has been found that many prepaid providers charge extra for international calls and roam facilities. In general, all kinds of prepaid phone plans are useful as they offer a suitable opportunity for those customers who need mobile phone service but do not want to sign a contract or pay for a service while using it rarely and spending too much money on it.
Get an overview of this study by requesting a free sample
Data Usage Trends — Consumer demand for data is growing, and many prepaid providers are changing their offers accordingly. Most buyers use mobile internet for communication, entertainment, and work, which is why many "pre-sponsored" tariff plans practically offer access to the internet for free, often providing many GBs of free data included in the price.
Flexibility — Prepaid plans are advantageous when it comes to commitment since they are mainly used when a certain company or an individual is sure that the possible usage of the services will not exceed a given amount of money. The customer is not bound to long-term contracts, allowing him to switch providers or plans easily. The mentioned flexibility is a significant advantage for students, travellers, and people eager to sign for a shorter term.
No Credit Checks — While most postpaid plans often require credit checks, the same cannot be said for prepaid plans; therefore, no credit history check is usually conducted. Because of this, prepaid plans are openly suitable for all consumers with inferior or 'Zero' credit scores, such as students, young employees, or many immigrants.
Limited Network Coverage — While premier mobile phone companies may offer comprehensive service, several prepaid companies may only work through a constrained network or may secure specific access to bigger carriers. This network restriction can act as a turnoff for potential customers mainly because network outlets may be few and far between within the network's coverage, especially in rural areas or places that are regarded as the outskirts.
Service Differentiation — Prepaid service plans are considered inferior quality compared with the usual postpaid service plans. These concepts can distract consumers from focusing on reliability and service quality, especially in key areas of network, helpdesk, and supported devices.
Market Expansion — Once again, this is beneficial because there is always a lot more untapped demand for mobile communications in particular and in general in areas with low average levels of mobile phone ownership or in developing nations where prepaid is an excellent way to give people affordable means to communicate. Retail segments currently unsaturated could be viewed as a potential for prepaid providers to sell to these new groups and generate additional revenues.
Customization and Personalization — Auspicious to both the customer base and the providers, the ability to customize and adapt a prepaid plan to a customer's requirements can assist with creating a virtual monopoly over a certain region's telecommunication market. Additional service packages, which can include numbers of rolled-over unused data, the ability to make international calls, and family package offers, can all grab the attention of various customer segments and enrich the service concept of prepaid services.
Price Sensitivity — This means that consumers who use prepaid plans have accepted concepts of affordability; hence, they are highly sensitive to price. Providers are always faced with the pressure to provide attractive price offers that reflect market forces while ensuring that they achieve their financial bottom line and free cash to invest in expanding their networks and improving the quality of services offered to customers.
Customer Turnover — The other threat faced by prepaid providers is that the customer turnover rates amongst prepaid users are fairly high, as many would switch their providers to go for better and more attractive offers, cheaper tariffs, or dissatisfaction with the kind of services delivered. Customer experience, reliability of network, and tailor-made products and offers are the two fundamental pillars of retaining customers; thus, reducing churn is an essential strategy.
The regions analyzed for the market include North America, Europe, South America, Asia Pacific, the Middle East, and Africa. Asia Pacific emerged as the most prominent global Prepaid Phone Plan market, with a 42.29% market revenue share in 2023.
Asia Pacific has a sizeable population, with countries such as China, India and Indonesia having billions of people. The region’s increasing population is creating a huge prepaid phone market driven by the need for cheap and accessible communication services. The Asia Pacific is also experiencing rapid urbanization, with millions moving from rural areas into urban regions in search of better economic opportunities. Urbanization increases the demand for mobile connectivity since city dwellers use mobile phones for internet access, social networking, and communication. On the other hand, given their elasticity and low cost, prepaid phone plans are ideal for meeting the needs of these urban populations in the area. Additionally, robust economic growth and increasing disposable incomes across countries within Asia-Pacific have led to extensive penetration of mobile phones and increased expenditure on telecommunications services. However, postpaid plans are most popular among affluent customers, whereas prepaid ones dominate among price-sensitive buyers, including students, young adults and low-income homes. Furthermore, Asia Pacific has welcomed mobile technology through its “mobile first” culture”. Mobile/cell telephones serve as communication devices, wallets, entertainment centers, and productivity tools. This trend has further driven the growth of the market.
Asia Pacific Region Prepaid Phone Plan Market Share in 2023 - 42.29%
www.thebrainyinsights.com
Check the geographical analysis of this market by requesting a free sample
The type segment is divided into 4G, 5G and others. The 4G segment dominated the market, with a share of around 62.39% in 2023. Besides that, 4G networks enable much higher data transmission rates than the earlier ones, such as 3G. It allows users to have more continuous streaming, faster downloads, and better browsing mobile usability, where 4G is the best choice for prepaid customers, especially those who prioritize the internet and applications that require data packages. Moreover, the 4G network performs far better than before, providing a better performance index for prepaid customers. Higher data rates diminish the time to connect, pause, and wait on mobile services like social networking, video on demand, online games, and mobile applications. Besides, the latest trends of concentrating applications and services on data usage and the increasing use of smartphones and connected devices have stimulated the growth of mobile data. Prepaid customers are generally young people who depend on the internet for contact, entertainment, and business. This factor drives using 4G prepaid packages with massive data bundles and fast Internet access.
The application segment is classified into personal, commercial and others. The personal segment dominated the market, with a share of around 57.18% in 2023. Customer requirements usually differentiate prepaid cell phone plans because consumers feel mobile phone usage should be flexible. Social networking, chat/messaging, email, and other killer applications that make the need for personal communication and connectivity precipitate the purchase of prepaid subscription plans to access these services. Furthermore, personal applications with or without monetized content are best accessed from mobile devices, especially smartphones, as consumers use the device for communication, leisure and productivity. The availability of cheap mobile data packages among the lists of services in prepaid telephone subscriptions helps users access personal applications on the go, hence the uptake of prepaid services that people can use to search for more convenient and cheaper connectivity modes. Notable is that personal applications attract increased popularity as a result of the digital lifestyle of the modern consumer, which is characterized by fast and constant connection, access to social networks and various information content and services. This aspect is resembled by prepaid providers, who adopt various offers that meet needs based on individual usage needs in digital services, including data volumes, calling and texting services, and personal application services.
| Attribute | Description |
|---|---|
| Market Size | Revenue (USD Billion) |
| Market size value in 2023 | USD 582.17 Billion |
| Market size value in 2033 | USD 904.96 Billion |
| CAGR (2024 to 2033) | 4.51% |
| Historical data | 2020-2022 |
| Base Year | 2023 |
| Forecast | 2024-2033 |
| Region | The regions analyzed for the market are Asia Pacific, Europe, South America, North America, and Middle East & Africa. Furthermore, the regions are further analyzed at the country level. |
| Segments | Type and Application |
As per The Brainy Insights, the size of the prepaid phone plan market was valued at USD 582.17 billion in 2023 to USD 904.96 billion by 2033.
The global prepaid phone plan market is growing at a CAGR of 4.51% during the forecast period 2024-2033.
Asia Pacific became the largest market for prepaid phone plan.
Raising data usage trends and no credit checks drive the market's growth.
1. Introduction
1.1. Objectives of the Study
1.2. Market Definition
1.3. Research Scope
1.4. Currency
1.5. Key Target Audience
2. Research Methodology and Assumptions
3. Executive Summary
4. Premium Insights
4.1. Porter’s Five Forces Analysis
4.2. Value Chain Analysis
4.3. Top Investment Pockets
4.3.1. Market Attractiveness Analysis By Type
4.3.2. Market Attractiveness Analysis By Application
4.3.3. Market Attractiveness Analysis By Region
4.4. Industry Trends
5. Market Dynamics
5.1. Market Evaluation
5.2. Drivers
5.2.1. Raising Data Usage Trends
5.2.2. No Credit Checks
5.3. Restraints
5.3.1. Limited Network Coverage
5.4. Opportunities
5.4.1. Market Expansion
5.5. Challenges
5.5.1. Price Sensitivity
6. Global Prepaid Phone Plan Market Analysis and Forecast, By Type
6.1. Segment Overview
6.2. 4G
6.3. 5G
6.4. Others
7. Global Prepaid Phone Plan Market Analysis and Forecast, By Application
7.1. Segment Overview
7.2. Personal
7.3. Commercial
7.4. Others
8. Global Prepaid Phone Plan Market Analysis and Forecast, By Regional Analysis
8.1. Segment Overview
8.2. North America
8.2.1. U.S.
8.2.2. Canada
8.2.3. Mexico
8.3. Europe
8.3.1. Germany
8.3.2. France
8.3.3. U.K.
8.3.4. Italy
8.3.5. Spain
8.4. Asia-Pacific
8.4.1. Japan
8.4.2. China
8.4.3. India
8.5. South America
8.5.1. Brazil
8.6. Middle East and Africa
8.6.1. UAE
8.6.2. South Africa
9. Global Prepaid Phone Plan Market-Competitive Landscape
9.1. Overview
9.2. Market Share of Key Players in the Prepaid Phone Plan Market
9.2.1. Global Company Market Share
9.2.2. North America Company Market Share
9.2.3. Europe Company Market Share
9.2.4. APAC Company Market Share
9.3. Competitive Situations and Trends
9.3.1. Product Launches and Developments
9.3.2. Partnerships, Collaborations, and Agreements
9.3.3. Mergers & Acquisitions
9.3.4. Expansions
10. Company Profiles
10.1. AT&T
10.1.1. Business Overview
10.1.2. Company Snapshot
10.1.3. Company Market Share Analysis
10.1.4. Company Product Portfolio
10.1.5. Recent Developments
10.1.6. SWOT Analysis
10.2. Amaysim
10.2.1. Business Overview
10.2.2. Company Snapshot
10.2.3. Company Market Share Analysis
10.2.4. Company Product Portfolio
10.2.5. Recent Developments
10.2.6. SWOT Analysis
10.3. Bell
10.3.1. Business Overview
10.3.2. Company Snapshot
10.3.3. Company Market Share Analysis
10.3.4. Company Product Portfolio
10.3.5. Recent Developments
10.3.6. SWOT Analysis
10.4. Boost Mobile
10.4.1. Business Overview
10.4.2. Company Snapshot
10.4.3. Company Market Share Analysis
10.4.4. Company Product Portfolio
10.4.5. Recent Developments
10.4.6. SWOT Analysis
10.5. Birdie
10.5.1. Business Overview
10.5.2. Company Snapshot
10.5.3. Company Market Share Analysis
10.5.4. Company Product Portfolio
10.5.5. Recent Developments
10.5.6. SWOT Analysis
10.6. Bharti Airtel Limited
10.6.1. Business Overview
10.6.2. Company Snapshot
10.6.3. Company Market Share Analysis
10.6.4. Company Product Portfolio
10.6.5. Recent Developments
10.6.6. SWOT Analysis
10.7. Canstar Blue
10.7.1. Business Overview
10.7.2. Company Snapshot
10.7.3. Company Market Share Analysis
10.7.4. Company Product Portfolio
10.7.5. Recent Developments
10.7.6. SWOT Analysis
10.8. CSL
10.8.1. Business Overview
10.8.2. Company Snapshot
10.8.3. Company Market Share Analysis
10.8.4. Company Product Portfolio
10.8.5. Recent Developments
10.8.6. SWOT Analysis
10.9. C Spire
10.9.1. Business Overview
10.9.2. Company Snapshot
10.9.3. Company Market Share Analysis
10.9.4. Company Product Portfolio
10.9.5. Recent Developments
10.9.6. SWOT Analysis
10.10. Chatr
10.10.1. Business Overview
10.10.2. Company Snapshot
10.10.3. Company Market Share Analysis
10.10.4. Company Product Portfolio
10.10.5. Recent Developments
10.10.6. SWOT Analysis
10.11. Cricket Wireless
10.11.1. Business Overview
10.11.2. Company Snapshot
10.11.3. Company Market Share Analysis
10.11.4. Company Product Portfolio
10.11.5. Recent Developments
10.11.6. SWOT Analysis
10.12. Freedom Mobile
10.12.1. Business Overview
10.12.2. Company Snapshot
10.12.3. Company Market Share Analysis
10.12.4. Company Product Portfolio
10.12.5. Recent Developments
10.12.6. SWOT Analysis
10.13. Globe Telecom
10.13.1. Business Overview
10.13.2. Company Snapshot
10.13.3. Company Market Share Analysis
10.13.4. Company Product Portfolio
10.13.5. Recent Developments
10.13.6. SWOT Analysis
10.14. H3O Wireless
10.14.1. Business Overview
10.14.2. Company Snapshot
10.14.3. Company Market Share Analysis
10.14.4. Company Product Portfolio
10.14.5. Recent Developments
10.14.6. SWOT Analysis
10.15. Jio
10.15.1. Business Overview
10.15.2. Company Snapshot
10.15.3. Company Market Share Analysis
10.15.4. Company Product Portfolio
10.15.5. Recent Developments
10.15.6. SWOT Analysis
10.16. Koodo
10.16.1. Business Overview
10.16.2. Company Snapshot
10.16.3. Company Market Share Analysis
10.16.4. Company Product Portfolio
10.16.5. Recent Developments
10.16.6. SWOT Analysis
10.17. Kogan Mobile
10.17.1. Business Overview
10.17.2. Company Snapshot
10.17.3. Company Market Share Analysis
10.17.4. Company Product Portfolio
10.17.5. Recent Developments
10.17.6. SWOT Analysis
10.18. Mint Mobile
10.18.1. Business Overview
10.18.2. Company Snapshot
10.18.3. Company Market Share Analysis
10.18.4. Company Product Portfolio
10.18.5. Recent Developments
10.18.6. SWOT Analysis
10.19. PhoneBox
10.19.1. Business Overview
10.19.2. Company Snapshot
10.19.3. Company Market Share Analysis
10.19.4. Company Product Portfolio
10.19.5. Recent Developments
10.19.6. SWOT Analysis
10.20. Rogers
10.20.1. Business Overview
10.20.2. Company Snapshot
10.20.3. Company Market Share Analysis
10.20.4. Company Product Portfolio
10.20.5. Recent Developments
10.20.6. SWOT Analysis
10.21. SpeedTalk Mobile Wireless
10.21.1. Business Overview
10.21.2. Company Snapshot
10.21.3. Company Market Share Analysis
10.21.4. Company Product Portfolio
10.21.5. Recent Developments
10.21.6. SWOT Analysis
10.22. Spark
10.22.1. Business Overview
10.22.2. Company Snapshot
10.22.3. Company Market Share Analysis
10.22.4. Company Product Portfolio
10.22.5. Recent Developments
10.22.6. SWOT Analysis
10.23. Straight Talk
10.23.1. Business Overview
10.23.2. Company Snapshot
10.23.3. Company Market Share Analysis
10.23.4. Company Product Portfolio
10.23.5. Recent Developments
10.23.6. SWOT Analysis
10.24. SmarTone
10.24.1. Business Overview
10.24.2. Company Snapshot
10.24.3. Company Market Share Analysis
10.24.4. Company Product Portfolio
10.24.5. Recent Developments
10.24.6. SWOT Analysis
10.25. Shaw
10.25.1. Business Overview
10.25.2. Company Snapshot
10.25.3. Company Market Share Analysis
10.25.4. Company Product Portfolio
10.25.5. Recent Developments
10.25.6. SWOT Analysis
10.26. Three
10.26.1. Business Overview
10.26.2. Company Snapshot
10.26.3. Company Market Share Analysis
10.26.4. Company Product Portfolio
10.26.5. Recent Developments
10.26.6. SWOT Analysis
10.27. TELUS
10.27.1. Business Overview
10.27.2. Company Snapshot
10.27.3. Company Market Share Analysis
10.27.4. Company Product Portfolio
10.27.5. Recent Developments
10.27.6. SWOT Analysis
10.28. T-Mobile
10.28.1. Business Overview
10.28.2. Company Snapshot
10.28.3. Company Market Share Analysis
10.28.4. Company Product Portfolio
10.28.5. Recent Developments
10.28.6. SWOT Analysis
10.29. Tracfone
10.29.1. Business Overview
10.29.2. Company Snapshot
10.29.3. Company Market Share Analysis
10.29.4. Company Product Portfolio
10.29.5. Recent Developments
10.29.6. SWOT Analysis
10.30. Tello
10.30.1. Business Overview
10.30.2. Company Snapshot
10.30.3. Company Market Share Analysis
10.30.4. Company Product Portfolio
10.30.5. Recent Developments
10.30.6. SWOT Analysis
10.31. Telstra
10.31.1. Business Overview
10.31.2. Company Snapshot
10.31.3. Company Market Share Analysis
10.31.4. Company Product Portfolio
10.31.5. Recent Developments
10.31.6. SWOT Analysis
10.32. Uscell
10.32.1. Business Overview
10.32.2. Company Snapshot
10.32.3. Company Market Share Analysis
10.32.4. Company Product Portfolio
10.32.5. Recent Developments
10.32.6. SWOT Analysis
10.33. Visible
10.33.1. Business Overview
10.33.2. Company Snapshot
10.33.3. Company Market Share Analysis
10.33.4. Company Product Portfolio
10.33.5. Recent Developments
10.33.6. SWOT Analysis
10.34. Virgin Plus
10.34.1. Business Overview
10.34.2. Company Snapshot
10.34.3. Company Market Share Analysis
10.34.4. Company Product Portfolio
10.34.5. Recent Developments
10.34.6. SWOT Analysis
10.35. Verizon
10.35.1. Business Overview
10.35.2. Company Snapshot
10.35.3. Company Market Share Analysis
10.35.4. Company Product Portfolio
10.35.5. Recent Developments
10.35.6. SWOT Analysis
10.36. Vodafone Idea
10.36.1. Business Overview
10.36.2. Company Snapshot
10.36.3. Company Market Share Analysis
10.36.4. Company Product Portfolio
10.36.5. Recent Developments
10.36.6. SWOT Analysis
10.37. Woolworths Mobile
10.37.1. Business Overview
10.37.2. Company Snapshot
10.37.3. Company Market Share Analysis
10.37.4. Company Product Portfolio
10.37.5. Recent Developments
10.37.6. SWOT Analysis
List of Table
1. Global Prepaid Phone Plan Market, By Type, 2020-2033 (USD Billion)
2. Global 4G, Prepaid Phone Plan Market, By Region, 2020-2033 (USD Billion)
3. Global 5G, Prepaid Phone Plan Market, By Region, 2020-2033 (USD Billion)
4. Global Others, Prepaid Phone Plan Market, By Region, 2020-2033 (USD Billion)
5. Global Prepaid Phone Plan Market, By Application, 2020-2033 (USD Billion)
6. Global Personal, Prepaid Phone Plan Market, By Region, 2020-2033 (USD Billion)
7. Global Commercial, Prepaid Phone Plan Market, By Region, 2020-2033 (USD Billion)
8. Global Others, Prepaid Phone Plan Market, By Region, 2020-2033 (USD Billion)
9. Global Prepaid Phone Plan Market, By Region, 2020-2033 (USD Billion)
10. North America Prepaid Phone Plan Market, By Type, 2020-2033 (USD Billion)
11. North America Prepaid Phone Plan Market, By Application, 2020-2033 (USD Billion)
12. U.S. Prepaid Phone Plan Market, By Type, 2020-2033 (USD Billion)
13. U.S. Prepaid Phone Plan Market, By Application, 2020-2033 (USD Billion)
14. Canada Prepaid Phone Plan Market, By Type, 2020-2033 (USD Billion)
15. Canada Prepaid Phone Plan Market, By Application, 2020-2033 (USD Billion)
16. Mexico Prepaid Phone Plan Market, By Type, 2020-2033 (USD Billion)
17. Mexico Prepaid Phone Plan Market, By Application, 2020-2033 (USD Billion)
18. Europe Prepaid Phone Plan Market, By Type, 2020-2033 (USD Billion)
19. Europe Prepaid Phone Plan Market, By Application, 2020-2033 (USD Billion)
20. Germany Prepaid Phone Plan Market, By Type, 2020-2033 (USD Billion)
21. Germany Prepaid Phone Plan Market, By Application, 2020-2033 (USD Billion)
22. France Prepaid Phone Plan Market, By Type, 2020-2033 (USD Billion)
23. France Prepaid Phone Plan Market, By Application, 2020-2033 (USD Billion)
24. U.K. Prepaid Phone Plan Market, By Type, 2020-2033 (USD Billion)
25. U.K. Prepaid Phone Plan Market, By Application, 2020-2033 (USD Billion)
26. Italy Prepaid Phone Plan Market, By Type, 2020-2033 (USD Billion)
27. Italy Prepaid Phone Plan Market, By Application, 2020-2033 (USD Billion)
28. Spain Prepaid Phone Plan Market, By Type, 2020-2033 (USD Billion)
29. Spain Prepaid Phone Plan Market, By Application, 2020-2033 (USD Billion)
30. Asia Pacific Prepaid Phone Plan Market, By Type, 2020-2033 (USD Billion)
31. Asia Pacific Prepaid Phone Plan Market, By Application, 2020-2033 (USD Billion)
32. Japan Prepaid Phone Plan Market, By Type, 2020-2033 (USD Billion)
33. Japan Prepaid Phone Plan Market, By Application, 2020-2033 (USD Billion)
34. China Prepaid Phone Plan Market, By Type, 2020-2033 (USD Billion)
35. China Prepaid Phone Plan Market, By Application, 2020-2033 (USD Billion)
36. India Prepaid Phone Plan Market, By Type, 2020-2033 (USD Billion)
37. India Prepaid Phone Plan Market, By Application, 2020-2033 (USD Billion)
38. South America Prepaid Phone Plan Market, By Type, 2020-2033 (USD Billion)
39. South America Prepaid Phone Plan Market, By Application, 2020-2033 (USD Billion)
40. Brazil Prepaid Phone Plan Market, By Type, 2020-2033 (USD Billion)
41. Brazil Prepaid Phone Plan Market, By Application, 2020-2033 (USD Billion)
42. Middle East and Africa Prepaid Phone Plan Market, By Type, 2020-2033 (USD Billion)
43. Middle East and Africa Prepaid Phone Plan Market, By Application, 2020-2033 (USD Billion)
44. UAE Prepaid Phone Plan Market, By Type, 2020-2033 (USD Billion)
45. UAE Prepaid Phone Plan Market, By Application, 2020-2033 (USD Billion)
46. South Africa Prepaid Phone Plan Market, By Type, 2020-2033 (USD Billion)
47. South Africa Prepaid Phone Plan Market, By Application, 2020-2033 (USD Billion)
List of Figures
1. Global Prepaid Phone Plan Market Segmentation
2. Prepaid Phone Plan Market: Research Methodology
3. Market Size Estimation Methodology: Bottom-Up Approach
4. Market Size Estimation Methodology: Top-Down Approach
5. Data Triangulation
6. Porter’s Five Forces Analysis
7. Value Chain Analysis
8. Global Prepaid Phone Plan Market Attractiveness Analysis By Type
9. Global Prepaid Phone Plan Market Attractiveness Analysis By Application
10. Global Prepaid Phone Plan Market Attractiveness Analysis By Region
11. Global Prepaid Phone Plan Market: Dynamics
12. Global Prepaid Phone Plan Market Share By Type (2024 & 2033)
13. Global Prepaid Phone Plan Market Share By Application (2024 & 2033)
14. Global Prepaid Phone Plan Market Share By Regions (2024 & 2033)
15. Global Prepaid Phone Plan Market Share by Company (2023)
This study forecasts revenue at global, regional, and country levels from 2020 to 2033. The Brainy Insights has segmented the global Prepaid Phone Plan market based on below-mentioned segments:
Global Prepaid Phone Plan Market by Type:
Global Prepaid Phone Plan Market by Application:
Global Prepaid Phone Plan Market by Region:
Research has its special purpose to undertake marketing efficiently. In this competitive scenario, businesses need information across all industry verticals; the information about customer wants, market demand, competition, industry trends, distribution channels etc. This information needs to be updated regularly because businesses operate in a dynamic environment. Our organization, The Brainy Insights incorporates scientific and systematic research procedures in order to get proper market insights and industry analysis for overall business success. The analysis consists of studying the market from a miniscule level wherein we implement statistical tools which helps us in examining the data with accuracy and precision.
Our research reports feature both; quantitative and qualitative aspects for any market. Qualitative information for any market research process are fundamental because they reveal the customer needs and wants, usage and consumption for any product/service related to a specific industry. This in turn aids the marketers/investors in knowing certain perceptions of the customers. Qualitative research can enlighten about the different product concepts and designs along with unique service offering that in turn, helps define marketing problems and generate opportunities. On the other hand, quantitative research engages with the data collection process through interviews, e-mail interactions, surveys and pilot studies. Quantitative aspects for the market research are useful to validate the hypotheses generated during qualitative research method, explore empirical patterns in the data with the help of statistical tools, and finally make the market estimations.
The Brainy Insights offers comprehensive research and analysis, based on a wide assortment of factual insights gained through interviews with CXOs and global experts and secondary data from reliable sources. Our analysts and industry specialist assume vital roles in building up statistical tools and analysis models, which are used to analyse the data and arrive at accurate insights with exceedingly informative research discoveries. The data provided by our organization have proven precious to a diverse range of companies, facilitating them to address issues such as determining which products/services are the most appealing, whether or not customers use the product in the manner anticipated, the purchasing intentions of the market and many others.
Our research methodology encompasses an idyllic combination of primary and secondary initiatives. Key phases involved in this process are listed below:

The phase involves the gathering and collecting of market data and its related information with the help of different sources & research procedures.

The data procurement stage involves in data gathering and collecting through various data sources.
This stage involves in extensive research. These data sources includes:
Purchased Database: Purchased databases play a crucial role in estimating the market sizes irrespective of the domain. Our purchased database includes:
Primary Research: The Brainy Insights interacts with leading companies and experts of the concerned domain to develop the analyst team’s market understanding and expertise. It improves and substantiates every single data presented in the market reports. Primary research mainly involves in telephonic interviews, E-mail interactions and face-to-face interviews with the raw material providers, manufacturers/producers, distributors, & independent consultants. The interviews that we conduct provides valuable data on market size and industry growth trends prevailing in the market. Our organization also conducts surveys with the various industry experts in order to gain overall insights of the industry/market. For instance, in healthcare industry we conduct surveys with the pharmacists, doctors, surgeons and nurses in order to gain insights and key information of a medical product/device/equipment which the customers are going to usage. Surveys are conducted in the form of questionnaire designed by our own analyst team. Surveys plays an important role in primary research because surveys helps us to identify the key target audiences of the market. Additionally, surveys helps to identify the key target audience engaged with the market. Our survey team conducts the survey by targeting the key audience, thus gaining insights from them. Based on the perspectives of the customers, this information is utilized to formulate market strategies. Moreover, market surveys helps us to understand the current competitive situation of the industry. To be precise, our survey process typically involve with the 360 analysis of the market. This analytical process begins by identifying the prospective customers for a product or service related to the market/industry to obtain data on how a product/service could fit into customers’ lives.

Secondary Research: The secondary data sources includes information published by the on-profit organizations such as World bank, WHO, company fillings, investor presentations, annual reports, national government documents, statistical databases, blogs, articles, white papers and others. From the annual report, we analyse a company’s revenue to understand the key segment and market share of that organization in a particular region. We analyse the company websites and adopt the product mapping technique which is important for deriving the segment revenue. In the product mapping method, we select and categorize the products offered by the companies catering to domain specific market, deduce the product revenue for each of the companies so as to get overall estimation of the market size. We also source data and analyses trends based on information received from supply side and demand side intermediaries in the value chain. The supply side denotes the data gathered from supplier, distributor, wholesaler and the demand side illustrates the data gathered from the end customers for respective market domain.

The supply side for a domain specific market is analysed by:
The demand side for the market is estimated through:
In-house Library: Apart from these third-party sources, we have our in-house library of qualitative and quantitative information. Our in-house database includes market data for various industry and domains. These data are updated on regular basis as per the changing market scenario. Our library includes, historic databases, internal audit reports and archives.
Sometimes there are instances where there is no metadata or raw data available for any domain specific market. For those cases, we use our expertise to forecast and estimate the market size in order to generate comprehensive data sets. Our analyst team adopt a robust research technique in order to produce the estimates:
Data Synthesis: This stage involves the analysis & mapping of all the information obtained from the previous step. It also involves in scrutinizing the data for any discrepancy observed while data gathering related to the market. The data is collected with consideration to the heterogeneity of sources. Robust scientific techniques are in place for synthesizing disparate data sets and provide the essential contextual information that can orient market strategies. The Brainy Insights has extensive experience in data synthesis where the data passes through various stages:


Market Deduction & Formulation: The final stage comprises of assigning data points at appropriate market spaces so as to deduce feasible conclusions. Analyst perspective & subject matter expert based holistic form of market sizing coupled with industry analysis also plays a crucial role in this stage.
This stage involves in finalization of the market size and numbers that we have collected from data integration step. With data interpolation, it is made sure that there is no gap in the market data. Successful trend analysis is done by our analysts using extrapolation techniques, which provide the best possible forecasts for the market.
Data Validation & Market Feedback: Validation is the most important step in the process. Validation & re-validation via an intricately designed process helps us finalize data-points to be used for final calculations.

The Brainy Insights interacts with leading companies and experts of the concerned domain to develop the analyst team’s market understanding and expertise. It improves and substantiates every single data presented in the market reports. The data validation interview and discussion panels are typically composed of the most experienced industry members. The participants include, however, are not limited to:
Moreover, we always validate our data and findings through primary respondents from all the major regions we are working on.


Free Customization
Fortune 500 Clients
Free Yearly Update On Purchase Of Multi/Corporate License
Companies Served Till Date