- +1-315-215-1633
- sales@thebrainyinsights.com

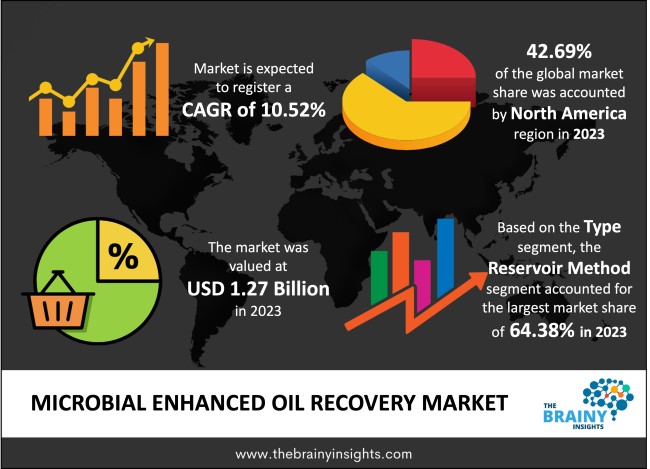
The global Microbial Enhanced Oil Recovery market generated USD 1.27 Billion revenue in 2023 and is projected to grow at a CAGR of 10.52% from 2024 to 2033. The market is expected to reach USD 3.45 Billion by 2033. The increasing oil demand will influence the growth of the global microbial-enhanced oil recovery (MEOR) market as the world’s population increases and industries continue to grow, as well as a better perception of the advantages of this type of recovery amongst stakeholders. Moreover, technology-advanced MEOR techniques help to minimize the expenses compared to normal oil recovery processes. The use of naturally developed or genetically engineered microorganisms has the added advantage of lacking the use base or complex infrastructure or machines compared to other systems, making it quite recommendable to oil companies in its ability to maximize returns.
MEOR stands for microbial enhanced oil recovery, which refers to an emerging technology in the oil and gas industry that boosts the production of hydrocarbon resources from the field. Microbial-enhanced oil recovery refers to the use of biological techniques involving microorganisms, including bacteria and fungi, to improve the performance of the recovery process of crude oil. MEOR, in turn, operates under different processes such as Enhanced biosurfactant activity to reduce surface tension and enable movement of the oil phase, Biodegradation to break down the hydrocarbons to manageable sizes or age them to enable recovery by microorganisms and well contradiction to plug water-producing formations and reroute injection fluid forcing oil producing formation. This technique delivers some benefits, including the capability of friendly climate exploitation, efficiency in cost expenditure, and enhanced recovery rates. Some challenges can be as follows: To capture and use the gas, constant assessment of reservoir conditions is required, and microbial contamination can also be a problem. In conclusion, microbial-enhanced oil recovery is a promising approach that provides a high oil recovery rate without adversely impacting the environment and simultaneously reduces costs for oil and gas companies.
Get an overview of this study by requesting a free sample
Recovery Technique/Sustainability - Due to the current challenges facing the earth’s climate, MEOR can be described as a more environmentally friendly oil recovery method. In general, microbial techniques can cause less harm to the environment since they present fewer threats of being categorized as hazardous compared to harsh chemical techniques. This conforms to the current trend of the demand for environmentally friendly methods being on the rise, specifically in the oil and gas industry.
MEOR Opportunity for Enhanced Oil Recovery (EOR)- From this section, it can be deduced that MEOR can raise oil recovery beyond what may be possible by normal standard techniques. Microorganisms also affect the ability of crude oil and reservoir rock to change their characteristics and expand the amount of oil that has been trapped in the pore space to be more easily extracted. This increased recovery rate could also enhance the TAG and optimize the use of the oil resources available in the oil fields.
Microorganisms are Versatile and Adaptable-The use of microorganisms that act in MEOR also showed the organisms' ability to thrive in different conditions, temperatures, and salinities in the oil reserves. This versatility makes MEOR techniques flexible and applicable to different categories of geological prospects, thus making them suitable for onshore and offshore fields worldwide.
Technical Aspects - In MEOR technology, there are still challenges that need to be addressed. These include Understanding how to manage the microbial inhabitants of the reservoir, enhancing the ability to nurture different microbial strains on substrata unique to the geology of any given area, and, most importantly, working on how best to introduce the microorganisms into the subsurface.
Reservoir Heterogeneity - The rocks forming oil reservoirs are inherently relatively heterogeneous in terms of porosity, permeability, and microbial suitability. Addressing this challenge requires proper MEOR techniques since the effectiveness of the techniques depends on the reservoir conditions where MEOR techniques will be applicable, while others may not be applicable under the same conditions.
Ongoing Biotechnology Advancements - Additional development of biotechnology methods in which genetic engineering and synthetic biology are on the frontier provides the potential for creating new microbial strains that could degrade oil at far higher efficiencies. Through the application of biotechnology, researchers will be able to custom-design microorganisms that best fit the specific reservoir conditions in MEOR operations.
Optimization with New Techniques-Improving MEOR in combination with other advanced digital technologies like AI, ML, and DA (data analytics) can help enhance reservoir management and improve the efficacy of oil recovery. By using real-time data collection and analysis and the model in this study, operators should be able to make the right decisions in determining the extent of MEOR treatments and their associated hazards.
Risk and Inapplicable Knowledge - MEOR is a system with very difficult-to-comprehend interactions between microorganisms, reservoirs, and the geology of the subsurface formations. In addition, there is always the issue of uncertainty when modelling the microbial behaviour and overall reservoir response to MEOR treatments, making it a challenge to develop detailed plans for MEOR treatments and ways to evaluate their sustainability.
Scale-up and Commercialization - Some major challenges to scaling MEOR from laboratory experiments to actual field application are that it may be logistically complex, high cost, and attract certain legal requirements. Overcoming the barriers of technology first and economics second is deemed important for the oil and gas industry to accept MEOR technologies.
The regions analyzed for the market include North America, Europe, South America, Asia Pacific, the Middle East, and Africa. North America emerged as the most prominent global Microbial Enhanced Oil Recovery market, with a 42.69% market revenue share in 2023.
North America has been a key driving force in adopting technological change in MEOR activity in the oil and gas industry. Several research institutions, technology vendors and direct oil companies are funding MEOR research and development in the region to enhance innovation and practical application of MEOR solutions. Moreover, it must be noted that North America has significant oil resources, with many unconventional resources, including shale oil and tight oil formation. The given reservoirs are quite demanding in terms of recovery, so MEOR techniques have been used more frequently, dominating the market in the region. Thirdly, the North American region has a rather favourable regulatory system for the exploration of innovation and advancements of technology in the context of oil and gas. Government and tax policies also support the growth and adoption of MEOR as an innovative oil recovery technology vital for market growth. Furthermore, partnerships between operators and original equipment manufacturers (OEMs), academic institutions, and governmental organizations operating in the oil industry are also frequently evident in North America. Outsourcing and knowledge management practices of MEOR solutions advance the velocity of solutions’ development, commercialization, and deployment, thus helping augment the region’s market dominance.
North America Region Microbial Enhanced Oil Recovery Market Share in 2023- 42.69%
www.thebrainyinsights.com
Check the geographical analysis of this market by requesting a free sample
The type segment is divided into ground method and reservoir method. The reservoir method segment dominated the market, with a share of around 64.38% in 2023. Direct injection of microbes involves releasing the microbes directly into the reservoir to improve oil recovery through the following methods, which has positively impacted oil production in many geological formations. Several opportunities for MEOR effectiveness have been discovered to provide extensive field trials or case studies and boost oil recovery rates, contributing to MEOR’s common use and market monopoly. Moreover, there is the possibility of applying the reservoir method to various reservoir types, from sandstone to carbonate and shale formations. Being versatile when it comes to the type of formation it is designed for is one of the reasons which has led to the domination of this type of EOR technique among operators, as it can be applied in any geology to increase the amount of oil that can be produced. However, the other method, the reservoir method, also has the potential to hold great longevity for enhancing oil recovery, thereby creating sustainable microbial populations within the reservoir. Once these microbial populations are set up, they can maintain the capability of metabolizing released oil and improving further recovery over relatively long periods, making the Reservoir Method a shoo-in for operators looking for long-term gains.
The application segment is classified into onshore oilfield and offshore oilfield. The onshore oilfield segment dominated the market, with a share of around 65.27% in 2023. Offshore fields constitute a large portion of the total world reserves of natural resources; specifically, onshore oil fields are considered equally significant. These reservoirs are normally associated with conventional and non-conventional structural formations suitable for MEOR development. The strong focus on abundant onshore reserves means a large market for technologies linked to MEOR underpins this segment. Also, onshore fields are comparatively easier to access and have better motor facilities than offshore fields. It also helps reduce the proceduralities involved in planning and implementing MEOR projects such as microbial injection and other monitoring operations. There are existing pipelines, roads, and support facilities in the countries contributing to the installation and operation of MEOR technologies and, hence, the dominance of the MEOR market. Moreover, it is a fact that onshore oil production is generally carried out at cheaper costs than operating in offshore structures. MEOR techniques designed to increase oil recovery and thus reduce costs can be of special interest to onshore field operators in maximizing their ROIs. This aspect makes it a priority for MEOR application since the favourable economics of onshore operations keep making them major market destinations.
| Attribute | Description |
|---|---|
| Market Size | Revenue (USD Billion) |
| Market size value in 2023 | USD 1.27 Billion |
| Market size value in 2033 | USD 3.45 Billion |
| CAGR (2024 to 2033) | 10.52% |
| Historical data | 2020-2022 |
| Base Year | 2023 |
| Forecast | 2024-2033 |
| Region | The regions analyzed for the market are Asia Pacific, Europe, South America, North America, and Middle East & Africa. Furthermore, the regions are further analyzed at the country level. |
| Segments | Type and Application |
As per The Brainy Insights, the size of the microbial enhanced oil recovery market was valued at USD 1.27 billion in 2023 to USD 3.45 billion by 2033.
The global microbial enhanced oil recovery market is growing at a CAGR of 10.52% during the forecast period 2024-2033.
North America became the largest market for microbial enhanced oil recovery.
Environmental sustainability and enhanced oil recovery (EOR) potential drive the market's growth.
1. Introduction
1.1. Objectives of the Study
1.2. Market Definition
1.3. Research Scope
1.4. Currency
1.5. Key Target Audience
2. Research Methodology and Assumptions
3. Executive Summary
4. Premium Insights
4.1. Porter’s Five Forces Analysis
4.2. Value Chain Analysis
4.3. Top Investment Pockets
4.3.1. Market Attractiveness Analysis By Type
4.3.2. Market Attractiveness Analysis By Application
4.3.3. Market Attractiveness Analysis By Region
4.4. Industry Trends
5. Market Dynamics
5.1. Market Evaluation
5.2. Drivers
5.2.1. Recovery Technique/Sustainability
5.2.2. MEOR Opportunity for Enhanced Oil Recovery (EOR)
5.3. Restraints
5.3.1. Technical Aspects
5.4. Opportunities
5.4.1. Ongoing Biotechnology Advancements
5.5. Challenges
5.5.1. Risk and Inapplicable Knowledge
6. Global Microbial Enhanced Oil Recovery Market Analysis and Forecast, By Type
6.1. Segment Overview
6.2. Ground Method
6.3. Reservoir Method
7. Global Microbial Enhanced Oil Recovery Market Analysis and Forecast, By Application
7.1. Segment Overview
7.2. Onshore Oilfield
7.3. Offshore Oilfield
8. Global Microbial Enhanced Oil Recovery Market Analysis and Forecast, By Regional Analysis
8.1. Segment Overview
8.2. North America
8.2.1. U.S.
8.2.2. Canada
8.2.3. Mexico
8.3. Europe
8.3.1. Germany
8.3.2. France
8.3.3. U.K.
8.3.4. Italy
8.3.5. Spain
8.4. Asia-Pacific
8.4.1. Japan
8.4.2. China
8.4.3. India
8.5. South America
8.5.1. Brazil
8.6. Middle East and Africa
8.6.1. UAE
8.6.2. South Africa
9. Global Microbial Enhanced Oil Recovery Market-Competitive Landscape
9.1. Overview
9.2. Market Share of Key Players in the Microbial Enhanced Oil Recovery Market
9.2.1. Global Company Market Share
9.2.2. North America Company Market Share
9.2.3. Europe Company Market Share
9.2.4. APAC Company Market Share
9.3. Competitive Situations and Trends
9.3.1. Product Launches and Developments
9.3.2. Partnerships, Collaborations, and Agreements
9.3.3. Mergers & Acquisitions
9.3.4. Expansions
10. Company Profiles
10.1. BP
10.1.1. Business Overview
10.1.2. Company Snapshot
10.1.3. Company Market Share Analysis
10.1.4. Company Product Portfolio
10.1.5. Recent Developments
10.1.6. SWOT Analysis
10.2. Baker Hughes
10.2.1. Business Overview
10.2.2. Company Snapshot
10.2.3. Company Market Share Analysis
10.2.4. Company Product Portfolio
10.2.5. Recent Developments
10.2.6. SWOT Analysis
10.3. ConocoPhillips
10.3.1. Business Overview
10.3.2. Company Snapshot
10.3.3. Company Market Share Analysis
10.3.4. Company Product Portfolio
10.3.5. Recent Developments
10.3.6. SWOT Analysis
10.4. CNPC
10.4.1. Business Overview
10.4.2. Company Snapshot
10.4.3. Company Market Share Analysis
10.4.4. Company Product Portfolio
10.4.5. Recent Developments
10.4.6. SWOT Analysis
10.5. Cenovus Energy
10.5.1. Business Overview
10.5.2. Company Snapshot
10.5.3. Company Market Share Analysis
10.5.4. Company Product Portfolio
10.5.5. Recent Developments
10.5.6. SWOT Analysis
10.6. Chemiphase Ltd.
10.6.1. Business Overview
10.6.2. Company Snapshot
10.6.3. Company Market Share Analysis
10.6.4. Company Product Portfolio
10.6.5. Recent Developments
10.6.6. SWOT Analysis
10.7. Equinor ASA
10.7.1. Business Overview
10.7.2. Company Snapshot
10.7.3. Company Market Share Analysis
10.7.4. Company Product Portfolio
10.7.5. Recent Developments
10.7.6. SWOT Analysis
10.8. Gazprom Neft
10.8.1. Business Overview
10.8.2. Company Snapshot
10.8.3. Company Market Share Analysis
10.8.4. Company Product Portfolio
10.8.5. Recent Developments
10.8.6. SWOT Analysis
10.9. Halliburton
10.9.1. Business Overview
10.9.2. Company Snapshot
10.9.3. Company Market Share Analysis
10.9.4. Company Product Portfolio
10.9.5. Recent Developments
10.9.6. SWOT Analysis
10.10. Lukoil
10.10.1. Business Overview
10.10.2. Company Snapshot
10.10.3. Company Market Share Analysis
10.10.4. Company Product Portfolio
10.10.5. Recent Developments
10.10.6. SWOT Analysis
10.11. Micro-Bac International Inc.
10.11.1. Business Overview
10.11.2. Company Snapshot
10.11.3. Company Market Share Analysis
10.11.4. Company Product Portfolio
10.11.5. Recent Developments
10.11.6. SWOT Analysis
10.12. National Energy Services Reunited Corp.
10.12.1. Business Overview
10.12.2. Company Snapshot
10.12.3. Company Market Share Analysis
10.12.4. Company Product Portfolio
10.12.5. Recent Developments
10.12.6. SWOT Analysis
10.13. OMV Group
10.13.1. Business Overview
10.13.2. Company Snapshot
10.13.3. Company Market Share Analysis
10.13.4. Company Product Portfolio
10.13.5. Recent Developments
10.13.6. SWOT Analysis
10.14. PetroChina
10.14.1. Business Overview
10.14.2. Company Snapshot
10.14.3. Company Market Share Analysis
10.14.4. Company Product Portfolio
10.14.5. Recent Developments
10.14.6. SWOT Analysis
10.15. Royal Dutch Shell
10.15.1. Business Overview
10.15.2. Company Snapshot
10.15.3. Company Market Share Analysis
10.15.4. Company Product Portfolio
10.15.5. Recent Developments
10.15.6. SWOT Analysis
10.16. RAM Biochemical Inc.
10.16.1. Business Overview
10.16.2. Company Snapshot
10.16.3. Company Market Share Analysis
10.16.4. Company Product Portfolio
10.16.5. Recent Developments
10.16.6. SWOT Analysis
10.17. Schlumberger
10.17.1. Business Overview
10.17.2. Company Snapshot
10.17.3. Company Market Share Analysis
10.17.4. Company Product Portfolio
10.17.5. Recent Developments
10.17.6. SWOT Analysis
10.18. Statoil
10.18.1. Business Overview
10.18.2. Company Snapshot
10.18.3. Company Market Share Analysis
10.18.4. Company Product Portfolio
10.18.5. Recent Developments
10.18.6. SWOT Analysis
10.19. Total S.A.
10.19.1. Business Overview
10.19.2. Company Snapshot
10.19.3. Company Market Share Analysis
10.19.4. Company Product Portfolio
10.19.5. Recent Developments
10.19.6. SWOT Analysis
10.20. Rogers
10.20.1. Business Overview
10.20.2. Company Snapshot
10.20.3. Company Market Share Analysis
10.20.4. Company Product Portfolio
10.20.5. Recent Developments
10.20.6. SWOT Analysis
10.21. Titan Oil Recovery Inc.
10.21.1. Business Overview
10.21.2. Company Snapshot
10.21.3. Company Market Share Analysis
10.21.4. Company Product Portfolio
10.21.5. Recent Developments
10.21.6. SWOT Analysis
10.22. Weatherford International
10.22.1. Business Overview
10.22.2. Company Snapshot
10.22.3. Company Market Share Analysis
10.22.4. Company Product Portfolio
10.22.5. Recent Developments
10.22.6. SWOT Analysis
List of Table
1. Global Microbial Enhanced Oil Recovery Market, By Type, 2020-2033 (USD Billion)
2. Global Ground Method, Microbial Enhanced Oil Recovery Market, By Region, 2020-2033 (USD Billion)
3. Global Reservoir Method, Microbial Enhanced Oil Recovery Market, By Region, 2020-2033 (USD Billion)
4. Global Microbial Enhanced Oil Recovery Market, By Application, 2020-2033 (USD Billion)
5. Global Onshore Oilfield, Microbial Enhanced Oil Recovery Market, By Region, 2020-2033 (USD Billion)
6. Global Offshore Oilfield, Microbial Enhanced Oil Recovery Market, By Region, 2020-2033 (USD Billion)
7. Global Microbial Enhanced Oil Recovery Market, By Region, 2020-2033 (USD Billion)
8. North America Microbial Enhanced Oil Recovery Market, By Type, 2020-2033 (USD Billion)
9. North America Microbial Enhanced Oil Recovery Market, By Application, 2020-2033 (USD Billion)
10. U.S. Microbial Enhanced Oil Recovery Market, By Type, 2020-2033 (USD Billion)
11. U.S. Microbial Enhanced Oil Recovery Market, By Application, 2020-2033 (USD Billion)
12. Canada Microbial Enhanced Oil Recovery Market, By Type, 2020-2033 (USD Billion)
13. Canada Microbial Enhanced Oil Recovery Market, By Application, 2020-2033 (USD Billion)
14. Mexico Microbial Enhanced Oil Recovery Market, By Type, 2020-2033 (USD Billion)
15. Mexico Microbial Enhanced Oil Recovery Market, By Application, 2020-2033 (USD Billion)
16. Europe Microbial Enhanced Oil Recovery Market, By Type, 2020-2033 (USD Billion)
17. Europe Microbial Enhanced Oil Recovery Market, By Application, 2020-2033 (USD Billion)
18. Germany Microbial Enhanced Oil Recovery Market, By Type, 2020-2033 (USD Billion)
19. Germany Microbial Enhanced Oil Recovery Market, By Application, 2020-2033 (USD Billion)
20. France Microbial Enhanced Oil Recovery Market, By Type, 2020-2033 (USD Billion)
21. France Microbial Enhanced Oil Recovery Market, By Application, 2020-2033 (USD Billion)
22. U.K. Microbial Enhanced Oil Recovery Market, By Type, 2020-2033 (USD Billion)
23. U.K. Microbial Enhanced Oil Recovery Market, By Application, 2020-2033 (USD Billion)
24. Italy Microbial Enhanced Oil Recovery Market, By Type, 2020-2033 (USD Billion)
25. Italy Microbial Enhanced Oil Recovery Market, By Application, 2020-2033 (USD Billion)
26. Spain Microbial Enhanced Oil Recovery Market, By Type, 2020-2033 (USD Billion)
27. Spain Microbial Enhanced Oil Recovery Market, By Application, 2020-2033 (USD Billion)
28. Asia Pacific Microbial Enhanced Oil Recovery Market, By Type, 2020-2033 (USD Billion)
29. Asia Pacific Microbial Enhanced Oil Recovery Market, By Application, 2020-2033 (USD Billion)
30. Japan Microbial Enhanced Oil Recovery Market, By Type, 2020-2033 (USD Billion)
31. Japan Microbial Enhanced Oil Recovery Market, By Application, 2020-2033 (USD Billion)
32. China Microbial Enhanced Oil Recovery Market, By Type, 2020-2033 (USD Billion)
33. China Microbial Enhanced Oil Recovery Market, By Application, 2020-2033 (USD Billion)
34. India Microbial Enhanced Oil Recovery Market, By Type, 2020-2033 (USD Billion)
35. India Microbial Enhanced Oil Recovery Market, By Application, 2020-2033 (USD Billion)
36. South America Microbial Enhanced Oil Recovery Market, By Type, 2020-2033 (USD Billion)
37. South America Microbial Enhanced Oil Recovery Market, By Application, 2020-2033 (USD Billion)
38. Brazil Microbial Enhanced Oil Recovery Market, By Type, 2020-2033 (USD Billion)
39. Brazil Microbial Enhanced Oil Recovery Market, By Application, 2020-2033 (USD Billion)
40. Middle East and Africa Microbial Enhanced Oil Recovery Market, By Type, 2020-2033 (USD Billion)
41. Middle East and Africa Microbial Enhanced Oil Recovery Market, By Application, 2020-2033 (USD Billion)
42. UAE Microbial Enhanced Oil Recovery Market, By Type, 2020-2033 (USD Billion)
43. UAE Microbial Enhanced Oil Recovery Market, By Application, 2020-2033 (USD Billion)
44. South Africa Microbial Enhanced Oil Recovery Market, By Type, 2020-2033 (USD Billion)
45. South Africa Microbial Enhanced Oil Recovery Market, By Application, 2020-2033 (USD Billion)
List of Figures
1. Global Microbial Enhanced Oil Recovery Market Segmentation
2. Microbial Enhanced Oil Recovery Market: Research Methodology
3. Market Size Estimation Methodology: Bottom-Up Approach
4. Market Size Estimation Methodology: Top-Down Approach
5. Data Triangulation
6. Porter’s Five Forces Analysis
7. Value Chain Analysis
8. Global Microbial Enhanced Oil Recovery Market Attractiveness Analysis By Type
9. Global Microbial Enhanced Oil Recovery Market Attractiveness Analysis By Application
10. Global Microbial Enhanced Oil Recovery Market Attractiveness Analysis By Region
11. Global Microbial Enhanced Oil Recovery Market: Dynamics
12. Global Microbial Enhanced Oil Recovery Market Share By Type (2024 & 2033)
13. Global Microbial Enhanced Oil Recovery Market Share By Application (2024 & 2033)
14. Global Microbial Enhanced Oil Recovery Market Share By Regions (2024 & 2033)
15. Global Microbial Enhanced Oil Recovery Market Share by Company (2023)
This study forecasts revenue at global, regional, and country levels from 2020 to 2033. The Brainy Insights has segmented the global Microbial Enhanced Oil Recovery market based on below-mentioned segments:
Global Microbial Enhanced Oil Recovery Market by Type:
Global Microbial Enhanced Oil Recovery Market by Application:
Global Microbial Enhanced Oil Recovery Market by Region:
Research has its special purpose to undertake marketing efficiently. In this competitive scenario, businesses need information across all industry verticals; the information about customer wants, market demand, competition, industry trends, distribution channels etc. This information needs to be updated regularly because businesses operate in a dynamic environment. Our organization, The Brainy Insights incorporates scientific and systematic research procedures in order to get proper market insights and industry analysis for overall business success. The analysis consists of studying the market from a miniscule level wherein we implement statistical tools which helps us in examining the data with accuracy and precision.
Our research reports feature both; quantitative and qualitative aspects for any market. Qualitative information for any market research process are fundamental because they reveal the customer needs and wants, usage and consumption for any product/service related to a specific industry. This in turn aids the marketers/investors in knowing certain perceptions of the customers. Qualitative research can enlighten about the different product concepts and designs along with unique service offering that in turn, helps define marketing problems and generate opportunities. On the other hand, quantitative research engages with the data collection process through interviews, e-mail interactions, surveys and pilot studies. Quantitative aspects for the market research are useful to validate the hypotheses generated during qualitative research method, explore empirical patterns in the data with the help of statistical tools, and finally make the market estimations.
The Brainy Insights offers comprehensive research and analysis, based on a wide assortment of factual insights gained through interviews with CXOs and global experts and secondary data from reliable sources. Our analysts and industry specialist assume vital roles in building up statistical tools and analysis models, which are used to analyse the data and arrive at accurate insights with exceedingly informative research discoveries. The data provided by our organization have proven precious to a diverse range of companies, facilitating them to address issues such as determining which products/services are the most appealing, whether or not customers use the product in the manner anticipated, the purchasing intentions of the market and many others.
Our research methodology encompasses an idyllic combination of primary and secondary initiatives. Key phases involved in this process are listed below:

The phase involves the gathering and collecting of market data and its related information with the help of different sources & research procedures.

The data procurement stage involves in data gathering and collecting through various data sources.
This stage involves in extensive research. These data sources includes:
Purchased Database: Purchased databases play a crucial role in estimating the market sizes irrespective of the domain. Our purchased database includes:
Primary Research: The Brainy Insights interacts with leading companies and experts of the concerned domain to develop the analyst team’s market understanding and expertise. It improves and substantiates every single data presented in the market reports. Primary research mainly involves in telephonic interviews, E-mail interactions and face-to-face interviews with the raw material providers, manufacturers/producers, distributors, & independent consultants. The interviews that we conduct provides valuable data on market size and industry growth trends prevailing in the market. Our organization also conducts surveys with the various industry experts in order to gain overall insights of the industry/market. For instance, in healthcare industry we conduct surveys with the pharmacists, doctors, surgeons and nurses in order to gain insights and key information of a medical product/device/equipment which the customers are going to usage. Surveys are conducted in the form of questionnaire designed by our own analyst team. Surveys plays an important role in primary research because surveys helps us to identify the key target audiences of the market. Additionally, surveys helps to identify the key target audience engaged with the market. Our survey team conducts the survey by targeting the key audience, thus gaining insights from them. Based on the perspectives of the customers, this information is utilized to formulate market strategies. Moreover, market surveys helps us to understand the current competitive situation of the industry. To be precise, our survey process typically involve with the 360 analysis of the market. This analytical process begins by identifying the prospective customers for a product or service related to the market/industry to obtain data on how a product/service could fit into customers’ lives.

Secondary Research: The secondary data sources includes information published by the on-profit organizations such as World bank, WHO, company fillings, investor presentations, annual reports, national government documents, statistical databases, blogs, articles, white papers and others. From the annual report, we analyse a company’s revenue to understand the key segment and market share of that organization in a particular region. We analyse the company websites and adopt the product mapping technique which is important for deriving the segment revenue. In the product mapping method, we select and categorize the products offered by the companies catering to domain specific market, deduce the product revenue for each of the companies so as to get overall estimation of the market size. We also source data and analyses trends based on information received from supply side and demand side intermediaries in the value chain. The supply side denotes the data gathered from supplier, distributor, wholesaler and the demand side illustrates the data gathered from the end customers for respective market domain.

The supply side for a domain specific market is analysed by:
The demand side for the market is estimated through:
In-house Library: Apart from these third-party sources, we have our in-house library of qualitative and quantitative information. Our in-house database includes market data for various industry and domains. These data are updated on regular basis as per the changing market scenario. Our library includes, historic databases, internal audit reports and archives.
Sometimes there are instances where there is no metadata or raw data available for any domain specific market. For those cases, we use our expertise to forecast and estimate the market size in order to generate comprehensive data sets. Our analyst team adopt a robust research technique in order to produce the estimates:
Data Synthesis: This stage involves the analysis & mapping of all the information obtained from the previous step. It also involves in scrutinizing the data for any discrepancy observed while data gathering related to the market. The data is collected with consideration to the heterogeneity of sources. Robust scientific techniques are in place for synthesizing disparate data sets and provide the essential contextual information that can orient market strategies. The Brainy Insights has extensive experience in data synthesis where the data passes through various stages:


Market Deduction & Formulation: The final stage comprises of assigning data points at appropriate market spaces so as to deduce feasible conclusions. Analyst perspective & subject matter expert based holistic form of market sizing coupled with industry analysis also plays a crucial role in this stage.
This stage involves in finalization of the market size and numbers that we have collected from data integration step. With data interpolation, it is made sure that there is no gap in the market data. Successful trend analysis is done by our analysts using extrapolation techniques, which provide the best possible forecasts for the market.
Data Validation & Market Feedback: Validation is the most important step in the process. Validation & re-validation via an intricately designed process helps us finalize data-points to be used for final calculations.

The Brainy Insights interacts with leading companies and experts of the concerned domain to develop the analyst team’s market understanding and expertise. It improves and substantiates every single data presented in the market reports. The data validation interview and discussion panels are typically composed of the most experienced industry members. The participants include, however, are not limited to:
Moreover, we always validate our data and findings through primary respondents from all the major regions we are working on.


Free Customization
Fortune 500 Clients
Free Yearly Update On Purchase Of Multi/Corporate License
Companies Served Till Date