- +1-315-215-1633
- sales@thebrainyinsights.com

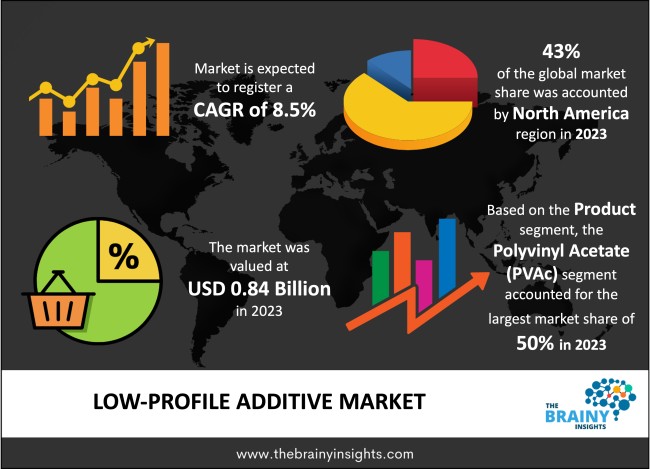
The global Low-Profile Additive market was valued at USD 0.84 billion in 2023 and growing at a CAGR of 8.5% from 2024 to 2033. The market is expected to reach USD 1.90 billion by 2033. Rapidly growing demand in the Automobile industry and technological Advancements in the Low-Profile Additive Market will potentially drive the growth of the Low-Profile Additive Market. Whereas, rapidly growing demand for Advanced Molecules and strategic initiatives by the private players may drive the growth of the Low-Profile Additive Market in the period forecasted.
Low profile additives are polymers incorporated into composites during the production process to stabilize the structure and improve the finish. They enhance surface and texture capabilities and prevent structural deformation as composites contract during polymerization. Materials such as polyester, polymethyl methacrylate, polyurethanes, polyesters, and polyvinyl acetate are commonly used to manufacture low profile additives. These additives find applications in various industries including transportation, sanitary appliances, business machines, electrical components, and more.
Get an overview of this study by requesting a free sample
Rapidly growing demand in the Automobile industry– The increasing demand within the automobile industry is a key driver behind the growth of the low-profile additive market. These additives play a vital role in manufacturing composite materials, which are seeing greater adoption in automotive applications due to their strength and lightweight characteristics.
Increasing Raw Material Prices– The surge in raw material prices presents manufacturers of low-profile additives with heightened production expenses. These encompass various costs such as procurement of raw materials, transportation, processing, and quality control measures. These elevated expenditures can directly erode manufacturers' profit margins, especially if they encounter difficulties passing on the increased costs to consumers amidst competitive market conditions.
Rapidly growing demand for Advanced Molecules- As demand rises for advanced molecules, manufacturers in the low-profile additive market are prompted to broaden and enrich their product offerings. Through the creation of inventive additives boasting upgraded properties and functionalities—like heightened compatibility with diverse resins or superior performance attributes—these manufacturers can effectively address the changing requirements across various industries, meeting the dynamic needs of their clientele.
The regions analyzed for the market include North America, Europe, South America, Asia Pacific, the Middle East, and Africa. North America emerged as the largest global Low-Profile Additive market, accounting for 43% of the total market. Owing to the increased adoption of fiber-reinforced plastics. Increased demand of the Additives in the Automobile Segment in the market. Whereas Asia Pacific exhibits the highest growth rate in the market owing to rapidly growing strategic initiatives by the private players in the region.
North America Region Low-Profile Additive Market Share in 2023 - 43%
www.thebrainyinsights.com
Check the geographical analysis of this market by requesting a free sample
Polyvinyl Acetate (PVAc) has dominated the market accounting for 50% of the total market in the year 2023. Owing to rapid technological advances and increasing demand for Polyvinyl Acetate (PVAc) in electrical and electronic industries in the global market. Whereas, Polymethyl Methacrylate is expected to provide a lucrative growth rate in the future, owing to its UV resistant properties, and light emitting transmission
Shrink & Bulk Molding Compounds (SMC/BMC) have dominated the Low-Profile Additive market. Thereby acquiring 53% in the year 2023. Owing to rapidly growing automobile industry in the global market. Resin Transfer Molding happen to be the fastest-growing segment within the market. Owing to its low cost in the market.
| Attribute | Description |
|---|---|
| Market Size | Revenue (USD Billion) |
| Market size value in 2023 | USD 0.84 Billion |
| Market size value in 2033 | USD 1.90 Billion |
| CAGR (2024 to 2033) | 8.5% |
| Historical data | 2020-2022 |
| Base Year | 2023 |
| Forecast | 2024-2033 |
| Region | The regions analyzed for the market are Asia Pacific, Europe, South America, North America, and Middle East & Africa. Furthermore, the regions are further analyzed at the country level. |
| Segments | Product, Application |
As per The Brainy Insights, the size of the low-profile additive market was valued at USD 0.84 billion in 2023 to USD 1.90 billion by 2033.
The global low-profile additive market is growing at a CAGR of 8.5% during the forecast period 2024-2033.
The North America region emerged as the largest market for the low-profile additive.
The rapidly growing demand in the automobile industry will influence the market's growth.
1. Introduction
1.1. Objectives of the Study
1.2. Market Definition
1.3. Research Scope
1.4. Currency
1.5. Key Target Audience
2. Research Methodology and Assumptions
3. Executive Summary
4. Premium Insights
4.1. Porter’s Five Forces Analysis
4.2. Value Chain Analysis
4.3. Top Investment Pockets
4.3.1. Market Attractiveness Analysis by Product
4.3.2. Market Attractiveness Analysis by Application
4.3.3. Market Attractiveness Analysis by Region
4.4. Industry Trends
5. Market Dynamics
5.1. Market Evaluation
5.2. Drivers
5.2.1. Rapidly growing demand in the Automobile industry
5.2.2. Technological Advancements in the Low-Profile Additive Market
5.3. Restraints
5.3.1. Increasing Raw Material Prices
5.4. Opportunities
5.4.1. Rapidly growing demand for Advanced Molecules
5.4.2. Strategic initiatives by the private players
5.5. Challenges
5.5.1. Increased competition between private players
6. Global Low-Profile Additive Market Analysis and Forecast, By Product
6.1. Segment Overview
6.2. Polyvinyl Acetate (PVAc)
6.3. Polymethyl Methacrylate (PMMA)
6.4. Polystyrene (PS)
6.5. Polyurethane (PU)
6.6. High-density Polyethylene (HDPE)
7. Global Low-Profile Additive Market Analysis and Forecast, By Application
7.1. Segment Overview
7.2. Shrink & Bulk Molding Compounds (SMC/BMC)
7.3. Resin Transfer Molding
7.4. Pultrusion
7.5. Others
8. Global Low-Profile Additive Market Analysis and Forecast, By Regional Analysis
8.1. Segment Overview
8.2. North America
8.2.1. U.S.
8.2.2. Canada
8.2.3. Mexico
8.3. Europe
8.3.1. Germany
8.3.2. France
8.3.3. U.K.
8.3.4. Italy
8.3.5. Spain
8.4. Asia-Pacific
8.4.1. Japan
8.4.2. China
8.4.3. India
8.5. South America
8.5.1. Brazil
8.6. Middle East and Africa
8.6.1. UAE
8.6.2. South Africa
9. Global Low-Profile Additive Market-Competitive Landscape
9.1. Overview
9.2. Market Share of Key Players in Global Low-Profile Additive Market
9.2.1. Global Company Market Share
9.2.2. North America Company Market Share
9.2.3. Europe Company Market Share
9.2.4. APAC Company Market Share
9.3. Competitive Situations and Trends
9.3.1. Product Launches and Developments
9.3.2. Partnerships, Collaborations, and Agreements
9.3.3. Mergers & Acquisitions
9.3.4. Expansions
10. Company Profiles
10.1. Wacker Chemie AG
10.1.1. Business Overview
10.1.2. Company Snapshot
10.1.3. Company Market Share Analysis
10.1.4. Company Product Portfolio
10.1.5. Recent Developments
10.1.6. SWOT Analysis
10.2. INEOS Group Holdings S.A.
10.2.1. Business Overview
10.2.2. Company Snapshot
10.2.3. Company Market Share Analysis
10.2.4. Company Product Portfolio
10.2.5. Recent Developments
10.2.6. SWOT Analysis
10.3. BASF SE
10.3.1. Business Overview
10.3.2. Company Snapshot
10.3.3. Company Market Share Analysis
10.3.4. Company Product Portfolio
10.3.5. Recent Developments
10.3.6. SWOT Analysis
10.4. LyondellBasell Industries Holdings B.V.
10.4.1. Business Overview
10.4.2. Company Snapshot
10.4.3. Company Market Share Analysis
10.4.4. Company Product Portfolio
10.4.5. Recent Developments
10.4.6. SWOT Analysis
10.5. Ashland Inc
10.5.1. Business Overview
10.5.2. Company Snapshot
10.5.3. Company Market Share Analysis
10.5.4. Company Product Portfolio
10.5.5. Recent Developments
10.5.6. SWOT Analysis
10.6. Arkema S.A.
10.6.1. Business Overview
10.6.2. Company Snapshot
10.6.3. Company Market Share Analysis
10.6.4. Company Product Portfolio
10.6.5. Recent Developments
10.6.6. SWOT Analysis
10.7. Evonik Industries AG (RAG-Stiftung)
10.7.1. Business Overview
10.7.2. Company Snapshot
10.7.3. Company Market Share Analysis
10.7.4. Company Product Portfolio
10.7.5. Recent Developments
10.7.6. SWOT Analysis
10.8. Taak Resin Co
10.8.1. Business Overview
10.8.2. Company Snapshot
10.8.3. Company Market Share Analysis
10.8.4. Company Product Portfolio
10.8.5. Recent Developments
10.8.6. SWOT Analysis
10.9. AOC LLC
10.9.1. Business Overview
10.9.2. Company Snapshot
10.9.3. Company Market Share Analysis
10.9.4. Company Product Portfolio
10.9.5. Recent Developments
10.9.6. SWOT Analysis
10.10. Synthomer PLC
10.10.1. Business Overview
10.10.2. Company Snapshot
10.10.3. Company Market Share Analysis
10.10.4. Company Product Portfolio
10.10.5. Recent Developments
10.10.6. SWOT Analysis
List of Table
1. Global Low-Profile Additive Market, By Product, 2020-2033 (USD Billion)
2. Global Polyvinyl Acetate (PVAc), Low-Profile Additive Market, By Region, 2020-2033 (USD Billion)
3. Global Polymethyl Methacrylate (PMMA), Low-Profile Additive Market, By Region, 2020-2033 (USD Billion)
4. Global Polystyrene (PS), Low-Profile Additive Market, By Region, 2020-2033 (USD Billion)
5. Global Polyurethane (PU), Low-Profile Additive Market, By Region, 2020-2033 (USD Billion)
6. Global High-density Polyethylene (HDPE), Low-Profile Additive Market, By Region, 2020-2033 (USD Billion)
7. Global Low-Profile Additive Market, By Application, 2020-2033 (USD Billion)
8. Global Shrink & Bulk Molding Compounds (SMC/BMC), Low-Profile Additive Market, By Region, 2020-2033 (USD Billion)
9. Global Resin Transfer Molding, Low-Profile Additive Market, By Region, 2020-2033 (USD Billion)
10. Global Pultrusion, Low-Profile Additive Market, By Region, 2020-2033 (USD Billion)
11. Global Others, Low-Profile Additive Market, By Region, 2020-2033 (USD Billion)
12. Global Low-Profile Additive Market, By Region, 2020-2033 (USD Billion)
13. North America Low-Profile Additive Market, By Product, 2020-2033 (USD Billion)
14. North America Low-Profile Additive Market, By Application, 2020-2033 (USD Billion)
15. U.S. Low-Profile Additive Market, By Product, 2020-2033 (USD Billion)
16. U.S. Low-Profile Additive Market, By Application, 2020-2033 (USD Billion)
17. Canada Low-Profile Additive Market, By Product, 2020-2033 (USD Billion)
18. Canada Low-Profile Additive Market, By Application, 2020-2033 (USD Billion)
19. Mexico Low-Profile Additive Market, By Product, 2020-2033 (USD Billion)
20. Mexico Low-Profile Additive Market, By Application, 2020-2033 (USD Billion)
21. Europe Low-Profile Additive Market, By Product, 2020-2033 (USD Billion)
22. Europe Low-Profile Additive Market, By Application, 2020-2033 (USD Billion)
23. Germany Low-Profile Additive Market, By Product, 2020-2033 (USD Billion)
24. Germany Low-Profile Additive Market, By Application, 2020-2033 (USD Billion)
25. France Low-Profile Additive Market, By Product, 2020-2033 (USD Billion)
26. France Low-Profile Additive Market, By Application, 2020-2033 (USD Billion)
27. U.K. Low-Profile Additive Market, By Product, 2020-2033 (USD Billion)
28. U.K. Low-Profile Additive Market, By Application, 2020-2033 (USD Billion)
29. Italy Low-Profile Additive Market, By Product, 2020-2033 (USD Billion)
30. Italy Low-Profile Additive Market, By Application, 2020-2033 (USD Billion)
31. Spain Low-Profile Additive Market, By Product, 2020-2033 (USD Billion)
32. Spain Low-Profile Additive Market, By Application, 2020-2033 (USD Billion)
33. Asia Pacific Low-Profile Additive Market, By Product, 2020-2033 (USD Billion)
34. Asia Pacific Low-Profile Additive Market, By Application, 2020-2033 (USD Billion)
35. Japan Low-Profile Additive Market, By Product, 2020-2033 (USD Billion)
36. Japan Low-Profile Additive Market, By Application, 2020-2033 (USD Billion)
37. China Low-Profile Additive Market, By Product, 2020-2033 (USD Billion)
38. China Low-Profile Additive Market, By Application, 2020-2033 (USD Billion)
39. India Low-Profile Additive Market, By Product, 2020-2033 (USD Billion)
40. India Low-Profile Additive Market, By Application, 2020-2033 (USD Billion)
41. South America Low-Profile Additive Market, By Product, 2020-2033 (USD Billion)
42. South America Low-Profile Additive Market, By Application, 2020-2033 (USD Billion)
43. Brazil Low-Profile Additive Market, By Product, 2020-2033 (USD Billion)
44. Brazil Low-Profile Additive Market, By Application, 2020-2033 (USD Billion)
45. Middle East and Africa Low-Profile Additive Market, By Product, 2020-2033 (USD Billion)
46. Middle East and Africa Low-Profile Additive Market, By Application, 2020-2033 (USD Billion)
47. UAE Low-Profile Additive Market, By Product, 2020-2033 (USD Billion)
48. UAE Low-Profile Additive Market, By Application, 2020-2033 (USD Billion)
49. South Africa Low-Profile Additive Market, By Product, 2020-2033 (USD Billion)
50. South Africa Low-Profile Additive Market, By Application, 2020-2033 (USD Billion)
List of Figures
1. Global Low-Profile Additive Market Segmentation
2. Global Low-Profile Additive Market: Research Methodology
3. Market Size Estimation Methodology: Bottom-Up Approach
4. Market Size Estimation Methodology: Top-Down Approach
5. Data Triangulation
6. Porter’s Five Forces Analysis
7. Value Chain Analysis
8. Global Low-Profile Additive Market Attractiveness Analysis by Product
9. Global Low-Profile Additive Market Attractiveness Analysis by Application
10. Global Low-Profile Additive Market Attractiveness Analysis by Region
11. Global Low-Profile Additive Market: Dynamics
12. Global Low-Profile Additive Market Share by Product (2023 & 2033)
13. Global Low-Profile Additive Market Share by Application (2023 & 2033)
14. Global Low-Profile Additive Market Share by Regions (2023 & 2033)
15. Global Low-Profile Additive Market Share by Company (2023)
This study forecasts revenue at global, regional, and country levels from 2020 to 2033. The Brainy Insights has segmented the global low-profile additive market based on below-mentioned segments:
Global Low-Profile Additive Market by Product:
Global Low-Profile Additive Market by Application:
Global Low-Profile Additive Market by Region:
Research has its special purpose to undertake marketing efficiently. In this competitive scenario, businesses need information across all industry verticals; the information about customer wants, market demand, competition, industry trends, distribution channels etc. This information needs to be updated regularly because businesses operate in a dynamic environment. Our organization, The Brainy Insights incorporates scientific and systematic research procedures in order to get proper market insights and industry analysis for overall business success. The analysis consists of studying the market from a miniscule level wherein we implement statistical tools which helps us in examining the data with accuracy and precision.
Our research reports feature both; quantitative and qualitative aspects for any market. Qualitative information for any market research process are fundamental because they reveal the customer needs and wants, usage and consumption for any product/service related to a specific industry. This in turn aids the marketers/investors in knowing certain perceptions of the customers. Qualitative research can enlighten about the different product concepts and designs along with unique service offering that in turn, helps define marketing problems and generate opportunities. On the other hand, quantitative research engages with the data collection process through interviews, e-mail interactions, surveys and pilot studies. Quantitative aspects for the market research are useful to validate the hypotheses generated during qualitative research method, explore empirical patterns in the data with the help of statistical tools, and finally make the market estimations.
The Brainy Insights offers comprehensive research and analysis, based on a wide assortment of factual insights gained through interviews with CXOs and global experts and secondary data from reliable sources. Our analysts and industry specialist assume vital roles in building up statistical tools and analysis models, which are used to analyse the data and arrive at accurate insights with exceedingly informative research discoveries. The data provided by our organization have proven precious to a diverse range of companies, facilitating them to address issues such as determining which products/services are the most appealing, whether or not customers use the product in the manner anticipated, the purchasing intentions of the market and many others.
Our research methodology encompasses an idyllic combination of primary and secondary initiatives. Key phases involved in this process are listed below:

The phase involves the gathering and collecting of market data and its related information with the help of different sources & research procedures.

The data procurement stage involves in data gathering and collecting through various data sources.
This stage involves in extensive research. These data sources includes:
Purchased Database: Purchased databases play a crucial role in estimating the market sizes irrespective of the domain. Our purchased database includes:
Primary Research: The Brainy Insights interacts with leading companies and experts of the concerned domain to develop the analyst team’s market understanding and expertise. It improves and substantiates every single data presented in the market reports. Primary research mainly involves in telephonic interviews, E-mail interactions and face-to-face interviews with the raw material providers, manufacturers/producers, distributors, & independent consultants. The interviews that we conduct provides valuable data on market size and industry growth trends prevailing in the market. Our organization also conducts surveys with the various industry experts in order to gain overall insights of the industry/market. For instance, in healthcare industry we conduct surveys with the pharmacists, doctors, surgeons and nurses in order to gain insights and key information of a medical product/device/equipment which the customers are going to usage. Surveys are conducted in the form of questionnaire designed by our own analyst team. Surveys plays an important role in primary research because surveys helps us to identify the key target audiences of the market. Additionally, surveys helps to identify the key target audience engaged with the market. Our survey team conducts the survey by targeting the key audience, thus gaining insights from them. Based on the perspectives of the customers, this information is utilized to formulate market strategies. Moreover, market surveys helps us to understand the current competitive situation of the industry. To be precise, our survey process typically involve with the 360 analysis of the market. This analytical process begins by identifying the prospective customers for a product or service related to the market/industry to obtain data on how a product/service could fit into customers’ lives.

Secondary Research: The secondary data sources includes information published by the on-profit organizations such as World bank, WHO, company fillings, investor presentations, annual reports, national government documents, statistical databases, blogs, articles, white papers and others. From the annual report, we analyse a company’s revenue to understand the key segment and market share of that organization in a particular region. We analyse the company websites and adopt the product mapping technique which is important for deriving the segment revenue. In the product mapping method, we select and categorize the products offered by the companies catering to domain specific market, deduce the product revenue for each of the companies so as to get overall estimation of the market size. We also source data and analyses trends based on information received from supply side and demand side intermediaries in the value chain. The supply side denotes the data gathered from supplier, distributor, wholesaler and the demand side illustrates the data gathered from the end customers for respective market domain.

The supply side for a domain specific market is analysed by:
The demand side for the market is estimated through:
In-house Library: Apart from these third-party sources, we have our in-house library of qualitative and quantitative information. Our in-house database includes market data for various industry and domains. These data are updated on regular basis as per the changing market scenario. Our library includes, historic databases, internal audit reports and archives.
Sometimes there are instances where there is no metadata or raw data available for any domain specific market. For those cases, we use our expertise to forecast and estimate the market size in order to generate comprehensive data sets. Our analyst team adopt a robust research technique in order to produce the estimates:
Data Synthesis: This stage involves the analysis & mapping of all the information obtained from the previous step. It also involves in scrutinizing the data for any discrepancy observed while data gathering related to the market. The data is collected with consideration to the heterogeneity of sources. Robust scientific techniques are in place for synthesizing disparate data sets and provide the essential contextual information that can orient market strategies. The Brainy Insights has extensive experience in data synthesis where the data passes through various stages:


Market Deduction & Formulation: The final stage comprises of assigning data points at appropriate market spaces so as to deduce feasible conclusions. Analyst perspective & subject matter expert based holistic form of market sizing coupled with industry analysis also plays a crucial role in this stage.
This stage involves in finalization of the market size and numbers that we have collected from data integration step. With data interpolation, it is made sure that there is no gap in the market data. Successful trend analysis is done by our analysts using extrapolation techniques, which provide the best possible forecasts for the market.
Data Validation & Market Feedback: Validation is the most important step in the process. Validation & re-validation via an intricately designed process helps us finalize data-points to be used for final calculations.

The Brainy Insights interacts with leading companies and experts of the concerned domain to develop the analyst team’s market understanding and expertise. It improves and substantiates every single data presented in the market reports. The data validation interview and discussion panels are typically composed of the most experienced industry members. The participants include, however, are not limited to:
Moreover, we always validate our data and findings through primary respondents from all the major regions we are working on.


Free Customization
Fortune 500 Clients
Free Yearly Update On Purchase Of Multi/Corporate License
Companies Served Till Date