- +1-315-215-1633
- sales@thebrainyinsights.com

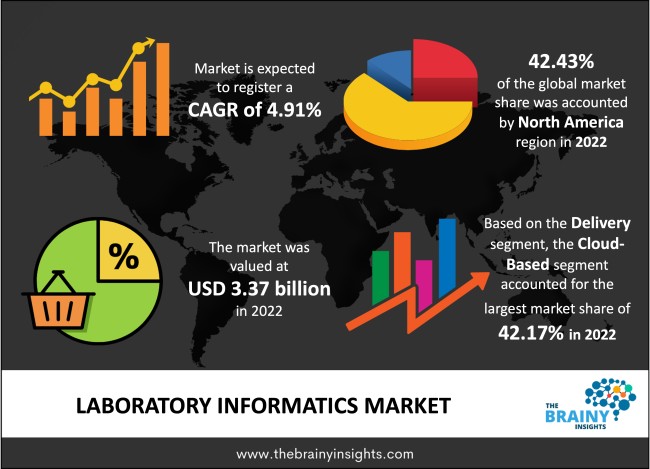
The global laboratory informatics market was valued at USD 3.37 Billion in 2022 and growing at a CAGR of 4.91% from 2023 to 2032. The market is expected to reach USD 5.44 Billion by 2032. There is a surge in the number of organizations in the laboratory informatics sector, which has increased the competition and propelled innovation. Cloud-based solutions are becoming common for laboratory informatics software as they offer scalability, accessibility and enhanced flexibility for users. Laboratory informatics solutions are growing in demand as they decrease manual effort and thus reduce the labour court, cost of error and throughput time. It gives paper information management with proper data analytics. It helps in improving data traceability, security, accessibility and sharing. It streamlines the processes that improve quality management and follows all the regulatory requirements. It helps in controlling all the business processes and decision-support.
Laboratory informatics is focused on optimizing the laboratory operations using the information technology. It helps in handling the laboratory data and information. It generally consists of 4 major multi-user systems, which include electronic laboratory notebooks (ELNs), laboratory information management systems (LIMS), laboratory execution systems (LES) and scientific data management systems (SDMS). The growing demand for laboratory automation is fueling the demand for laboratory informatics. In recent years, laboratory data has increased, leading to technological advancements in genetic testing practices and molecular genomics. There is a growing need for life science organizations to meet regulatory requirements, driving the need for laboratory information management systems (LIMS) as they help understand and fulfil regulatory obligations. There is a paradigm shift in the healthcare sector from volume to value-based model, which has changed the market dynamics. The increased volume and complexity of the clinical data fuel the need for advanced high throughput screening (HTS) and ultra-high throughput screening (UHTS) solutions that provide meaningful insights. Moreover, there is a growing adoption of lab automation in contract manufacturing and research organizations, propelling the commercialization of the laboratory informatics market.
Get an overview of this study by requesting a free sample
Growing demand in the healthcare sector– It has been observed that the leading manufacturers are shifting from paper-based processes to electronically executed manufacturing processes to enhance production quality and efficiency. The cloud-based solutions improve the configurable abilities for particular lab requirements. It helps in the reduction of costs, which is propelling the growth of the market. The surge in the volume of data and the real-time integration and collection are boosting laboratory informatics solutions in the healthcare sector. Advancements in sequencing and data analysis technology lead to faster result generation in real-time, driving the market. Also, healthcare informatics are helping in the formulation of business strategies. All these factors are propelling the growth of the laboratory informatics market.
Lack of proper standards– The laboratory informatics sector is growing; however, many problems are acting as restraints for the market, like a lack of integration standards for laboratory informatics and a shortage of skilled professionals. Moreover, there is a high cost related to both maintenance and servicing. All these factors are acting as a restraint to the market.
The surge in demand for cloud-based laboratory informatics– The advent of cloud-based services using the internet has led to a substantial advancement in the laboratory informatics market. The advancement in virtualization and surge in the accessibility of high-speed internet are leading to faster innovation at low cost. The organizations only have to pay for software subscriptions in cloud-based solutions rather than buying full licenses. It leads to a reduction in the costs associated with in-house deployment. Also, cloud-based laboratory informatics solutions don’t need any upfront cost for hardware. It decreases the burden on healthcare systems with minimum IT staff and offers fast and secure data transfer in the organization. All these factors propel the laboratory informatics market in the forecasting period.
The regions analyzed for the market include North America, Europe, South America, Asia Pacific, the Middle East, and Africa. North America emerged as the largest market for the global laboratory informatics market, with a 42.43% share of the market revenue in 2022. It is attributed to supportive government policies that promote the adoption of LIMS. Moreover, the region has better reimbursement policies and well-established healthcare organizations. The US holds a significant share of the North American region market because of the growing adoption and investment in digital healthcare. Also, in the US, the senior population is growing quickly, and are prone to several diseases. There is also a surge in lifestyle disorders, propelling the need for laboratory tests. These factors are eventually driving laboratory informatics in North America.
North America Region Laboratory Informatics Market Share in 2022 - 42.43%
www.thebrainyinsights.com
Check the geographical analysis of this market by requesting a free sample
The product segment is divided into laboratory information management systems (LIMS), electronic lab notebooks (ELN), scientific data management systems (SDMS), laboratory execution systems (LES), electronic data capture (EDC) & clinical data management systems (CDMS), chromatography data systems (CDS) and enterprise content management (ECM). The laboratory information management systems (LIMS) segment dominated the market, with a market share of around 48.45% in 2022. It is due to the associated benefits like data tracking and management with fewer errors. Also, there is more demand for fully integrated LIMS platforms in life sciences and research sectors as it decreases errors in data management and qualitative study of research information. LIMS helps in streamlining the laboratory operations.
The delivery segment is divided into on-premise, web-hosted and cloud-based. The cloud-based segment dominated the market, with a market share of around 42.17% in 2022. Cloud-based technology stores large amounts of data remotely; hence, free space on devices and data can be retrieved based on client requirements. It helps the laboratories streamline their operations and save resources, which leads to maximum user satisfaction. It is crucial in diagnostics, clinical, testing and research laboratories worldwide.
The component segment is divided into software and services. The services segment dominated the market, with a market share of around 57.35% in 2022. This market share is attributed to the surge in the outsourcing of LIMS solutions. These services help the workflows and processes based on the requirements of industries.
The end user segment is divided into life sciences, chemical sector, CROs, environmental testing labs, F&B and agriculture and others. The life sciences segment dominated the market, with a market share of around 27.89% in 2022. The life sciences sector includes molecular diagnostics and clinical research laboratories, biobanks, contract services organizations and academic research institutes, among others. The demand for laboratory informatics is growing in the life sciences sector to develop innovative products. It is needed for the improvement of product quality and better operational efficiency.
| Attribute | Description |
|---|---|
| Market Size | Revenue (USD Billion) |
| Market size value in 2022 | USD 3.37 Billion |
| Market size value in 2032 | USD 5.44 Billion |
| CAGR (2023 to 2032) | 4.91% |
| Historical data | 2019-2021 |
| Base Year | 2022 |
| Forecast | 2023-2032 |
| Region | The regions analyzed for the market are Asia Pacific, Europe, South America, North America, and Middle East & Africa. Furthermore, the regions are further analyzed at the country level. |
| Segments | Product, Delivery, Component and End User |
North America region emerged as the largest market for the laboratory informatics.
The market's growth will be influenced by growing demand in the healthcare sector.
Lack of proper standards could hamper the market growth.
The surge in demand for cloud-based laboratory informatics will provide huge opportunities to the market.
1. Introduction
1.1. Objectives of the Study
1.2. Market Definition
1.3. Research Scope
1.4. Currency
1.5. Key Target Audience
2. Research Methodology and Assumptions
3. Executive Summary
4. Premium Insights
4.1. Porter’s Five Forces Analysis
4.2. Value Chain Analysis
4.3. Top Investment Pockets
4.3.1. Market Attractiveness Analysis By Product
4.3.2. Market Attractiveness Analysis By Delivery
4.3.3. Market Attractiveness Analysis By Component
4.3.4. Market Attractiveness Analysis By End User
4.3.5. Market Attractiveness Analysis By Region
4.4. Industry Trends
5. Market Dynamics
5.1. Market Evaluation
5.2. Drivers
5.2.1. Growing demand in the healthcare sector
5.3. Restraints
5.3.1. Lack of proper standards
5.4. Opportunities
5.4.1. The surge in demand for cloud-based laboratory informatics
5.5. Challenges
5.5.1. Economic slowdown
6. Global Laboratory Informatics Market Analysis and Forecast, By Product
6.1. Segment Overview
6.2. Laboratory Information Management Systems (LIMS)
6.3. Electronic Lab Notebooks (ELN)
6.4. Scientific Data Management Systems (SDMS)
6.5. Laboratory Execution Systems (LES)
6.6. Electronic Data Capture (EDC) & Clinical Data Management Systems (CDMS)
6.7. Chromatography Data Systems (CDS)
6.8. Enterprise Content Management (ECM)
7. Global Laboratory Informatics Market Analysis and Forecast, By Delivery
7.1. Segment Overview
7.2. On-premise
7.3. Web-hosted
7.4. Cloud-based
8. Global Laboratory Informatics Market Analysis and Forecast, By Component
8.1. Segment Overview
8.2. Software
8.3. Services
9. Global Laboratory Informatics Market Analysis and Forecast, By End User
9.1. Segment Overview
9.2. Life sciences
9.3. Chemical Sector
9.4. CROs
9.5. Environmental Testing Labs
9.6. F&B and Agriculture
9.7. Others
10. Global Laboratory Informatics Market Analysis and Forecast, By Regional Analysis
10.1. Segment Overview
10.2. North America
10.2.1. U.S.
10.2.2. Canada
10.2.3. Mexico
10.3. Europe
10.3.1. Germany
10.3.2. France
10.3.3. U.K.
10.3.4. Italy
10.3.5. Spain
10.4. Asia-Pacific
10.4.1. Japan
10.4.2. China
10.4.3. India
10.5. South America
10.5.1. Brazil
10.6. Middle East and Africa
10.6.1. UAE
10.6.2. South Africa
11. Global Laboratory Informatics Market-Competitive Landscape
11.1. Overview
11.2. Market Share of Key Players in Global Laboratory Informatics Market
11.2.1. Global Company Market Share
11.2.2. North America Company Market Share
11.2.3. Europe Company Market Share
11.2.4. APAC Company Market Share
11.3. Competitive Situations and Trends
11.3.1. Product Launches and Developments
11.3.2. Partnerships, Collaborations, and Agreements
11.3.3. Mergers & Acquisitions
11.3.4. Expansions
12. Company Profiles
12.1. Agilent Technologies
12.1.1. Business Overview
12.1.2. Company Snapshot
12.1.3. Company Market Share Analysis
12.1.4. Company Product Portfolio
12.1.5. Recent Developments
12.1.6. SWOT Analysis
12.2. Abbott Informatics
12.2.1. Business Overview
12.2.2. Company Snapshot
12.2.3. Company Market Share Analysis
12.2.4. Company Product Portfolio
12.2.5. Recent Developments
12.2.6. SWOT Analysis
12.3. McKesson Corporation
12.3.1. Business Overview
12.3.2. Company Snapshot
12.3.3. Company Market Share Analysis
12.3.4. Company Product Portfolio
12.3.5. Recent Developments
12.3.6. SWOT Analysis
12.4. PerkinElmer, Inc.
12.4.1. Business Overview
12.4.2. Company Snapshot
12.4.3. Company Market Share Analysis
12.4.4. Company Product Portfolio
12.4.5. Recent Developments
12.4.6. SWOT Analysis
12.5. Thermo Fisher Scientific, Inc.
12.5.1. Business Overview
12.5.2. Company Snapshot
12.5.3. Company Market Share Analysis
12.5.4. Company Product Portfolio
12.5.5. Recent Developments
12.5.6. SWOT Analysis
12.6. LabVantage Solutions, Inc.
12.6.1. Business Overview
12.6.2. Company Snapshot
12.6.3. Company Market Share Analysis
12.6.4. Company Product Portfolio
12.6.5. Recent Developments
12.6.6. SWOT Analysis
12.7. ID Business Solutions Ltd.
12.7.1. Business Overview
12.7.2. Company Snapshot
12.7.3. Company Market Share Analysis
12.7.4. Company Product Portfolio
12.7.5. Recent Developments
12.7.6. SWOT Analysis
12.8. LabLynx, Inc.
12.8.1. Business Overview
12.8.2. Company Snapshot
12.8.3. Company Market Share Analysis
12.8.4. Company Product Portfolio
12.8.5. Recent Developments
12.8.6. SWOT Analysis
12.9. Waters Corporation
12.9.1. Business Overview
12.9.2. Company Snapshot
12.9.3. Company Market Share Analysis
12.9.4. Company Product Portfolio
12.9.5. Recent Developments
12.9.6. SWOT Analysis
12.10. LabWare
12.10.1. Business Overview
12.10.2. Company Snapshot
12.10.3. Company Market Share Analysis
12.10.4. Company Product Portfolio
12.10.5. Recent Developments
12.10.6. SWOT Analysis
12.11. Core Informatics
12.11.1. Business Overview
12.11.2. Company Snapshot
12.11.3. Company Market Share Analysis
12.11.4. Company Product Portfolio
12.11.5. Recent Developments
12.11.6. SWOT Analysis
List of Table
1. Global Laboratory Informatics Market, By Product, 2019-2032 (USD Billion)
2. Global Laboratory Information Management Systems (LIMS), Laboratory Informatics Market, By Region, 2019-2032 (USD Billion)
3. Global Electronic Lab Notebooks (ELN), Laboratory Informatics Market, By Region, 2019-2032 (USD Billion)
4. Global Scientific Data Management Systems (SDMS), Laboratory Informatics Market, By Region, 2019-2032 (USD Billion)
5. Global Laboratory Execution Systems (LES), Laboratory Informatics Market, By Region, 2019-2032 (USD Billion)
6. Global Electronic Data Capture (EDC) & Clinical Data Management Systems (CDMS), Laboratory Informatics Market, By Region, 2019-2032 (USD Billion)
7. Global Chromatography Data Systems (CDS), Laboratory Informatics Market, By Region, 2019-2032 (USD Billion)
8. Global Enterprise Content Management (ECM), Laboratory Informatics Market, By Region, 2019-2032 (USD Billion)
9. Global Laboratory Informatics Market, By Delivery, 2019-2032 (USD Billion)
10. Global On-premise, Laboratory Informatics Market, By Region, 2019-2032 (USD Billion)
11. Global Web-hosted, Laboratory Informatics Market, By Region, 2019-2032 (USD Billion)
12. Global Cloud-based, Laboratory Informatics Market, By Region, 2019-2032 (USD Billion)
13. Global Laboratory Informatics Market, By Component, 2019-2032 (USD Billion)
14. Global Software, Laboratory Informatics Market, By Region, 2019-2032 (USD Billion)
15. Global Services, Laboratory Informatics Market, By Region, 2019-2032 (USD Billion)
16. Global Laboratory Informatics Market, By End User, 2019-2032 (USD Billion)
17. Global Life sciences, Laboratory Informatics Market, By Region, 2019-2032 (USD Billion)
18. Global Chemical Sector, Laboratory Informatics Market, By Region, 2019-2032 (USD Billion)
19. Global CROs, Laboratory Informatics Market, By Region, 2019-2032 (USD Billion)
20. Global Environmental Testing Labs, Laboratory Informatics Market, By Region, 2019-2032 (USD Billion)
21. Global F&B and Agriculture, Laboratory Informatics Market, By Region, 2019-2032 (USD Billion)
22. Global Others, Laboratory Informatics Market, By Region, 2019-2032 (USD Billion)
23. North America Laboratory Informatics Market, By Product, 2019-2032 (USD Billion)
24. North America Laboratory Informatics Market, By Delivery, 2019-2032 (USD Billion)
25. North America Laboratory Informatics Market, By Component, 2019-2032 (USD Billion)
26. North America Laboratory Informatics Market, By End User, 2019-2032 (USD Billion)
27. U.S. Laboratory Informatics Market, By Product, 2019-2032 (USD Billion)
28. U.S. Laboratory Informatics Market, By Delivery, 2019-2032 (USD Billion)
29. U.S. Laboratory Informatics Market, By Component, 2019-2032 (USD Billion)
30. U.S. Laboratory Informatics Market, By End User, 2019-2032 (USD Billion)
31. Canada Laboratory Informatics Market, By Product, 2019-2032 (USD Billion)
32. Canada Laboratory Informatics Market, By Delivery, 2019-2032 (USD Billion)
33. Canada Laboratory Informatics Market, By Component, 2019-2032 (USD Billion)
34. Canada Laboratory Informatics Market, By End User, 2019-2032 (USD Billion)
35. Mexico Laboratory Informatics Market, By Product, 2019-2032 (USD Billion)
36. Mexico Laboratory Informatics Market, By Delivery, 2019-2032 (USD Billion)
37. Mexico Laboratory Informatics Market, By Component, 2019-2032 (USD Billion)
38. Mexico Laboratory Informatics Market, By End User, 2019-2032 (USD Billion)
39. Europe Laboratory Informatics Market, By Product, 2019-2032 (USD Billion)
40. Europe Laboratory Informatics Market, By Delivery, 2019-2032 (USD Billion)
41. Europe Laboratory Informatics Market, By Component, 2019-2032 (USD Billion)
42. Europe Laboratory Informatics Market, By End User, 2019-2032 (USD Billion)
43. Germany Laboratory Informatics Market, By Product, 2019-2032 (USD Billion)
44. Germany Laboratory Informatics Market, By Delivery, 2019-2032 (USD Billion)
45. Germany Laboratory Informatics Market, By Component, 2019-2032 (USD Billion)
46. Germany Laboratory Informatics Market, By End User, 2019-2032 (USD Billion)
47. France Laboratory Informatics Market, By Product, 2019-2032 (USD Billion)
48. France Laboratory Informatics Market, By Delivery, 2019-2032 (USD Billion)
49. France Laboratory Informatics Market, By Component, 2019-2032 (USD Billion)
50. France Laboratory Informatics Market, By End User, 2019-2032 (USD Billion)
51. U.K. Laboratory Informatics Market, By Product, 2019-2032 (USD Billion)
52. U.K. Laboratory Informatics Market, By Delivery, 2019-2032 (USD Billion)
53. U.K. Laboratory Informatics Market, By Component, 2019-2032 (USD Billion)
54. U.K. Laboratory Informatics Market, By End User, 2019-2032 (USD Billion)
55. Italy Laboratory Informatics Market, By Product, 2019-2032 (USD Billion)
56. Italy Laboratory Informatics Market, By Delivery, 2019-2032 (USD Billion)
57. Italy Laboratory Informatics Market, By Component, 2019-2032 (USD Billion)
58. Italy Laboratory Informatics Market, By End User, 2019-2032 (USD Billion)
59. Spain Laboratory Informatics Market, By Product, 2019-2032 (USD Billion)
60. Spain Laboratory Informatics Market, By Delivery, 2019-2032 (USD Billion)
61. Spain Laboratory Informatics Market, By Component, 2019-2032 (USD Billion)
62. Spain Laboratory Informatics Market, By End User, 2019-2032 (USD Billion)
63. Asia Pacific Laboratory Informatics Market, By Product, 2019-2032 (USD Billion)
64. Asia Pacific Laboratory Informatics Market, By Delivery, 2019-2032 (USD Billion)
65. Asia Pacific Laboratory Informatics Market, By Component, 2019-2032 (USD Billion)
66. Asia Pacific Laboratory Informatics Market, By End User, 2019-2032 (USD Billion)
67. Japan Laboratory Informatics Market, By Product, 2019-2032 (USD Billion)
68. Japan Laboratory Informatics Market, By Delivery, 2019-2032 (USD Billion)
69. Japan Laboratory Informatics Market, By Component, 2019-2032 (USD Billion)
70. Japan Laboratory Informatics Market, By End User, 2019-2032 (USD Billion)
71. China Laboratory Informatics Market, By Product, 2019-2032 (USD Billion)
72. China Laboratory Informatics Market, By Delivery, 2019-2032 (USD Billion)
73. China Laboratory Informatics Market, By Component, 2019-2032 (USD Billion)
74. China Laboratory Informatics Market, By End User, 2019-2032 (USD Billion)
75. India Laboratory Informatics Market, By Product, 2019-2032 (USD Billion)
76. India Laboratory Informatics Market, By Delivery, 2019-2032 (USD Billion)
77. India Laboratory Informatics Market, By Component, 2019-2032 (USD Billion)
78. India Laboratory Informatics Market, By End User, 2019-2032 (USD Billion)
79. South America Laboratory Informatics Market, By Product, 2019-2032 (USD Billion)
80. South America Laboratory Informatics Market, By Delivery, 2019-2032 (USD Billion)
81. South America Laboratory Informatics Market, By Component, 2019-2032 (USD Billion)
82. South America Laboratory Informatics Market, By End User, 2019-2032 (USD Billion)
83. Brazil Laboratory Informatics Market, By Product, 2019-2032 (USD Billion)
84. Brazil Laboratory Informatics Market, By Delivery, 2019-2032 (USD Billion)
85. Brazil Laboratory Informatics Market, By End User, 2019-2032 (USD Billion)
86. Brazil Laboratory Informatics Market, By Component, 2019-2032 (USD Billion)
87. Middle East and Africa Laboratory Informatics Market, By Product, 2019-2032 (USD Billion)
88. Middle East and Africa Laboratory Informatics Market, By Delivery, 2019-2032 (USD Billion)
89. Middle East and Africa Laboratory Informatics Market, By Component, 2019-2032 (USD Billion)
90. Middle East and Africa Laboratory Informatics Market, By End User, 2019-2032 (USD Billion)
91. UAE Laboratory Informatics Market, By Product, 2019-2032 (USD Billion)
92. UAE Laboratory Informatics Market, By Delivery, 2019-2032 (USD Billion)
93. UAE Laboratory Informatics Market, By Component, 2019-2032 (USD Billion)
94. UAE Laboratory Informatics Market, By End User, 2019-2032 (USD Billion)
95. South Africa Laboratory Informatics Market, By Product, 2019-2032 (USD Billion)
96. South Africa Laboratory Informatics Market, By Delivery, 2019-2032 (USD Billion)
97. South Africa Laboratory Informatics Market, By Component, 2019-2032 (USD Billion)
98. South Africa Laboratory Informatics Market, By End User, 2019-2032 (USD Billion)
List of Figures
1. Global Laboratory Informatics Market Segmentation
2. Global Laboratory Informatics Market: Research Methodology
3. Market Size Estimation Methodology: Bottom-Up Approach
4. Market Size Estimation Methodology: Top-Down Approach
5. Data Triangulation
6. Porter’s Five Forces Analysis
7. Value Chain Analysis
8. Global Laboratory Informatics Market Attractiveness Analysis By Product
9. Global Laboratory Informatics Market Attractiveness Analysis By Delivery
10. Global Laboratory Informatics Market Attractiveness Analysis By Component
11. Global Laboratory Informatics Market Attractiveness Analysis By End User
12. Global Laboratory Informatics Market Attractiveness Analysis By Region
13. Global Laboratory Informatics Market: Dynamics
14. Global Laboratory Informatics Market Share By Product (2023 & 2032)
15. Global Laboratory Informatics Market Share By Delivery (2023 & 2032)
16. Global Laboratory Informatics Market Share By Component (2023 & 2032)
17. Global Laboratory Informatics Market Share By End User (2023 & 2032)
18. Global Laboratory Informatics Market Share By Regions (2023 & 2032)
19. Global Laboratory Informatics Market Share By Company (2022)
This study forecasts revenue at global, regional, and country levels from 2019 to 2032. The Brainy Insights has segmented the global laboratory informatics market based on below mentioned segments:
Global Laboratory Informatics Market by Product:
Global Laboratory Informatics Market by Delivery:
Global Laboratory Informatics Market by Component:
Global Laboratory Informatics Market by End User:
Global Laboratory Informatics by Region:
Research has its special purpose to undertake marketing efficiently. In this competitive scenario, businesses need information across all industry verticals; the information about customer wants, market demand, competition, industry trends, distribution channels etc. This information needs to be updated regularly because businesses operate in a dynamic environment. Our organization, The Brainy Insights incorporates scientific and systematic research procedures in order to get proper market insights and industry analysis for overall business success. The analysis consists of studying the market from a miniscule level wherein we implement statistical tools which helps us in examining the data with accuracy and precision.
Our research reports feature both; quantitative and qualitative aspects for any market. Qualitative information for any market research process are fundamental because they reveal the customer needs and wants, usage and consumption for any product/service related to a specific industry. This in turn aids the marketers/investors in knowing certain perceptions of the customers. Qualitative research can enlighten about the different product concepts and designs along with unique service offering that in turn, helps define marketing problems and generate opportunities. On the other hand, quantitative research engages with the data collection process through interviews, e-mail interactions, surveys and pilot studies. Quantitative aspects for the market research are useful to validate the hypotheses generated during qualitative research method, explore empirical patterns in the data with the help of statistical tools, and finally make the market estimations.
The Brainy Insights offers comprehensive research and analysis, based on a wide assortment of factual insights gained through interviews with CXOs and global experts and secondary data from reliable sources. Our analysts and industry specialist assume vital roles in building up statistical tools and analysis models, which are used to analyse the data and arrive at accurate insights with exceedingly informative research discoveries. The data provided by our organization have proven precious to a diverse range of companies, facilitating them to address issues such as determining which products/services are the most appealing, whether or not customers use the product in the manner anticipated, the purchasing intentions of the market and many others.
Our research methodology encompasses an idyllic combination of primary and secondary initiatives. Key phases involved in this process are listed below:

The phase involves the gathering and collecting of market data and its related information with the help of different sources & research procedures.

The data procurement stage involves in data gathering and collecting through various data sources.
This stage involves in extensive research. These data sources includes:
Purchased Database: Purchased databases play a crucial role in estimating the market sizes irrespective of the domain. Our purchased database includes:
Primary Research: The Brainy Insights interacts with leading companies and experts of the concerned domain to develop the analyst team’s market understanding and expertise. It improves and substantiates every single data presented in the market reports. Primary research mainly involves in telephonic interviews, E-mail interactions and face-to-face interviews with the raw material providers, manufacturers/producers, distributors, & independent consultants. The interviews that we conduct provides valuable data on market size and industry growth trends prevailing in the market. Our organization also conducts surveys with the various industry experts in order to gain overall insights of the industry/market. For instance, in healthcare industry we conduct surveys with the pharmacists, doctors, surgeons and nurses in order to gain insights and key information of a medical product/device/equipment which the customers are going to usage. Surveys are conducted in the form of questionnaire designed by our own analyst team. Surveys plays an important role in primary research because surveys helps us to identify the key target audiences of the market. Additionally, surveys helps to identify the key target audience engaged with the market. Our survey team conducts the survey by targeting the key audience, thus gaining insights from them. Based on the perspectives of the customers, this information is utilized to formulate market strategies. Moreover, market surveys helps us to understand the current competitive situation of the industry. To be precise, our survey process typically involve with the 360 analysis of the market. This analytical process begins by identifying the prospective customers for a product or service related to the market/industry to obtain data on how a product/service could fit into customers’ lives.

Secondary Research: The secondary data sources includes information published by the on-profit organizations such as World bank, WHO, company fillings, investor presentations, annual reports, national government documents, statistical databases, blogs, articles, white papers and others. From the annual report, we analyse a company’s revenue to understand the key segment and market share of that organization in a particular region. We analyse the company websites and adopt the product mapping technique which is important for deriving the segment revenue. In the product mapping method, we select and categorize the products offered by the companies catering to domain specific market, deduce the product revenue for each of the companies so as to get overall estimation of the market size. We also source data and analyses trends based on information received from supply side and demand side intermediaries in the value chain. The supply side denotes the data gathered from supplier, distributor, wholesaler and the demand side illustrates the data gathered from the end customers for respective market domain.

The supply side for a domain specific market is analysed by:
The demand side for the market is estimated through:
In-house Library: Apart from these third-party sources, we have our in-house library of qualitative and quantitative information. Our in-house database includes market data for various industry and domains. These data are updated on regular basis as per the changing market scenario. Our library includes, historic databases, internal audit reports and archives.
Sometimes there are instances where there is no metadata or raw data available for any domain specific market. For those cases, we use our expertise to forecast and estimate the market size in order to generate comprehensive data sets. Our analyst team adopt a robust research technique in order to produce the estimates:
Data Synthesis: This stage involves the analysis & mapping of all the information obtained from the previous step. It also involves in scrutinizing the data for any discrepancy observed while data gathering related to the market. The data is collected with consideration to the heterogeneity of sources. Robust scientific techniques are in place for synthesizing disparate data sets and provide the essential contextual information that can orient market strategies. The Brainy Insights has extensive experience in data synthesis where the data passes through various stages:


Market Deduction & Formulation: The final stage comprises of assigning data points at appropriate market spaces so as to deduce feasible conclusions. Analyst perspective & subject matter expert based holistic form of market sizing coupled with industry analysis also plays a crucial role in this stage.
This stage involves in finalization of the market size and numbers that we have collected from data integration step. With data interpolation, it is made sure that there is no gap in the market data. Successful trend analysis is done by our analysts using extrapolation techniques, which provide the best possible forecasts for the market.
Data Validation & Market Feedback: Validation is the most important step in the process. Validation & re-validation via an intricately designed process helps us finalize data-points to be used for final calculations.

The Brainy Insights interacts with leading companies and experts of the concerned domain to develop the analyst team’s market understanding and expertise. It improves and substantiates every single data presented in the market reports. The data validation interview and discussion panels are typically composed of the most experienced industry members. The participants include, however, are not limited to:
Moreover, we always validate our data and findings through primary respondents from all the major regions we are working on.


Free Customization
Fortune 500 Clients
Free Yearly Update On Purchase Of Multi/Corporate License
Companies Served Till Date