- +1-315-215-1633
- sales@thebrainyinsights.com

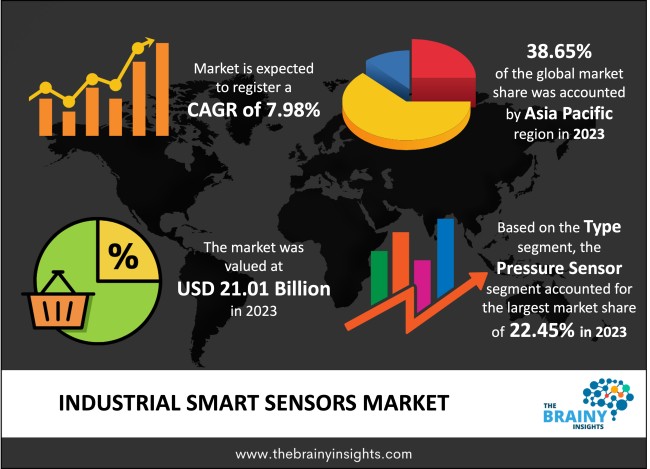
The global Industrial Smart Sensors market was valued at USD 21.01 Billion in 2023 and growing at a CAGR of 7.98% from 2024 to 2033. The market is expected to reach USD 45.27 Billion by 2033. Smart sensors help detect physical inputs like heat, light, moisture, motion, and pressure, and they react by displaying an output or transmitting the information electronically for additional processing using embedded algorithms, signal conditioning, and a digital interface. Sensors help collect data about the environment, and they maintain a high level of accuracy. Using smart sensors in industry 4.0 technologies helps improve automation and sustainability. Also, it decreases the costs of using real-time output tracking and improves the potential to monitor automated control systems. It helps the organization improve its complete operation and manufacturing process.
There is a growing demand for smart sensors, especially in developing smart cities. The sensors have a crucial role in collecting real-time data from several ranges of urban areas, and they help cities improve sustainability, productivity, and quality of life. Moreover, sensors are also used for air quality to help promote better urban settings, which help in better monitoring of pollution levels. Smart sensors are a key and integral element of the Internet of Things. IoT helps offer unique identifiers for almost everything, and it transmits data from such things over the internet or sensor networks. It has broad applications, like the surge in spending on the construction of buildings and the requirement for world-class buildings across the world, which is driving the industrial smart sensor market. There is a surge in the use of smart sensors in high-rise residential buildings and commercial buildings like IT offices, corporate offices and educational centres. Its demand is also increasing due to the need for improved security, energy-efficient devices, etc. There is a surge in the need for industrial sensors as there is an increase in Industrial 4.0 and Industrial Internet of Things (IIoT). There is a growth in awareness of industrial sensor measures in all types of end-user sectors. Smart waste management, smart buildings, smart light bulbs, smart homes, smart street lighting, smart cities, smart factories, smart offices, etc, require smart sensors. Industrial smart sensors are broadly in demand with the foundation of the Industry 4.0 transition. It collects data and processes it to identify trends and output signals, which enable action when required. The key uses of industrial smart sensors are process optimization, machine condition monitoring, and part quality improvement. Industrial smart sensors have broad uses, from data collection to the analysis of data gathered. It also helps use multiple signals to assess and monitor complete machine health. Besides, AI is used to identify patterns and trends based on data that are difficult for humans to identify. It helps managers and supervisors in scheduling predictive servicing, maintenance and parts replacement before their failure.
Get an overview of this study by requesting a free sample
Favourable government initiative– Favourable government initiatives have led to advancement in consumer electronics, defence and aerospace sectors. Also, there is a recent trend of miniaturization. All these factors will eventually drive the industrial smart sensors market. Also, it has been observed that government administrations have increased their investment in smart technologies globally. Smart cities and homes are also offering large opportunities for smart sensors. Also, there is growth in the use of devices for functionalities like lighting systems, effective monitoring, security, and surveillance systems, which are key components of connected technologies. Also, governments worldwide are taking initiatives to develop smart city projects. Moreover, there is growing use and more penetration of the Internet of Things (IoT) along with a surge in the automation of the industrial process along with smart wearable systems for health monitoring. All these factors are eventually driving the Industrial Smart Sensors market.
Requirement of upgradation– There is always a risk of malicious actors who want to access the collected data, which is meant for private use. Such activities are risky if the device’s cybersecurity measures are inadequate. Also, many devices have high prices, and upgrading them over time requires additional capital. Also, sensors require upgrades or recalibration due to data latency and other issues. For remote settings and challenging environments, this can be difficult and costly. Also, IT expertise is required for smart system sensors, which also requires capital. These factors act as hindrances to the market.
Focus on developing smart factories– The development of smart factories allows the industry to enter the fourth industrial revolution. The collection and analysis of large amounts of big data gathered from sensors help in the real-time visibility of manufacturing assets. They can offer tools for predictive maintenance to decrease equipment downtime. The use of advanced IoT devices in smart factories has led to high productivity and enhanced quality. Replacing the manual inspection business model with AI-powered visual cognizance has reduced manufacturing errors and saved money and time. Machine learning algorithms help manufacturers detect errors immediately and not in the later stages, which can be more expensive for repair. All these factors eventually propel the Industrial Smart Sensors market in the forecasting period.
The regions analyzed for the market include North America, Europe, South America, Asia Pacific, the Middle East, and Africa. Asia Pacific emerged as the largest market for the global Industrial Smart Sensors market, with a 38.65% share of the market revenue in 2023. This significant market share is due to a significant regional manufacturing hub. China is considered a massive producer of consumer electronics and vehicles. Also, fast migration is happening to smart factories in countries like South Korea. Its automotive sector is among the largest in the world. The country is the place for major players such as Hyundai, Kia and Renault. Similarly, in China, the food and beverage and electric power generation sectors are the leading sensor user bases. All these factors drive the development of industrial smart sensors in the region.
Asia Pacific Region Industrial Smart Sensors Market Share in 2023 - 38.65%
www.thebrainyinsights.com
Check the geographical analysis of this market by requesting a free sample
The type segment is divided into touch sensor, image sensor, motion sensor, position sensor, pressure sensor and temperature sensor. The pressure sensor segment dominated the market, with a market share of around 22.45% in 2023. This significant share is due to its broad use in several sectors. It controls and monitors the pressure in the tanks and pipes, which are crucial for industries such as oil & gas, food processing and pharmaceutical. It helps maintain the system's efficiency and prevention of leaks. It also ensures the consistency of the product by offering accurate pressure readings.
The application segment is divided into mining, oil & gas, manufacturing, chemical, pharmaceutical and others. The mining, oil and gas segment dominated the market, with a market share of around 33.21% in 2023. This significant share is attributed to the surge in the adoption of sensors in the oil and gas sectors, especially in pipelines and wells. These sectors are sensitive to pressure and vibration, which impacts the effectiveness of pipelines, equipment, and heavy machinery.
| Attribute | Description |
|---|---|
| Market Size | Revenue (USD Billion) |
| Market size value in 2023 | USD 21.01 Billion |
| Market size value in 2033 | USD 45.27 Billion |
| CAGR (2024 to 2033) | 7.98% |
| Historical data | 2020-2022 |
| Base Year | 2023 |
| Forecast | 2024-2033 |
| Region | The regions analyzed for the market are Asia Pacific, Europe, South America, North America, and Middle East & Africa. Furthermore, the regions are further analyzed at the country level. |
| Segments | Type and Application |
Asia Pacific region emerged as the largest market for the Industrial Smart Sensors.
The market's growth will be influenced by favourable government initiative.
Requirement of upgradation could hamper the market growth.
Focus on developing smart factories will provide huge opportunities to the market.
1. Introduction
1.1. Objectives of the Study
1.2. Market Definition
1.3. Research Scope
1.4. Currency
1.5. Key Target Audience
2. Research Methodology and Assumptions
3. Executive Summary
4. Premium Insights
4.1. Porter’s Five Forces Analysis
4.2. Value Chain Analysis
4.3. Top Investment Pockets
4.3.1. Market Attractiveness Analysis By Type
4.3.2. Market Attractiveness Analysis By Application
4.3.3. Market Attractiveness Analysis By Region
4.4. Industry Trends
5. Market Dynamics
5.1. Market Evaluation
5.2. Drivers
5.2.1. Favourable government initiative
5.3. Restraints
5.3.1. Requirement of upgradation
5.4. Opportunities
5.4.1. Focus on developing smart factories
5.5. Challenges
5.5.1. Economic slowdown
6. Global Industrial Smart Sensors Market Analysis and Forecast, By Type
6.1. Segment Overview
6.2. Touch Sensor
6.3. Image Sensor
6.4. Motion sensor
6.5. Position Sensor
6.6. Pressure Sensor
6.7. Temperature Sensor
7. Global Industrial Smart Sensors Market Analysis and Forecast, By Application
7.1. Segment Overview
7.2. Mining, Oil & Gas
7.3. Manufacturing
7.4. Chemical
7.5. Pharmaceutical
7.6. Others
8. Global Industrial Smart Sensors Market Analysis and Forecast, By Regional Analysis
8.1. Segment Overview
8.2. North America
8.2.1. U.S.
8.2.2. Canada
8.2.3. Mexico
8.3. Europe
8.3.1. Germany
8.3.2. France
8.3.3. U.K.
8.3.4. Italy
8.3.5. Spain
8.4. Asia-Pacific
8.4.1. Japan
8.4.2. China
8.4.3. India
8.5. South America
8.5.1. Brazil
8.6. Middle East and Africa
8.6.1. UAE
8.6.2. South Africa
9. Global Industrial Smart Sensors Market-Competitive Landscape
9.1. Overview
9.2. Market Share of Key Players in Global Industrial Smart Sensors Market
9.2.1. Global Company Market Share
9.2.2. North America Company Market Share
9.2.3. Europe Company Market Share
9.2.4. APAC Company Market Share
9.3. Competitive Situations and Trends
9.3.1. Type Launches and Developments
9.3.2. Partnerships, Collaborations, and Agreements
9.3.3. Mergers & Acquisitions
9.3.4. Expansions
10. Company Profiles
10.1. Honeywell International Inc.
10.1.1. Business Overview
10.1.2. Company Snapshot
10.1.3. Company Market Share Analysis
10.1.4. Company Type Portfolio
10.1.5. Recent Developments
10.1.6. SWOT Analysis
10.2. Texas Instruments Incorporated
10.2.1. Business Overview
10.2.2. Company Snapshot
10.2.3. Company Market Share Analysis
10.2.4. Company Type Portfolio
10.2.5. Recent Developments
10.2.6. SWOT Analysis
10.3. Bosch Sensortec GmbH
10.3.1. Business Overview
10.3.2. Company Snapshot
10.3.3. Company Market Share Analysis
10.3.4. Company Type Portfolio
10.3.5. Recent Developments
10.3.6. SWOT Analysis
10.4. Rockwell Automation Inc.
10.4.1. Business Overview
10.4.2. Company Snapshot
10.4.3. Company Market Share Analysis
10.4.4. Company Type Portfolio
10.4.5. Recent Developments
10.4.6. SWOT Analysis
10.5. TE Connectivity Inc.
10.5.1. Business Overview
10.5.2. Company Snapshot
10.5.3. Company Market Share Analysis
10.5.4. Company Type Portfolio
10.5.5. Recent Developments
10.5.6. SWOT Analysis
10.6. Omega Engineering Inc.
10.6.1. Business Overview
10.6.2. Company Snapshot
10.6.3. Company Market Share Analysis
10.6.4. Company Type Portfolio
10.6.5. Recent Developments
10.6.6. SWOT Analysis
10.7. ABB Limited
10.7.1. Business Overview
10.7.2. Company Snapshot
10.7.3. Company Market Share Analysis
10.7.4. Company Type Portfolio
10.7.5. Recent Developments
10.7.6. SWOT Analysis
10.8. First Sensor AG
10.8.1. Business Overview
10.8.2. Company Snapshot
10.8.3. Company Market Share Analysis
10.8.4. Company Type Portfolio
10.8.5. Recent Developments
10.8.6. SWOT Analysis
10.9. Siemens AG
10.9.1. Business Overview
10.9.2. Company Snapshot
10.9.3. Company Market Share Analysis
10.9.4. Company Type Portfolio
10.9.5. Recent Developments
10.9.6. SWOT Analysis
10.10. STMicroelectronics Inc.
10.10.1. Business Overview
10.10.2. Company Snapshot
10.10.3. Company Market Share Analysis
10.10.4. Company Type Portfolio
10.10.5. Recent Developments
10.10.6. SWOT Analysis
10.11. Omron Corporation
10.11.1. Business Overview
10.11.2. Company Snapshot
10.11.3. Company Market Share Analysis
10.11.4. Company Type Portfolio
10.11.5. Recent Developments
10.11.6. SWOT Analysis
10.12. NXP Semiconductors NV
10.12.1. Business Overview
10.12.2. Company Snapshot
10.12.3. Company Market Share Analysis
10.12.4. Company Type Portfolio
10.12.5. Recent Developments
10.12.6. SWOT Analysis
List of Table
1. Global Industrial Smart Sensors Market, By Type, 2020-2033 (USD Billion)
2. Global Touch Sensor, Industrial Smart Sensors Market, By Region, 2020-2033 (USD Billion)
3. Global Image Sensor, Industrial Smart Sensors Market, By Region, 2020-2033 (USD Billion)
4. Global Motion sensor, Industrial Smart Sensors Market, By Region, 2020-2033 (USD Billion)
5. Global Position Sensor, Industrial Smart Sensors Market, By Region, 2020-2033 (USD Billion)
6. Global Pressure Sensor, Industrial Smart Sensors Market, By Region, 2020-2033 (USD Billion)
7. Global Temperature Sensor, Industrial Smart Sensors Market, By Region, 2020-2033 (USD Billion)
8. Global Industrial Smart Sensors Market, By Application, 2020-2033 (USD Billion)
9. Global Mining, Oil & Gas, Industrial Smart Sensors Market, By Region, 2020-2033 (USD Billion)
10. Global Manufacturing, Industrial Smart Sensors Market, By Region, 2020-2033 (USD Billion)
11. Global Chemical, Industrial Smart Sensors Market, By Region, 2020-2033 (USD Billion)
12. Global Pharmaceutical, Industrial Smart Sensors Market, By Region, 2020-2033 (USD Billion)
13. Global Others, Industrial Smart Sensors Market, By Region, 2020-2033 (USD Billion)
14. North America Industrial Smart Sensors Market, By Type, 2020-2033 (USD Billion)
15. North America Industrial Smart Sensors Market, By Application, 2020-2033 (USD Billion)
16. U.S. Industrial Smart Sensors Market, By Type, 2020-2033 (USD Billion)
17. U.S. Industrial Smart Sensors Market, By Application, 2020-2033 (USD Billion)
18. Canada Industrial Smart Sensors Market, By Type, 2020-2033 (USD Billion)
19. Canada Industrial Smart Sensors Market, By Application, 2020-2033 (USD Billion)
20. Mexico Industrial Smart Sensors Market, By Type, 2020-2033 (USD Billion)
21. Mexico Industrial Smart Sensors Market, By Application, 2020-2033 (USD Billion)
22. Europe Industrial Smart Sensors Market, By Type, 2020-2033 (USD Billion)
23. Europe Industrial Smart Sensors Market, By Application, 2020-2033 (USD Billion)
24. Germany Industrial Smart Sensors Market, By Type, 2020-2033 (USD Billion)
25. Germany Industrial Smart Sensors Market, By Application, 2020-2033 (USD Billion)
26. France Industrial Smart Sensors Market, By Type, 2020-2033 (USD Billion)
27. France Industrial Smart Sensors Market, By Application, 2020-2033 (USD Billion)
28. U.K. Industrial Smart Sensors Market, By Type, 2020-2033 (USD Billion)
29. U.K. Industrial Smart Sensors Market, By Application, 2020-2033 (USD Billion)
30. Italy Industrial Smart Sensors Market, By Type, 2020-2033 (USD Billion)
31. Italy Industrial Smart Sensors Market, By Application, 2020-2033 (USD Billion)
32. Spain Industrial Smart Sensors Market, By Type, 2020-2033 (USD Billion)
33. Spain Industrial Smart Sensors Market, By Application, 2020-2033 (USD Billion)
34. Asia Pacific Industrial Smart Sensors Market, By Type, 2020-2033 (USD Billion)
35. Asia Pacific Industrial Smart Sensors Market, By Application, 2020-2033 (USD Billion)
36. Japan Industrial Smart Sensors Market, By Type, 2020-2033 (USD Billion)
37. Japan Industrial Smart Sensors Market, By Application, 2020-2033 (USD Billion)
38. China Industrial Smart Sensors Market, By Type, 2020-2033 (USD Billion)
39. China Industrial Smart Sensors Market, By Application, 2020-2033 (USD Billion)
40. India Industrial Smart Sensors Market, By Type, 2020-2033 (USD Billion)
41. India Industrial Smart Sensors Market, By Application, 2020-2033 (USD Billion)
42. South America Industrial Smart Sensors Market, By Type, 2020-2033 (USD Billion)
43. South America Industrial Smart Sensors Market, By Application, 2020-2033 (USD Billion)
44. Brazil Industrial Smart Sensors Market, By Type, 2020-2033 (USD Billion)
45. Brazil Industrial Smart Sensors Market, By Application, 2020-2033 (USD Billion)
46. Middle East and Africa Industrial Smart Sensors Market, By Type, 2020-2033 (USD Billion)
47. Middle East and Africa Industrial Smart Sensors Market, By Application, 2020-2033 (USD Billion)
48. UAE Industrial Smart Sensors Market, By Type, 2020-2033 (USD Billion)
49. UAE Industrial Smart Sensors Market, By Application, 2020-2033 (USD Billion)
50. South Africa Industrial Smart Sensors Market, By Type, 2020-2033 (USD Billion)
51. South Africa Industrial Smart Sensors Market, By Application, 2020-2033 (USD Billion)
List of Figures
1. Global Industrial Smart Sensors Market Segmentation
2. Global Industrial Smart Sensors Market: Research Methodology
3. Market Size Estimation Methodology: Bottom-Up Approach
4. Market Size Estimation Methodology: Top-Down Approach
5. Data Triangulation
6. Porter’s Five Forces Analysis
7. Value Chain Analysis
8. Global Industrial Smart Sensors Market Attractiveness Analysis By Type
9. Global Industrial Smart Sensors Market Attractiveness Analysis By Application
10. Global Industrial Smart Sensors Market Attractiveness Analysis By Region
11. Global Industrial Smart Sensors Market: Dynamics
12. Global Industrial Smart Sensors Market Share By Type (2023 & 2033)
13. Global Industrial Smart Sensors Market Share By Application (2023 & 2033)
14. Global Industrial Smart Sensors Market Share By Regions (2023 & 2033)
15. Global Industrial Smart Sensors Market Share By Company (2023)
This study forecasts revenue at global, regional, and country levels from 2020 to 2033. The Brainy Insights has segmented the global Industrial Smart Sensors market based on below mentioned segments:
Global Industrial Smart Sensors Market by Type:
Global Industrial Smart Sensors Market by Application:
Global Industrial Smart Sensors by Region:
Research has its special purpose to undertake marketing efficiently. In this competitive scenario, businesses need information across all industry verticals; the information about customer wants, market demand, competition, industry trends, distribution channels etc. This information needs to be updated regularly because businesses operate in a dynamic environment. Our organization, The Brainy Insights incorporates scientific and systematic research procedures in order to get proper market insights and industry analysis for overall business success. The analysis consists of studying the market from a miniscule level wherein we implement statistical tools which helps us in examining the data with accuracy and precision.
Our research reports feature both; quantitative and qualitative aspects for any market. Qualitative information for any market research process are fundamental because they reveal the customer needs and wants, usage and consumption for any product/service related to a specific industry. This in turn aids the marketers/investors in knowing certain perceptions of the customers. Qualitative research can enlighten about the different product concepts and designs along with unique service offering that in turn, helps define marketing problems and generate opportunities. On the other hand, quantitative research engages with the data collection process through interviews, e-mail interactions, surveys and pilot studies. Quantitative aspects for the market research are useful to validate the hypotheses generated during qualitative research method, explore empirical patterns in the data with the help of statistical tools, and finally make the market estimations.
The Brainy Insights offers comprehensive research and analysis, based on a wide assortment of factual insights gained through interviews with CXOs and global experts and secondary data from reliable sources. Our analysts and industry specialist assume vital roles in building up statistical tools and analysis models, which are used to analyse the data and arrive at accurate insights with exceedingly informative research discoveries. The data provided by our organization have proven precious to a diverse range of companies, facilitating them to address issues such as determining which products/services are the most appealing, whether or not customers use the product in the manner anticipated, the purchasing intentions of the market and many others.
Our research methodology encompasses an idyllic combination of primary and secondary initiatives. Key phases involved in this process are listed below:

The phase involves the gathering and collecting of market data and its related information with the help of different sources & research procedures.

The data procurement stage involves in data gathering and collecting through various data sources.
This stage involves in extensive research. These data sources includes:
Purchased Database: Purchased databases play a crucial role in estimating the market sizes irrespective of the domain. Our purchased database includes:
Primary Research: The Brainy Insights interacts with leading companies and experts of the concerned domain to develop the analyst team’s market understanding and expertise. It improves and substantiates every single data presented in the market reports. Primary research mainly involves in telephonic interviews, E-mail interactions and face-to-face interviews with the raw material providers, manufacturers/producers, distributors, & independent consultants. The interviews that we conduct provides valuable data on market size and industry growth trends prevailing in the market. Our organization also conducts surveys with the various industry experts in order to gain overall insights of the industry/market. For instance, in healthcare industry we conduct surveys with the pharmacists, doctors, surgeons and nurses in order to gain insights and key information of a medical product/device/equipment which the customers are going to usage. Surveys are conducted in the form of questionnaire designed by our own analyst team. Surveys plays an important role in primary research because surveys helps us to identify the key target audiences of the market. Additionally, surveys helps to identify the key target audience engaged with the market. Our survey team conducts the survey by targeting the key audience, thus gaining insights from them. Based on the perspectives of the customers, this information is utilized to formulate market strategies. Moreover, market surveys helps us to understand the current competitive situation of the industry. To be precise, our survey process typically involve with the 360 analysis of the market. This analytical process begins by identifying the prospective customers for a product or service related to the market/industry to obtain data on how a product/service could fit into customers’ lives.

Secondary Research: The secondary data sources includes information published by the on-profit organizations such as World bank, WHO, company fillings, investor presentations, annual reports, national government documents, statistical databases, blogs, articles, white papers and others. From the annual report, we analyse a company’s revenue to understand the key segment and market share of that organization in a particular region. We analyse the company websites and adopt the product mapping technique which is important for deriving the segment revenue. In the product mapping method, we select and categorize the products offered by the companies catering to domain specific market, deduce the product revenue for each of the companies so as to get overall estimation of the market size. We also source data and analyses trends based on information received from supply side and demand side intermediaries in the value chain. The supply side denotes the data gathered from supplier, distributor, wholesaler and the demand side illustrates the data gathered from the end customers for respective market domain.

The supply side for a domain specific market is analysed by:
The demand side for the market is estimated through:
In-house Library: Apart from these third-party sources, we have our in-house library of qualitative and quantitative information. Our in-house database includes market data for various industry and domains. These data are updated on regular basis as per the changing market scenario. Our library includes, historic databases, internal audit reports and archives.
Sometimes there are instances where there is no metadata or raw data available for any domain specific market. For those cases, we use our expertise to forecast and estimate the market size in order to generate comprehensive data sets. Our analyst team adopt a robust research technique in order to produce the estimates:
Data Synthesis: This stage involves the analysis & mapping of all the information obtained from the previous step. It also involves in scrutinizing the data for any discrepancy observed while data gathering related to the market. The data is collected with consideration to the heterogeneity of sources. Robust scientific techniques are in place for synthesizing disparate data sets and provide the essential contextual information that can orient market strategies. The Brainy Insights has extensive experience in data synthesis where the data passes through various stages:


Market Deduction & Formulation: The final stage comprises of assigning data points at appropriate market spaces so as to deduce feasible conclusions. Analyst perspective & subject matter expert based holistic form of market sizing coupled with industry analysis also plays a crucial role in this stage.
This stage involves in finalization of the market size and numbers that we have collected from data integration step. With data interpolation, it is made sure that there is no gap in the market data. Successful trend analysis is done by our analysts using extrapolation techniques, which provide the best possible forecasts for the market.
Data Validation & Market Feedback: Validation is the most important step in the process. Validation & re-validation via an intricately designed process helps us finalize data-points to be used for final calculations.

The Brainy Insights interacts with leading companies and experts of the concerned domain to develop the analyst team’s market understanding and expertise. It improves and substantiates every single data presented in the market reports. The data validation interview and discussion panels are typically composed of the most experienced industry members. The participants include, however, are not limited to:
Moreover, we always validate our data and findings through primary respondents from all the major regions we are working on.


Free Customization
Fortune 500 Clients
Free Yearly Update On Purchase Of Multi/Corporate License
Companies Served Till Date