- +1-315-215-1633
- sales@thebrainyinsights.com

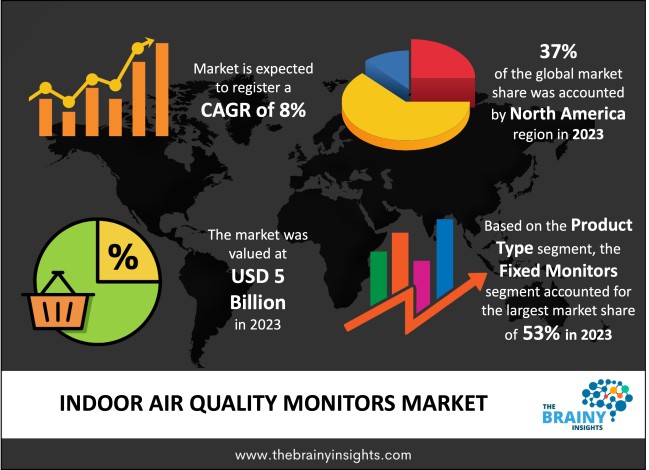
The global indoor air quality monitors market was valued at USD 5 billion in 2023 and grew at a CAGR of 8% from 2024 to 2033. The market is expected to reach USD 10.79 billion by 2033. The rising air pollution will drive the growth of the global indoor air quality monitors market.
IAQ sensors are specialized gadgets created to control the conditions of several pollutants and factors in the interior of constructed facilities for the improvement of a dwelling. These monitors are important in the identification of toxic gases such as: CO₂, VOCs, PM2.5, PM10, CO, NO₂, O₃, and humidity. IAQ monitors check and display the current state of these elements to ensure proper air quality that will minimize people’s chances of developing respiratory illnesses, allergies or any health complication as a result to the exposure to these elements in excess. The need for monitoring IAQ has increased due to consciousness arising from effects of poor indoor air quality on the health of building occupants. Short term exposure may cause effects such as fatigue, headaches and eye irritation, while long term exposure may cause long term diseases like asthma, bronchitis and even diseases of the heart. Indoor air quality instruments are widely employed in residences, schools, workplaces, healthcare facilities, and industrial sites to test the indoor air quality to ensure that it meets acceptable quality standards. They can be as basic as moveable monitor to as complex as the fixed systems. Additionally, there are many IAQ monitors with Wi-Fi connectivity which can be controlled via smartphone applications, and they can also seamlessly work in conjunction with other smart home technologies. Even some of the most complex models offer suggestions on things that should be done in order to enhance air quality and these includes, changing the rate of the HVAC system or switching on the air purifiers. IAQ monitors are the fastest-growing products in the HVAC market due to growing concerns about environmentally sensitive health problems, better sensor technology, and growing regulatory requirements for IAQ.
Get an overview of this study by requesting a free sample
The increasing incidence of health issues caused by poor air quality – Heightened concerns or health issues, the emergence of COVID-19 pandemic, and the rising awareness of the effects of environment on human health are considered as the major factors for the increasing market demand of IAQ monitors. This is because many people are becoming sensitive to the effects of poor indoor air quality. The effects of these pollutants have been associated with respiratory problems, allergies, cardiovascular diseases, chronic diseases including asthma. In turn, people and firms have adopted air quality analysis to prevent the deterioration of health in homes, businesses, and other institutions such as schools. The COVID-19 pandemic further highlighted the importance of IAQ. The virus brought highlighted the importance of ventilation and efficient air conditioning systems through which the airborne diseases could be prevented. Since the prevalence of cases of infectious diseases increased, concerns regarding the quality of indoor air also rose and thus the use of IAQ monitors. These devices emerged as critical in providing safe indoor spaces to residents and enhancing their use across both the residential and commercial segments. Another factor that has also a significant influence on the increased market growth rate is environmental awareness. With climate change and pollution becoming topics of global concern, people and companies demand solutions that reduce pollution, including clean indoor air.
High costs of indoor air quality monitors – The prohibitively high costs of setting up the IAQ monitor and the technological design and operational challenges pose major barriers when it comes to the demand for the IAQ monitors. While there are affordable basic models that cover only one or two pollutants, the advance systems of pollutants’ monitoring including integration with smart devices and extra functions cost a lot of money. For many consumers, the initial investment may appear very large in proportion to the perceived benefits of use. Also, some IAQ monitor’s models may have high technological requirements that will lead to low adoption rates. Some IAQ monitors are complex with complex sensor configurations, multiple features, and compatibility with other smart house or building management systems. Technically challenges consumers find it extremely challenging to install and maintain such systems. Some IAQ monitors are complicated to own because they need calibration, maintenance, and troubleshooting at times.
Technological advancements and favourable government regulations – Restrictions set by government authorities and developments in technology are the two most critical factors positively influencing the IAQ monitor market. With more countries implementing high standards for indoor air quality, the market for accurate IAQ monitoring technologies is increasing. Today’s regulatory agencies are imposing threshold levels of emissions including CO2, particulate matter, VOCs and other noxious effluents. As a result, industries such as health care, education, hospitality, and manufacturing have found these monitors essential. This has necessitated their adoption as failure to meet indoor air quality standards attracts some stiff regulations. At the same time, new IAQ monitoring technologies are providing increasingly simple, effective, and cost-friendly devices to meet those needs. Smart technologies enable IAQ monitors to acquire data in real-time, be remotely accessed and controlled and respond autonomously, making them more useful and practical for both residential and commercial use. With improvements such as Wi-Fi connectivity, a mobile application interface, and compatibility with other smart home systems, IAQ monitors’ application witnessed a rise.
The regions analyzed for the market include North America, Europe, South America, Asia Pacific, the Middle East, and Africa. North America emerged as the most significant global indoor air quality monitors market, with a 37% market revenue share in 2023.
North America is considered the largest market for IAQ monitor due to many reasons such as increased awareness among people and strict regulatory policies, advanced technology, and increased consumer knowledge about IAQ monitor. The United States, for example, has developed stringent environmental laws and policies that require the correct assessment and enhancement of air quality within homes, buildings and industries. For instance, the EPA guidelines have intensified the requirements for the constant monitoring of air quality to set new standards for IAQ monitoring devices. They in effect create a large market for IAQ products. Moreover, the consumers in North America are well informed on the negative impacts of poor IAQ heath implications. There are constantly growing concerns about respiratory diseases, allergies, and the consequences of insufficient purifying of indoor air. The compatibility of IAQ monitors with smart home systems which are already in vogue in the region has also contributed to the market.
North America Region Indoor Air Quality Monitors Market Share in 2023 - 37%
www.thebrainyinsights.com
Check the geographical analysis of this market by requesting a free sample
The product type segment is divided into portable monitors and fixed monitors. The fixed monitors segment dominated the market, with a market share of around 53% in 2023. Currently most IAQ monitors are fixed monitors given their reliability and flexibility in offering real-time data about the indoor air quality. These devices are most often utilized in regularly designated zones including residential neighbourhoods, offices, healthcare facilities as well as industrial structures to continuously monitor the weather and air quality. In addition, some of the advantages of fixed IAQ monitoring devices include that they integrate perfectly well with Smart Home and Building Management System platforms. These monitors can now produce alarms, record trends over time and can be used as a basis for highly analytical information with the aid of IoT technology.
The pollutant type segment is divided into particulate matter (PM2.5/PM10), volatile organic compounds (VOCs), carbon dioxide (CO2), carbon monoxide (CO), ozone (O3), humidity, and nitrogen dioxide (NO2). The particulate matter (PM2.5/PM10) segment dominated the market, with a market share of around 64% in 2023. PM2.5/PM10 are found to take majority of the IAQ monitor market since these fine particulate matter poses major health threats globally. These can be inhaled and directly enter the respiratory tract which leads to lung ailments or even more risky cardiovascular diseases. These emissions, which may originate from traffic, cooking, heating systems, and industries affect both indoor and outdoor air quality and thus require constant monitoring particularly in the rapidly urbanizing and industrializing world. The fact that people have recently become more sensitive to health risks that come from particulate pollution has resulted in growing requests for devices that can monitor particulate levels. IAQ monitoring instruments that are aimed at PM2.5 and PM10 are therefore popular because they provide users with possibly useful information regarding their environment. Further, to this, contemporary governments and regulatory organizations continue to develop tighter air quality regulations, including monitoring of particulate matter.
The end user segment is divided into residential, commercial, industrial, healthcare, and educational institutions. The residential segment dominated the market, with a market share of around 36% in 2023. The leading position of the residential segment in the IAQ monitor market is explained by the growing consumer interest in IAQ and the impact of air quality on health, as well as the increased attention to the use of smart home devices. In addition, connected IAQ monitors with smart home applications is another key consideration to growth in the residential segment. A large number of people are shifting towards smart devices that can easily fit into their existing home automation system. This convenience and functionality make IAQ monitors more appealing to the tech-savvy generation homeowners who prioritise home health and safety.
The technology segment is divided into non-smart monitors, smart monitors and hybrid monitors. The smart monitors segment dominated the market, with a market share of around 51% in 2023. Smart monitors are the most popular segment in the IAQ monitor due to the increased need for efficiency, immediacy, and connectivity to smart homes. These devices are Wi-Fi enabled, Bluetooth or have a built-in mobile application so that people can watch the quality of the air and receive notifications on existing changes in air quality on any device. The function of acquiring air quality information on one’s smartphone or another smart gadget is particularly valuable if one is a sophisticated consumer in search of an IAQ smart monitor with convenient features. Rising popularity of smart home devices also continues to drive the supremacy of smart IAQ monitors. People and homeowners are now linking their IAQ monitors with other smart devices, including thermostats, air purifier, and ventilation systems in their homes. However, newer sophisticated IAQ monitors have additional features including; periodic and comprehensive indoor air quality reports, indoor air quality trend analysis, and ability to share data which can be of great value in determining the state of the environment. Since they are easy to use, have high functionality, and can be integrated when necessary, smart monitors are gradually replacing existing IAQ monitoring technologies and are widely used in both residential and commercial sectors.
| Attribute | Description |
|---|---|
| Market Size | Revenue (USD Billion) |
| Market size value in 2023 | USD 5 Billion |
| Market size value in 2033 | USD 10.79 Billion |
| CAGR (2024 to 2033) | 8% |
| Historical data | 2020-2022 |
| Base Year | 2023 |
| Forecast | 2024-2033 |
| Region | The regions analyzed for the market are Asia Pacific, Europe, South America, North America, and Middle East and Africa. Furthermore, the regions are further analyzed at the country level. |
| Segments | Product Type, Pollutant Type, End User and Technology |
As per The Brainy Insights, the size of the global indoor air quality monitors market was valued at USD 5 billion in 2023 to USD 10.79 billion by 2033.
Global indoor air quality monitors market is growing at a CAGR of 8% during the forecast period 2024-2033.
The market's growth will be influenced by the increasing incidence of health issues caused by poor air quality.
High costs of indoor air quality monitors could hamper the market growth.
This study forecasts revenue at global, regional, and country levels from 2020 to 2033. The Brainy Insights has segmented the global indoor air quality monitors market based on below mentioned segments:
Global Indoor Air Quality Monitors Market by Product Type:
Global Indoor Air Quality Monitors Market by Pollutant Type:
Global Indoor Air Quality Monitors Market by End User:
Global Indoor Air Quality Monitors Market by Technology:
Global Indoor Air Quality Monitors Market by Region:
Research has its special purpose to undertake marketing efficiently. In this competitive scenario, businesses need information across all industry verticals; the information about customer wants, market demand, competition, industry trends, distribution channels etc. This information needs to be updated regularly because businesses operate in a dynamic environment. Our organization, The Brainy Insights incorporates scientific and systematic research procedures in order to get proper market insights and industry analysis for overall business success. The analysis consists of studying the market from a miniscule level wherein we implement statistical tools which helps us in examining the data with accuracy and precision.
Our research reports feature both; quantitative and qualitative aspects for any market. Qualitative information for any market research process are fundamental because they reveal the customer needs and wants, usage and consumption for any product/service related to a specific industry. This in turn aids the marketers/investors in knowing certain perceptions of the customers. Qualitative research can enlighten about the different product concepts and designs along with unique service offering that in turn, helps define marketing problems and generate opportunities. On the other hand, quantitative research engages with the data collection process through interviews, e-mail interactions, surveys and pilot studies. Quantitative aspects for the market research are useful to validate the hypotheses generated during qualitative research method, explore empirical patterns in the data with the help of statistical tools, and finally make the market estimations.
The Brainy Insights offers comprehensive research and analysis, based on a wide assortment of factual insights gained through interviews with CXOs and global experts and secondary data from reliable sources. Our analysts and industry specialist assume vital roles in building up statistical tools and analysis models, which are used to analyse the data and arrive at accurate insights with exceedingly informative research discoveries. The data provided by our organization have proven precious to a diverse range of companies, facilitating them to address issues such as determining which products/services are the most appealing, whether or not customers use the product in the manner anticipated, the purchasing intentions of the market and many others.
Our research methodology encompasses an idyllic combination of primary and secondary initiatives. Key phases involved in this process are listed below:

The phase involves the gathering and collecting of market data and its related information with the help of different sources & research procedures.

The data procurement stage involves in data gathering and collecting through various data sources.
This stage involves in extensive research. These data sources includes:
Purchased Database: Purchased databases play a crucial role in estimating the market sizes irrespective of the domain. Our purchased database includes:
Primary Research: The Brainy Insights interacts with leading companies and experts of the concerned domain to develop the analyst team’s market understanding and expertise. It improves and substantiates every single data presented in the market reports. Primary research mainly involves in telephonic interviews, E-mail interactions and face-to-face interviews with the raw material providers, manufacturers/producers, distributors, & independent consultants. The interviews that we conduct provides valuable data on market size and industry growth trends prevailing in the market. Our organization also conducts surveys with the various industry experts in order to gain overall insights of the industry/market. For instance, in healthcare industry we conduct surveys with the pharmacists, doctors, surgeons and nurses in order to gain insights and key information of a medical product/device/equipment which the customers are going to usage. Surveys are conducted in the form of questionnaire designed by our own analyst team. Surveys plays an important role in primary research because surveys helps us to identify the key target audiences of the market. Additionally, surveys helps to identify the key target audience engaged with the market. Our survey team conducts the survey by targeting the key audience, thus gaining insights from them. Based on the perspectives of the customers, this information is utilized to formulate market strategies. Moreover, market surveys helps us to understand the current competitive situation of the industry. To be precise, our survey process typically involve with the 360 analysis of the market. This analytical process begins by identifying the prospective customers for a product or service related to the market/industry to obtain data on how a product/service could fit into customers’ lives.

Secondary Research: The secondary data sources includes information published by the on-profit organizations such as World bank, WHO, company fillings, investor presentations, annual reports, national government documents, statistical databases, blogs, articles, white papers and others. From the annual report, we analyse a company’s revenue to understand the key segment and market share of that organization in a particular region. We analyse the company websites and adopt the product mapping technique which is important for deriving the segment revenue. In the product mapping method, we select and categorize the products offered by the companies catering to domain specific market, deduce the product revenue for each of the companies so as to get overall estimation of the market size. We also source data and analyses trends based on information received from supply side and demand side intermediaries in the value chain. The supply side denotes the data gathered from supplier, distributor, wholesaler and the demand side illustrates the data gathered from the end customers for respective market domain.

The supply side for a domain specific market is analysed by:
The demand side for the market is estimated through:
In-house Library: Apart from these third-party sources, we have our in-house library of qualitative and quantitative information. Our in-house database includes market data for various industry and domains. These data are updated on regular basis as per the changing market scenario. Our library includes, historic databases, internal audit reports and archives.
Sometimes there are instances where there is no metadata or raw data available for any domain specific market. For those cases, we use our expertise to forecast and estimate the market size in order to generate comprehensive data sets. Our analyst team adopt a robust research technique in order to produce the estimates:
Data Synthesis: This stage involves the analysis & mapping of all the information obtained from the previous step. It also involves in scrutinizing the data for any discrepancy observed while data gathering related to the market. The data is collected with consideration to the heterogeneity of sources. Robust scientific techniques are in place for synthesizing disparate data sets and provide the essential contextual information that can orient market strategies. The Brainy Insights has extensive experience in data synthesis where the data passes through various stages:


Market Deduction & Formulation: The final stage comprises of assigning data points at appropriate market spaces so as to deduce feasible conclusions. Analyst perspective & subject matter expert based holistic form of market sizing coupled with industry analysis also plays a crucial role in this stage.
This stage involves in finalization of the market size and numbers that we have collected from data integration step. With data interpolation, it is made sure that there is no gap in the market data. Successful trend analysis is done by our analysts using extrapolation techniques, which provide the best possible forecasts for the market.
Data Validation & Market Feedback: Validation is the most important step in the process. Validation & re-validation via an intricately designed process helps us finalize data-points to be used for final calculations.

The Brainy Insights interacts with leading companies and experts of the concerned domain to develop the analyst team’s market understanding and expertise. It improves and substantiates every single data presented in the market reports. The data validation interview and discussion panels are typically composed of the most experienced industry members. The participants include, however, are not limited to:
Moreover, we always validate our data and findings through primary respondents from all the major regions we are working on.


Free Customization
Fortune 500 Clients
Free Yearly Update On Purchase Of Multi/Corporate License
Companies Served Till Date