- +1-315-215-1633
- sales@thebrainyinsights.com

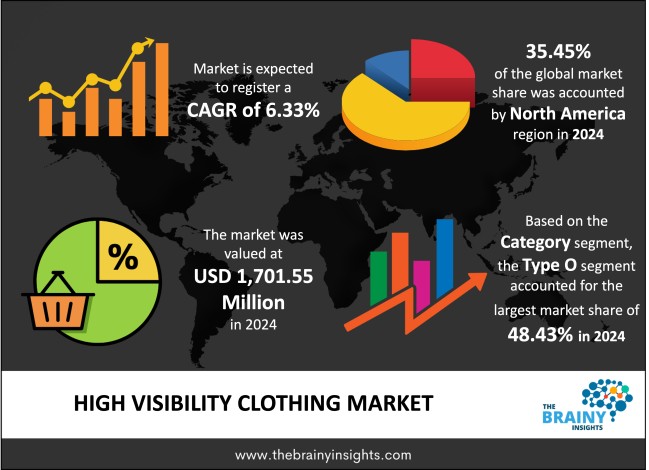
The global High Visibility Clothing market was valued at USD 1,701.55 million in 2024 and grew at a CAGR of 6.33% from 2025 to 2034. The market is expected to reach USD 3,143.42 million by 2034. The market is driven by the surge in the construction sector due to growing infrastructure globally. High-visibility clothing has largely become an industry-standard in many countries. For instance, in the UK, high visibility clothing is regulated by the Health and Safety (Safety Signs and Signals) Regulations (1996). Based on this regulation, employers should offer proper high-visibility clothes for their workers when they work in areas that have the risk of getting stuck or run over by moving vehicles or equipment.
Working on construction sites or in other hazardous environments can be risky. Hence, there is a need for the workers to wear high-visibility clothing, which makes them feel safer. It also makes them look professional and organized. Moreover, it improved their safety. High visibility clothing has many advantages, like the company logos and employee names on it, which can tremendously improve safety on the job. It helps the workers quickly identify their associates in busy and hazardous environments, thus decreasing the danger of injuries and accidents. It also helps the emergency responders to locate and identify the workers in case of an incident. It also allows the organization to showcase its brand identity and promote a professional image. Company logos and colours help the organization create a uniform and unified look for its workforce. It creates a reputation and credibility, which helps to get more clients and partners. It is also helpful for better communication among team members as such clothing can be easily recognizable. It helps improve collaboration, efficiency, and job satisfaction.
High visibility clothing is particularly designed as protective clothing that helps improve the visibility of employees in poor lighting environments and hazardous work conditions. It consists of a broad range of garments like vests, jackets and pants with reflective strips and bright colours, making the wearer more visible to colleagues or road users. The Fleet and logistics sector is where safety and visibility are significant. Employees here generally work around vehicles or heavy machinery, so they must be visible to prevent accidents. High-visibility clothing decreases the risk of collisions and injuries by improving the visibility of employees, which draws the attention of other road users or colleagues.
Get an overview of this study by requesting a free sample
Growing Demand from the Construction Sector – Based on one of the studies, the global construction sector will increase by USD 4.5 trillion in the coming 10 years and reach USD 15.2 trillion by 2030. It also predicted that India, China, the US, and Indonesia would account for around 60% of the growth, and the top 10 construction markets would hold around 70% of the growth. These countries are driving growth due to growing demand for construction due to significant population growth, expanding economies, rapid urbanization, and government infrastructure development and expansion initiatives. For instance, the growing population in India and infrastructure development plan is developing a very vibrant construction market. Based on one of the studies, between 2023 and 2027, the Indian construction sector is estimated to grow at a CAGR of around 10%, and it is set to reach USD 762.68 Billion by 2027. This factor will eventually propel the growth of high visibility clothing market.
Surge in Hi-Vis counterfeit garments – In the luxury sector, counterfeit products are very common, and hence, many measures have been taken to combat it. Production then goes overseas; the organization has less control over the supply chain, which leads to fake products. Based on one of the studies, the global trade in counterfeit products has reached nearly half a trillion dollars every year, and no sector is immune to it. Personal protective equipment is also suffering from it, and it is more than just branding and business difficulty; it leads to human life safety concerns.
Advancement in technology – High-visibility clothing is progressing along with advancements in technology. Several features, such as LED lights, smart fabrics, and wearable sensors, are being used in high-visibility clothing and are becoming popular. Such innovations offer better safety and efficiency by providing real-time feedback about the person activity who has put it on and about the environmental risks. For instance, smart high-visibility clothing can alert the workers when there is a hazard due to nearby machinery or weather conditions that have become worse. These features can help redefine on-site safety concerns. Also, the recent trends suggest that the basic vests are more common with landscapers, lot attendants and small job-site operations, and the organization can focus on vests for innovations. Also, large organizations like docks, rails, and construction companies seek high-quality, comfortable, durable, and high-visibility clothing. Workers and supervisors want more features like pockets and don’t like to change into regular jackets at the end of the day. They prefer black bottoms for hiding dirt and more reversible jackets, which can be used for workwear or weekend wear. These factors are anticipated to provide lucrative growth opportunities in the upcoming years.
The regions analyzed for the market include North America, Europe, South America, Asia Pacific, the Middle East, and Africa. North America emerged as the most significant global High Visibility Clothing market, with a 35.45% market revenue share in 2024.
The North American region leads the High Visibility Clothing market because of the presence of regulatory organizations such as OSHA. Moreover, there is a surge in awareness about personal safety, and infrastructure projects are growing. Developed organizations like the US largely adopt personal protective equipment because of stringent relation policies and growth in workplace fatalities. APAC has the highest growth rate, largely due to rapid urbanization, population growth and industrialization, which is fuelling the construction sector. In the region, emerging economies like China and India drive construction and mining activities, eventually creating the demand for High Visibility Clothing.
North America Region High Visibility Clothing Market Share in 2024 – 35.45%
www.thebrainyinsights.com
Check the geographical analysis of this market by requesting a free sample
The category segment is divided into Type O, Type R and Type P. Type O segment dominated the market, with a market share of around 48.43% in 2024. Type O high-visibility apparel is appropriate for mining, warehouses, and Petro Chemical. This is very affordable and has a smaller amount of reflective materials. It can visually distinguish the wearer from non-complex backgrounds. It can be appropriate for vehicle and equipment speeds not exceeding 25 mph.
The product type segment is divided into Shirts, Pants, Jackets, Vests and Others. The vests segment dominated the market, with a market share of around 30.11% in 2024. This significant share is due to its high usability for increasing the person’s visibility, which can help prevent vehicle or machinery accidents. These are preferred in occupations like construction, traffic areas, warehouses and hazardous areas, among others.
The end user segment is divided Construction, Oil and Gas, Public Safety, Transportation & Warehousing, Industrial Manufacturing and Others. The Construction segment dominated the market, with a market share of around 23.67% in 2024. This lion's share is attributed to the large use of high-visibility clothing in the construction sector. This high visibility helps make all the workers visible and thus decreases the risk of accidents and injuries. Construction workers generally work near heavy machinery and other hazards. The use of high-visibility clothing makes them visible to the operator of such machines and thus prevents accidents.
| Attribute | Description |
|---|---|
| Market Size | Revenue (USD Million) |
| Market size value in 2024 | USD 1,701.55 Million |
| Market size value in 2034 | USD 3,143.42 Million |
| CAGR (2025 to 2034) | 6.33% |
| Historical data | 2021-2023 |
| Base Year | 2024 |
| Forecast | 2025-2034 |
| Region | The regions analyzed for the market are Asia Pacific, Europe, South America, North America, and Middle East and Africa. Furthermore, the regions are further analyzed at the country level. |
| Segments | Category, Product Type, and End User |
As per The Brainy Insights, the size of the global High Visibility Clothing market was valued at USD 1,701.55 Million in 2024 to USD 3,143.42 Million by 2034.
Global High Visibility Clothing market is growing at a CAGR of 6.33% during the forecast period 2025-2034.
The market's growth will be influenced by growing demand from the construction sector.
Surge in Hi-Vis counterfeit garments could hamper the market growth.
This study forecasts revenue at global, regional, and country levels from 2021 to 2034. The Brainy Insights has segmented the global High Visibility Clothing market based on below mentioned segments:
Global High Visibility Clothing Market by Category:
Global High Visibility Clothing Market by Product Type:
Global High Visibility Clothing Market by End User:
Global High Visibility Clothing Market by Region:
Research has its special purpose to undertake marketing efficiently. In this competitive scenario, businesses need information across all industry verticals; the information about customer wants, market demand, competition, industry trends, distribution channels etc. This information needs to be updated regularly because businesses operate in a dynamic environment. Our organization, The Brainy Insights incorporates scientific and systematic research procedures in order to get proper market insights and industry analysis for overall business success. The analysis consists of studying the market from a miniscule level wherein we implement statistical tools which helps us in examining the data with accuracy and precision.
Our research reports feature both; quantitative and qualitative aspects for any market. Qualitative information for any market research process are fundamental because they reveal the customer needs and wants, usage and consumption for any product/service related to a specific industry. This in turn aids the marketers/investors in knowing certain perceptions of the customers. Qualitative research can enlighten about the different product concepts and designs along with unique service offering that in turn, helps define marketing problems and generate opportunities. On the other hand, quantitative research engages with the data collection process through interviews, e-mail interactions, surveys and pilot studies. Quantitative aspects for the market research are useful to validate the hypotheses generated during qualitative research method, explore empirical patterns in the data with the help of statistical tools, and finally make the market estimations.
The Brainy Insights offers comprehensive research and analysis, based on a wide assortment of factual insights gained through interviews with CXOs and global experts and secondary data from reliable sources. Our analysts and industry specialist assume vital roles in building up statistical tools and analysis models, which are used to analyse the data and arrive at accurate insights with exceedingly informative research discoveries. The data provided by our organization have proven precious to a diverse range of companies, facilitating them to address issues such as determining which products/services are the most appealing, whether or not customers use the product in the manner anticipated, the purchasing intentions of the market and many others.
Our research methodology encompasses an idyllic combination of primary and secondary initiatives. Key phases involved in this process are listed below:

The phase involves the gathering and collecting of market data and its related information with the help of different sources & research procedures.

The data procurement stage involves in data gathering and collecting through various data sources.
This stage involves in extensive research. These data sources includes:
Purchased Database: Purchased databases play a crucial role in estimating the market sizes irrespective of the domain. Our purchased database includes:
Primary Research: The Brainy Insights interacts with leading companies and experts of the concerned domain to develop the analyst team’s market understanding and expertise. It improves and substantiates every single data presented in the market reports. Primary research mainly involves in telephonic interviews, E-mail interactions and face-to-face interviews with the raw material providers, manufacturers/producers, distributors, & independent consultants. The interviews that we conduct provides valuable data on market size and industry growth trends prevailing in the market. Our organization also conducts surveys with the various industry experts in order to gain overall insights of the industry/market. For instance, in healthcare industry we conduct surveys with the pharmacists, doctors, surgeons and nurses in order to gain insights and key information of a medical product/device/equipment which the customers are going to usage. Surveys are conducted in the form of questionnaire designed by our own analyst team. Surveys plays an important role in primary research because surveys helps us to identify the key target audiences of the market. Additionally, surveys helps to identify the key target audience engaged with the market. Our survey team conducts the survey by targeting the key audience, thus gaining insights from them. Based on the perspectives of the customers, this information is utilized to formulate market strategies. Moreover, market surveys helps us to understand the current competitive situation of the industry. To be precise, our survey process typically involve with the 360 analysis of the market. This analytical process begins by identifying the prospective customers for a product or service related to the market/industry to obtain data on how a product/service could fit into customers’ lives.

Secondary Research: The secondary data sources includes information published by the on-profit organizations such as World bank, WHO, company fillings, investor presentations, annual reports, national government documents, statistical databases, blogs, articles, white papers and others. From the annual report, we analyse a company’s revenue to understand the key segment and market share of that organization in a particular region. We analyse the company websites and adopt the product mapping technique which is important for deriving the segment revenue. In the product mapping method, we select and categorize the products offered by the companies catering to domain specific market, deduce the product revenue for each of the companies so as to get overall estimation of the market size. We also source data and analyses trends based on information received from supply side and demand side intermediaries in the value chain. The supply side denotes the data gathered from supplier, distributor, wholesaler and the demand side illustrates the data gathered from the end customers for respective market domain.

The supply side for a domain specific market is analysed by:
The demand side for the market is estimated through:
In-house Library: Apart from these third-party sources, we have our in-house library of qualitative and quantitative information. Our in-house database includes market data for various industry and domains. These data are updated on regular basis as per the changing market scenario. Our library includes, historic databases, internal audit reports and archives.
Sometimes there are instances where there is no metadata or raw data available for any domain specific market. For those cases, we use our expertise to forecast and estimate the market size in order to generate comprehensive data sets. Our analyst team adopt a robust research technique in order to produce the estimates:
Data Synthesis: This stage involves the analysis & mapping of all the information obtained from the previous step. It also involves in scrutinizing the data for any discrepancy observed while data gathering related to the market. The data is collected with consideration to the heterogeneity of sources. Robust scientific techniques are in place for synthesizing disparate data sets and provide the essential contextual information that can orient market strategies. The Brainy Insights has extensive experience in data synthesis where the data passes through various stages:


Market Deduction & Formulation: The final stage comprises of assigning data points at appropriate market spaces so as to deduce feasible conclusions. Analyst perspective & subject matter expert based holistic form of market sizing coupled with industry analysis also plays a crucial role in this stage.
This stage involves in finalization of the market size and numbers that we have collected from data integration step. With data interpolation, it is made sure that there is no gap in the market data. Successful trend analysis is done by our analysts using extrapolation techniques, which provide the best possible forecasts for the market.
Data Validation & Market Feedback: Validation is the most important step in the process. Validation & re-validation via an intricately designed process helps us finalize data-points to be used for final calculations.

The Brainy Insights interacts with leading companies and experts of the concerned domain to develop the analyst team’s market understanding and expertise. It improves and substantiates every single data presented in the market reports. The data validation interview and discussion panels are typically composed of the most experienced industry members. The participants include, however, are not limited to:
Moreover, we always validate our data and findings through primary respondents from all the major regions we are working on.


Free Customization
Fortune 500 Clients
Free Yearly Update On Purchase Of Multi/Corporate License
Companies Served Till Date