- +1-315-215-1633
- sales@thebrainyinsights.com

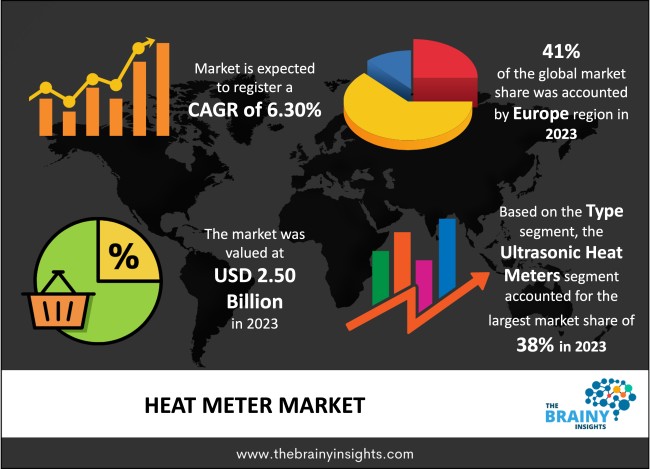
The global heat meter market was valued at USD 2.50 billion in 2023 and grew at a CAGR of 6.30% from 2024 to 2033. The market is expected to reach USD 4.60 billion by 2033. The increasing demand for central heating systems in rapidly expanding urban areas will drive the growth of the global heat meter market.
A heat meter is necessary to determine the thermal consumption or production of warmth in heating systems employed in domestic, business, and industrial fields. As a result, it allows for precise measurement of the consumed heat energy by the consumers, which makes it an indispensable tool in the regulation of the consumption of the heat energy in the district heating systems, as well as the individual heating units and other systems where hot water or space heating is used, for correct billing. These meters measure the flow rate, temperature, and, in some cases, pressure within the heating system. The temperature difference between the incoming and outgoing fluids is then used to determine the thermal energy taken. Heat meters typically have three main components: a flow sensor, several different temperature sensors, and a microprocessor. The flow sensor captures the quantity in terms of litres per minute, or any fluid in the system, and the temperature sensors are used to capture the temperature of the fluid at the inlet and outlet positions. Based on this data, the microprocessor works out the energy consumption and then diverts to a digital display or to a billing /monitoring system. The energy measurement is normally given in kilowatt-hours or KwH or sometimes even horsepower. Heat meters are most widespread in district heating, where a central heating plant delivers hot water or steam to separate consumers or buildings through the pipeline. Heat meters measure the heat each consumer uses and guarantee that you pay according to your consumption rather than by bill rates, increasing energy efficiency. They also help achieve better system control and sophistication since the consumption rates can adjust heating outputs.
Get an overview of this study by requesting a free sample
Rapid urbanization and industrialization – The major end-users that impact heat consumption and, hence, the demand for heat meters include urban areas due to increased infrastructure expansion. The need for district heating systems with improved energy distribution and management also tends to rise as population density reaches urban centres. Heat meters are being installed as a standard practice due to legal compliance with increasing concerns of heat wastage. With the development of urban sites, there is growing concern about boosting the capacity to generate more energy as heating demand increases. In many countries, energy-saving codes and standards and sustainable development objectives have led to the extensive installation of heat meters in newly constructed buildings and districts for heating systems' proper functioning and efficiency. Furthermore, the development of smart cities as cities in which IoT is given special attention also accelerated the use of heat meters for determining power consumption in real time, which makes heat meters an indispensable part of contemporary cities.
The high initial cost of investment and maintenance – One of the key factors that bar heat meters from finding a great market within commercial, residential, and particularly ageing infrastructures is the high initial costs involved in their purchase and installation. The initial cost of a heat meter can be anything from £50 to £400 depending on the features, accuracy and technology, but this is not the full picture. Other costs include the cost of the physical meter installation, including supporting structures like sensors, data transmission systems and possible adaptations to existing heating systems. For large-scale district heating systems or commercial premises, installing heat meters in the existing building may be extremely costly. In such instances, a lot of capital expenditure is required for retrofitting old pipes, adding new control valves, and guaranteeing that the system possesses the capacity to monitor a wide range of energy consumption in various units or areas. Thus, while the long-term cost-savings associated with heat meters are apparent, the extremely high up-front costs continue to be prohibitive to growth.
Regulatory standards and relevant legislation – According to energy consumption regulation, there are strict laws and directives, especially in European regions, that require setting up heat meters on buildings and district heating systems to conform to its legislation. For instance, the Energy Efficiency Directive in the European Union mandates that new buildings and those under massive refurbishing must install individual heating and cooling meters, increasing the demand for heat meters. These regulations are meant to check on accurate monitoring and billing with consumer insight into energy usage and costs. Another reason that can be attributed to the increased use of heat meters is the energy legislation that harbours emission reduction as one of its objectives. It is important to note that a large number of countries are integrating policies that encourage the use of efficient building practices and incorporation of renewable energy, which, to the most extent, entails the provision of real-time energy metering and energy consumption data. These legislative requirements are met by applying heat meters – accurate thermal energy measurements are required to track credentials and progress towards efficiency and sustainability objectives.
The regions analyzed for the market include North America, Europe, South America, Asia Pacific, the Middle East, and Africa. Europe emerged as the most significant global heat meter market, with a 41% market revenue share in 2023.
Europe's leadership in the global heat meter market originates from effective legislation, widespread utilization of district heating, and deep concern about energy efficiency and sustainable development. This dominance has been done in conjunction with the support of the EU through policies like the Energy Efficiency Directive, which requires using heat meters in district heating systems to effectively charge consumers while also achieving energy conservation objectives. Also, a high rate of urbanization in Europe and the maximum utilization of district heating in populated regions have boosted the usage of heat meters. Furthermore, the rising demand for smart city solutions has created more demand for superior heat meters that can connect with IoT systems for data tracking in real-time, meaning that Europe is still the leading player in the heat meter market.
Europe Region Heat Meter Market Share in 2023 - 41%
www.thebrainyinsights.com
Check the geographical analysis of this market by requesting a free sample
The type segment is divided into mechanical heat meters, ultrasonic heat meters and electromagnetic heat meters. The ultrasonic heat meters segment dominated the market, with a market share of around 38% in 2023. Ultrasonic heat meters have become popular globally because of their high accuracy, reliability, and user-friendly features. These meters use ultrasonic signals transmitted through the fluid of a heating system; the time taken for a signal to cross between sensors determines the flow rate. One main advantage of using this technology is that it provides a high level of accuracy in terms of energy measurement, thus essential in systems where the billing needs to be precise. Ultrasonic heat meters have no parts that are moved mechanically; thus, there are low chances of breakdown and wearing, meaning maintenance charges are low, and it has a longer life than mechanical meters. The preference for ultrasonic meters is also due to their ability to perform well under various temperature and flow rates, thus making them applicable for domestic and industrial use. Moreover, ultrasonic meters offer additional information that can help control heating systems more effectively, which is essential in commercial and industrial facilities, district heating networks, etc. Further adding to their influence is the simplicity of installation of the products that constitute this structure. Ultrasonic meters are typically more versatile in existing systems; thus, little infrastructure change is required. Their compatibility with smart meter systems and integration with IoT devices extends their application value since it is easy to monitor and control the device remotely. High accuracy, high durability, user-friendliness, and compatibility with smart systems have made ultrasonic heat meters the most preferred globally.
The application segment is divided into district heating, residential buildings, and commercial and industrial. The district heating segment dominated the market, with a market share of around 35% in 2023. District heating represents the largest segment within the global heat meter market owing to the high penetration of this heating system, especially in European countries where numerous buildings or even whole districts are connected to the district heating system. In district heating systems, heat is produced centrally through a plant, power plant or a big boiler and the heat is then transferred through insulated pipes to buildings homes, offices, etc. It is cheaper and more efficient. District heating systems mean that heat can be produced centrally, at least where individual buildings should not have their heating unit. Furthermore, these systems may be designed to utilize renewable energy like biomass, geothermal energy, or waste heat and hence help achieve sustainable objectives and low carbon impact.
The end-user industry segment is divided into residential, commercial, and industrial. The residential segment dominated the market, with a market share of around 37% in 2023. The domination of the market by residential end-users is attributed to the global shift towards efficient energy consumption, affordable tariffs and accurate billing in residential premises. As cheaper energy sources remain scarce, homeowners/tenants are often looking for ways to regulate conventional heating systems. The residential application continues to be highly popular in areas where district heating systems are already prevalent, such as in Europe, where most buildings are multi-story buildings and apartment blocks. In such environments, heat meters make it possible to charge a unit according to its separate use as opposed to a regressive rate, which is much to the benefit of the occupants. Moreover, new construction and modernization of objects have led to the widespread use of heat meters as obligatory regulations for energy efficiency. Also, the compatibility of the heat meters with the smart home has boosted demand within the residential segment more than in any other segment.
| Attribute | Description |
|---|---|
| Market Size | Revenue (USD Billion) |
| Market size value in 2023 | USD 2.50 Billion |
| Market size value in 2033 | USD 4.60 Billion |
| CAGR (2024 to 2033) | 6.30% |
| Historical data | 2020-2022 |
| Base Year | 2023 |
| Forecast | 2024-2033 |
| Region | The regions analyzed for the market are Asia Pacific, Europe, South America, North America, and Middle East and Africa. Furthermore, the regions are further analyzed at the country level. |
| Segments | Type, Application and End User Industry |
As per The Brainy Insights, the size of the global heat meter market was valued at USD 2.50 billion in 2023 to USD 4.60 billion by 2033.
Global heat meter market is growing at a CAGR of 6.30% during the forecast period 2024-2033.
The market's growth will be influenced by the rapid urbanization and industrialization.
High initial cost of investment and maintenance could hamper the market growth.
This study forecasts revenue at global, regional, and country levels from 2020 to 2033. The Brainy Insights has segmented the global heat meter market based on below mentioned segments:
Global Heat Meter Market by Type:
Global Heat Meter Market by Application:
Global Heat Meter Market by End User Industry:
Global Heat Meter Market by Region:
Research has its special purpose to undertake marketing efficiently. In this competitive scenario, businesses need information across all industry verticals; the information about customer wants, market demand, competition, industry trends, distribution channels etc. This information needs to be updated regularly because businesses operate in a dynamic environment. Our organization, The Brainy Insights incorporates scientific and systematic research procedures in order to get proper market insights and industry analysis for overall business success. The analysis consists of studying the market from a miniscule level wherein we implement statistical tools which helps us in examining the data with accuracy and precision.
Our research reports feature both; quantitative and qualitative aspects for any market. Qualitative information for any market research process are fundamental because they reveal the customer needs and wants, usage and consumption for any product/service related to a specific industry. This in turn aids the marketers/investors in knowing certain perceptions of the customers. Qualitative research can enlighten about the different product concepts and designs along with unique service offering that in turn, helps define marketing problems and generate opportunities. On the other hand, quantitative research engages with the data collection process through interviews, e-mail interactions, surveys and pilot studies. Quantitative aspects for the market research are useful to validate the hypotheses generated during qualitative research method, explore empirical patterns in the data with the help of statistical tools, and finally make the market estimations.
The Brainy Insights offers comprehensive research and analysis, based on a wide assortment of factual insights gained through interviews with CXOs and global experts and secondary data from reliable sources. Our analysts and industry specialist assume vital roles in building up statistical tools and analysis models, which are used to analyse the data and arrive at accurate insights with exceedingly informative research discoveries. The data provided by our organization have proven precious to a diverse range of companies, facilitating them to address issues such as determining which products/services are the most appealing, whether or not customers use the product in the manner anticipated, the purchasing intentions of the market and many others.
Our research methodology encompasses an idyllic combination of primary and secondary initiatives. Key phases involved in this process are listed below:

The phase involves the gathering and collecting of market data and its related information with the help of different sources & research procedures.

The data procurement stage involves in data gathering and collecting through various data sources.
This stage involves in extensive research. These data sources includes:
Purchased Database: Purchased databases play a crucial role in estimating the market sizes irrespective of the domain. Our purchased database includes:
Primary Research: The Brainy Insights interacts with leading companies and experts of the concerned domain to develop the analyst team’s market understanding and expertise. It improves and substantiates every single data presented in the market reports. Primary research mainly involves in telephonic interviews, E-mail interactions and face-to-face interviews with the raw material providers, manufacturers/producers, distributors, & independent consultants. The interviews that we conduct provides valuable data on market size and industry growth trends prevailing in the market. Our organization also conducts surveys with the various industry experts in order to gain overall insights of the industry/market. For instance, in healthcare industry we conduct surveys with the pharmacists, doctors, surgeons and nurses in order to gain insights and key information of a medical product/device/equipment which the customers are going to usage. Surveys are conducted in the form of questionnaire designed by our own analyst team. Surveys plays an important role in primary research because surveys helps us to identify the key target audiences of the market. Additionally, surveys helps to identify the key target audience engaged with the market. Our survey team conducts the survey by targeting the key audience, thus gaining insights from them. Based on the perspectives of the customers, this information is utilized to formulate market strategies. Moreover, market surveys helps us to understand the current competitive situation of the industry. To be precise, our survey process typically involve with the 360 analysis of the market. This analytical process begins by identifying the prospective customers for a product or service related to the market/industry to obtain data on how a product/service could fit into customers’ lives.

Secondary Research: The secondary data sources includes information published by the on-profit organizations such as World bank, WHO, company fillings, investor presentations, annual reports, national government documents, statistical databases, blogs, articles, white papers and others. From the annual report, we analyse a company’s revenue to understand the key segment and market share of that organization in a particular region. We analyse the company websites and adopt the product mapping technique which is important for deriving the segment revenue. In the product mapping method, we select and categorize the products offered by the companies catering to domain specific market, deduce the product revenue for each of the companies so as to get overall estimation of the market size. We also source data and analyses trends based on information received from supply side and demand side intermediaries in the value chain. The supply side denotes the data gathered from supplier, distributor, wholesaler and the demand side illustrates the data gathered from the end customers for respective market domain.

The supply side for a domain specific market is analysed by:
The demand side for the market is estimated through:
In-house Library: Apart from these third-party sources, we have our in-house library of qualitative and quantitative information. Our in-house database includes market data for various industry and domains. These data are updated on regular basis as per the changing market scenario. Our library includes, historic databases, internal audit reports and archives.
Sometimes there are instances where there is no metadata or raw data available for any domain specific market. For those cases, we use our expertise to forecast and estimate the market size in order to generate comprehensive data sets. Our analyst team adopt a robust research technique in order to produce the estimates:
Data Synthesis: This stage involves the analysis & mapping of all the information obtained from the previous step. It also involves in scrutinizing the data for any discrepancy observed while data gathering related to the market. The data is collected with consideration to the heterogeneity of sources. Robust scientific techniques are in place for synthesizing disparate data sets and provide the essential contextual information that can orient market strategies. The Brainy Insights has extensive experience in data synthesis where the data passes through various stages:


Market Deduction & Formulation: The final stage comprises of assigning data points at appropriate market spaces so as to deduce feasible conclusions. Analyst perspective & subject matter expert based holistic form of market sizing coupled with industry analysis also plays a crucial role in this stage.
This stage involves in finalization of the market size and numbers that we have collected from data integration step. With data interpolation, it is made sure that there is no gap in the market data. Successful trend analysis is done by our analysts using extrapolation techniques, which provide the best possible forecasts for the market.
Data Validation & Market Feedback: Validation is the most important step in the process. Validation & re-validation via an intricately designed process helps us finalize data-points to be used for final calculations.

The Brainy Insights interacts with leading companies and experts of the concerned domain to develop the analyst team’s market understanding and expertise. It improves and substantiates every single data presented in the market reports. The data validation interview and discussion panels are typically composed of the most experienced industry members. The participants include, however, are not limited to:
Moreover, we always validate our data and findings through primary respondents from all the major regions we are working on.


Free Customization
Fortune 500 Clients
Free Yearly Update On Purchase Of Multi/Corporate License
Companies Served Till Date