- +1-315-215-1633
- sales@thebrainyinsights.com

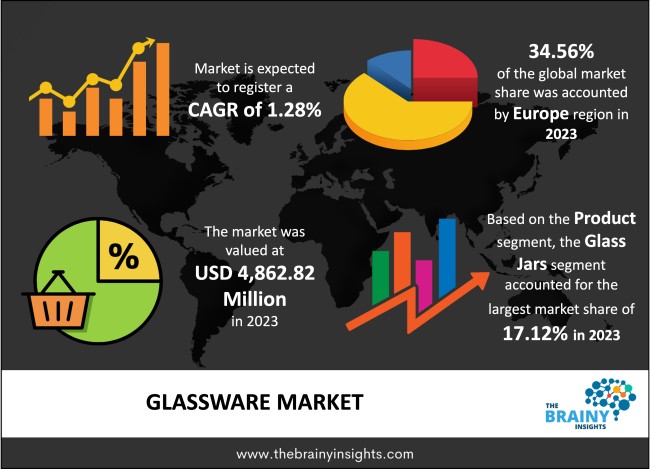
The global Glassware market was valued at USD 4,862.82 Million in 2023 and growing at a CAGR of 1.28% from 2024 to 2033. The market is expected to reach USD 5,522.36 Million by 2033. This growth is attributed to the growing demand for sectors such as households, café& bars and hotels & restaurants. Moreover, there is a growing demand for tableware. The glassware sector is growing as glass is non-porous in nature, and hence, it is less prone to bacteria and other microbes. Hence, it is considered more hygienic than plastic. As consumers are more aware towards their health, they prefer glass tableware. These factors will eventually drive the growth of the glassware market.
The growing demand for glassware is driving manufacturers to focus on research and development to provide cost-efficient and durable glassware which is in demand by customers. Hence, this sector is on the verge of experiencing huge demand. For instance, there is a growing demand for beverageware. Europe seems to dominate the sector due to growing urbanization and the surge in the use of glassware, particularly for alcoholic beverages and wine. The expansion of the middle-class society has led to an increase in the disposable income of the people, and there is growing acceptance of social drinking. All these factors will eventually drive the market. The glassware broadly used for daily household use is drinking glass, serving bowls, dinnerware, and storage containers, among others. Consumers are looking for glassware that is both functional and aesthetic. It has options which range from traditional designs to contemporary styles. The glassware sector is also growing due to growing demand from sectors such as pharmaceuticals, chemicals and food & beverage among others. Daily household application of glassware includes dinnerware, drinking glasses, serving bowls and storage containers. Glassware products are designed for its application in the kitchen like cookware, utensils and bakeware. It has become a crucial part of modern-day kitchens. For instance, glass cookware provides many advantages like heat resistance, ease of cleaning and non-reactivity. Also, the hospitality and food service sector is fueling the demand for commercial glassware, such as glassware for bars, hotels, restaurants, and catering businesses. Products in glassware for serving beverages, desserts, cocktails and snacks are driving its growing use. Glassware demand is growing as it is non-porous and less likely to harbour bacteria and other microbes, making it more hygienic than plastic. Hence, health-conscious consumers broadly prefer glass tableware to plastic. It has been observed that urban consumers generally prefer stylish and modern designs. Glassware products are common globally in offices, households, hospitals, educational institutions, restaurants, and hotels. These types of products serve many purpose like the daily meal preparation to special events and occasions. All these factors are driving the Glassware market.
Get an overview of this study by requesting a free sample
High demand in the hospitality sector – The growing investment in the hospitality sector, like restaurants, hotels and bars, is fueling the need for premium glassware sets to enhance the experience of customers. It has been observed that guests are generally attracted towards visually appealing Instagram photos and beautiful glass cups, which can become a unique selling point for the hospitality sector. Also, there has been a change in consumer lifestyle; hence, they prefer at-home entertaining and culinary experiences, and hence, the demand for the glassware sector has increased. It also shows that people now like sophisticated presentations and housekeeping. Moreover, advancements in production technology in the glassware sector also propel the market's growth as they help make complex and durable designs. All these factors are driving the Glassware market.
Preference for other alternatives– Some factors, like the glassware, have a higher chance of breaking, which can also lead to unsafe environments. On the other hand, plasticware can be lightweight, non-breakable, and flexible. It is also cost-effective compared to glass. Hence, plasticware is considered good for safety. Also, there are many other substitutes like mugs, steel glasses, high balls, Collins glasses, etc. All these factors are acting as restraints for the market.
More focus on styles and designs of glassware– The recent trend suggests that people are more attracted to popular styles and glassware designs with more appeal. Moreover, there are several types of glassware popular at social events, like the tumbler, which is considered a good choice for serving a broad range of beverages like water, juices, cocktails, and spirits, among others. Similarly, coloured wine glasses are also in demand due to their eye-catching appeal. It offers a certain personality to the dining experience. Also, there are cocktail glasses, which are very common among bartenders and enthusiasts. Thus, This glassware sector focuses more on innovation, such as ribbed glass and coloured wine glass, which are in demand. It shows consumers are looking for glassware products with both functionality and aesthetic appeal. These innovations are offering sophistication and personalized drinking experiences. All these factors would, in turn, drive the Glassware market in the forecasting period.
The regions analyzed for the market include North America, Europe, South America, Asia Pacific, the Middle East, and Africa. Europe emerged as the largest market for the global Glassware market, with a 34.56% share of the market revenue in 2023. This market share is attributed to expanding urbanization and growing demand for regional glassware, particularly wine and other alcoholic beverages. The population in the region is also expanding broadly due to the migration of people from other countries, fueling the market's growth due to the preference for different types of glassware products. Also, glassware products, like those found in restaurants and hotels, are broadly in demand in the hospitality sector. All these factors are driving the Glassware market in the region.
Europe Region Glassware Market Share in 2023 - 34.56%
www.thebrainyinsights.com
Check the geographical analysis of this market by requesting a free sample
The product segment is divided into tea cup, coffee mug, wine glass, beer mug, pitchers and glass jars and others. The glass jars segment dominated the market, with a market share of around 17.12% in 2023. This significant market share is attributed to its broad use in storing food. Jars can also be used to carry supper, store leftovers, or keep them in the freezer. Glassware products are considered more health-friendly than plastic jars..
The price point segment is divided into premium, medium and economy. Medium segment dominated the market, with a market share of around 41.67% in 2023. This market share is attributed to references for medium-price range glassware products such as glass jars and glasses for water, which are broadly preferred in households as well as in the hospitality sector, such as restaurants and hotels. Medium-range glass jars are used to keep snacks and other eatable items, and glass bottles are also broadly used to keep water at many hotels. As it provides aesthetic looks.
The end user segment is divided into household, hotel & restaurants, café & bars and others. Hotel & restaurants segment dominated the market, with a market share of around 30.41% in 2023. This market share is attributed to the broad use of glassware products in hotels and restaurants, among others, as they provide functionality along with their aesthetic appeal. Many types of glassware products are broadly used in restaurants as they give a premium aesthetic. Also, water glasses are most common, and they are commonly used to drink juice, spritzers, or even cocktails other than water.
The distribution channel segment is divided into offline and online. Offline segment dominated the market, with a market share of around 68.89% in 2023. This market share is attributed to the preference for glassware products, which reflect lifestyle. These glassware products are broadly found in specialty stores. These hyper stores and supermarkets offer several types of glassware products.
| Attribute | Description |
|---|---|
| Market Size | Revenue (USD Million) |
| Market size value in 2023 | USD 4,862.82 Million |
| Market size value in 2033 | USD 5,522.36 Million |
| CAGR (2024 to 2033) | 1.28% |
| Historical data | 2020-2022 |
| Base Year | 2023 |
| Forecast | 2024-2033 |
| Region | The regions analyzed for the market are Asia Pacific, Europe, South America, North America, and Middle East & Africa. Furthermore, the regions are further analyzed at the country level. |
| Segments | Product, Price Point, End User and Distribution Channel |
Europe region emerged as the largest market for the Glassware.
The market's growth will be influenced by high demand in the hospitality sector.
Preference for other alternatives could hamper the market growth.
More focus on styles and designs of glassware will provide huge opportunities to the market.
1. Introduction
1.1. Objectives of the Study
1.2. Market Definition
1.3. Research Scope
1.4. Currency
1.5. Key Target Audience
2. Research Methodology and Assumptions
3. Executive Summary
4. Premium Insights
4.1. Porter’s Five Forces Analysis
4.2. Value Chain Analysis
4.3. Top Investment Pockets
4.3.1. Market Attractiveness Analysis By Product
4.3.2. Market Attractiveness Analysis By Price Point
4.3.3. Market Attractiveness Analysis By Distribution Channel
4.3.4. Market Attractiveness Analysis By End User
4.3.5. Market Attractiveness Analysis By Region
4.4. Industry Trends
5. Market Dynamics
5.1. Market Evaluation
5.2. Drivers
5.2.1. High demand in the hospitality sector
5.3. Restraints
5.3.1. Preference for other alternatives
5.4. Opportunities
5.4.1. More focus on styles and designs of glassware
5.5. Challenges
5.5.1. Economic slowdown
6. Global Glassware Market Analysis and Forecast, By Product
6.1. Segment Overview
6.2. Tea Cup
6.3. Coffee Mug
6.4. Wine Glass
6.5. Beer Mug
6.6. Pitchers
6.7. Glass Jars
6.8. Others
7. Global Glassware Market Analysis and Forecast, By Price Point
7.1. Segment Overview
7.2. Premium
7.3. Medium
7.4. Economy
8. Global Glassware Market Analysis and Forecast, By Distribution Channel
8.1. Segment Overview
8.2. Offline
8.3. Online
9. Global Glassware Market Analysis and Forecast, By End User
9.1. Segment Overview
9.2. Household
9.3. Hotel & Restaurants
9.4. Café & Bars
9.5. Others
10. Global Glassware Market Analysis and Forecast, By Regional Analysis
10.1. Segment Overview
10.2. North America
10.2.1. U.S.
10.2.2. Canada
10.2.3. Mexico
10.3. Europe
10.3.1. Germany
10.3.2. France
10.3.3. U.K.
10.3.4. Italy
10.3.5. Spain
10.4. Asia-Pacific
10.4.1. Japan
10.4.2. China
10.4.3. India
10.5. South America
10.5.1. Brazil
10.6. Middle East and Africa
10.6.1. UAE
10.6.2. South Africa
11. Global Glassware Market-Competitive Landscape
11.1. Overview
11.2. Market Share of Key Players in Global Glassware Market
11.2.1. Global Company Market Share
11.2.2. North America Company Market Share
11.2.3. Europe Company Market Share
11.2.4. APAC Company Market Share
11.3. Competitive Situations and Trends
11.3.1. Product Launches and Developments
11.3.2. Partnerships, Collaborations, and Agreements
11.3.3. Mergers & Acquisitions
11.3.4. Expansions
12. Company Profiles
12.1. Sisecam
12.1.1. Business Overview
12.1.2. Company Snapshot
12.1.3. Company Market Share Analysis
12.1.4. Company Product Portfolio
12.1.5. Recent Developments
12.1.6. SWOT Analysis
12.2. Borosil Limited
12.2.1. Business Overview
12.2.2. Company Snapshot
12.2.3. Company Market Share Analysis
12.2.4. Company Product Portfolio
12.2.5. Recent Developments
12.2.6. SWOT Analysis
12.3. Garbo Glassware
12.3.1. Business Overview
12.3.2. Company Snapshot
12.3.3. Company Market Share Analysis
12.3.4. Company Product Portfolio
12.3.5. Recent Developments
12.3.6. SWOT Analysis
12.4. Villeroy & Boch AG
12.4.1. Business Overview
12.4.2. Company Snapshot
12.4.3. Company Market Share Analysis
12.4.4. Company Product Portfolio
12.4.5. Recent Developments
12.4.6. SWOT Analysis
12.5. Shandong Huapeng Glass Co., Ltd.
12.5.1. Business Overview
12.5.2. Company Snapshot
12.5.3. Company Market Share Analysis
12.5.4. Company Product Portfolio
12.5.5. Recent Developments
12.5.6. SWOT Analysis
12.6. Arc Online
12.6.1. Business Overview
12.6.2. Company Snapshot
12.6.3. Company Market Share Analysis
12.6.4. Company Product Portfolio
12.6.5. Recent Developments
12.6.6. SWOT Analysis
12.7. Lifetime Brands, Inc
12.7.1. Business Overview
12.7.2. Company Snapshot
12.7.3. Company Market Share Analysis
12.7.4. Company Product Portfolio
12.7.5. Recent Developments
12.7.6. SWOT Analysis
12.8. Steelite International
12.8.1. Business Overview
12.8.2. Company Snapshot
12.8.3. Company Market Share Analysis
12.8.4. Company Product Portfolio
12.8.5. Recent Developments
12.8.6. SWOT Analysis
12.9. Anchor Hocking Group, Inc
12.9.1. Business Overview
12.9.2. Company Snapshot
12.9.3. Company Market Share Analysis
12.9.4. Company Product Portfolio
12.9.5. Recent Developments
12.9.6. SWOT Analysis
12.10. Degrenne
12.10.1. Business Overview
12.10.2. Company Snapshot
12.10.3. Company Market Share Analysis
12.10.4. Company Product Portfolio
12.10.5. Recent Developments
12.10.6. SWOT Analysis
12.11. Lenox Corporation
12.11.1. Business Overview
12.11.2. Company Snapshot
12.11.3. Company Market Share Analysis
12.11.4. Company Product Portfolio
12.11.5. Recent Developments
12.11.6. SWOT Analysis
12.12. Taiwan Glass Industry Corporation
12.12.1. Business Overview
12.12.2. Company Snapshot
12.12.3. Company Market Share Analysis
12.12.4. Company Product Portfolio
12.12.5. Recent Developments
12.12.6. SWOT Analysis
List of Table
1. Global Glassware Market, By Product, 2020-2033 (USD Million)
2. Global Tea Cup, Glassware Market, By Region, 2020-2033 (USD Million)
3. Global Coffee Mug, Glassware Market, By Region, 2020-2033 (USD Million)
4. Global Wine Glass, Glassware Market, By Region, 2020-2033 (USD Million)
5. Global Beer Mug, Glassware Market, By Region, 2020-2033 (USD Million)
6. Global Pitchers, Glassware Market, By Region, 2020-2033 (USD Million)
7. Global Glass Jars, Glassware Market, By Region, 2020-2033 (USD Million)
8. Global Others, Glassware Market, By Region, 2020-2033 (USD Million)
9. Global Glassware Market, By Price Point, 2020-2033 (USD Million)
10. Global Premium, Glassware Market, By Region, 2020-2033 (USD Million)
11. Global Medium, Glassware Market, By Region, 2020-2033 (USD Million)
12. Global Economy, Glassware Market, By Region, 2020-2033 (USD Million)
13. Global Glassware Market, By Distribution Channel, 2020-2033 (USD Million)
14. Global Offline, Glassware Market, By Region, 2020-2033 (USD Million)
15. Global Online, Glassware Market, By Region, 2020-2033 (USD Million)
16. Global Glassware Market, By End User, 2020-2033 (USD Million)
17. Global Household, Glassware Market, By Region, 2020-2033 (USD Million)
18. Global Hotel & Restaurants, Glassware Market, By Region, 2020-2033 (USD Million)
19. Global Café & Bars, Glassware Market, By Region, 2020-2033 (USD Million)
20. Global Others, Glassware Market, By Region, 2020-2033 (USD Million)
21. North America Glassware Market, By Product, 2020-2033 (USD Million)
22. North America Glassware Market, By Price Point, 2020-2033 (USD Million)
23. North America Glassware Market, By Distribution Channel, 2020-2033 (USD Million)
24. North America Glassware Market, By End User, 2020-2033 (USD Million)
25. U.S. Glassware Market, By Product, 2020-2033 (USD Million)
26. U.S. Glassware Market, By Price Point, 2020-2033 (USD Million)
27. U.S. Glassware Market, By Distribution Channel, 2020-2033 (USD Million)
28. U.S. Glassware Market, By End User, 2020-2033 (USD Million)
29. Canada Glassware Market, By Product, 2020-2033 (USD Million)
30. Canada Glassware Market, By Price Point, 2020-2033 (USD Million)
31. Canada Glassware Market, By Distribution Channel, 2020-2033 (USD Million)
32. Canada Glassware Market, By End User, 2020-2033 (USD Million)
33. Mexico Glassware Market, By Product, 2020-2033 (USD Million)
34. Mexico Glassware Market, By Price Point, 2020-2033 (USD Million)
35. Mexico Glassware Market, By Distribution Channel, 2020-2033 (USD Million)
36. Mexico Glassware Market, By End User, 2020-2033 (USD Million)
37. Europe Glassware Market, By Product, 2020-2033 (USD Million)
38. Europe Glassware Market, By Price Point, 2020-2033 (USD Million)
39. Europe Glassware Market, By Distribution Channel, 2020-2033 (USD Million)
40. Europe Glassware Market, By End User, 2020-2033 (USD Million)
41. Germany Glassware Market, By Product, 2020-2033 (USD Million)
42. Germany Glassware Market, By Price Point, 2020-2033 (USD Million)
43. Germany Glassware Market, By Distribution Channel, 2020-2033 (USD Million)
44. Germany Glassware Market, By End User, 2020-2033 (USD Million)
45. France Glassware Market, By Product, 2020-2033 (USD Million)
46. France Glassware Market, By Price Point, 2020-2033 (USD Million)
47. France Glassware Market, By Distribution Channel, 2020-2033 (USD Million)
48. France Glassware Market, By End User, 2020-2033 (USD Million)
49. U.K. Glassware Market, By Product, 2020-2033 (USD Million)
50. U.K. Glassware Market, By Price Point, 2020-2033 (USD Million)
51. U.K. Glassware Market, By Distribution Channel, 2020-2033 (USD Million)
52. U.K. Glassware Market, By End User, 2020-2033 (USD Million)
53. Italy Glassware Market, By Product, 2020-2033 (USD Million)
54. Italy Glassware Market, By Price Point, 2020-2033 (USD Million)
55. Italy Glassware Market, By Distribution Channel, 2020-2033 (USD Million)
56. Italy Glassware Market, By End User, 2020-2033 (USD Million)
57. Spain Glassware Market, By Product, 2020-2033 (USD Million)
58. Spain Glassware Market, By Price Point, 2020-2033 (USD Million)
59. Spain Glassware Market, By Distribution Channel, 2020-2033 (USD Million)
60. Spain Glassware Market, By End User, 2020-2033 (USD Million)
61. Asia Pacific Glassware Market, By Product, 2020-2033 (USD Million)
62. Asia Pacific Glassware Market, By Price Point, 2020-2033 (USD Million)
63. Asia Pacific Glassware Market, By Distribution Channel, 2020-2033 (USD Million)
64. Asia Pacific Glassware Market, By End User, 2020-2033 (USD Million)
65. Japan Glassware Market, By Product, 2020-2033 (USD Million)
66. Japan Glassware Market, By Price Point, 2020-2033 (USD Million)
67. Japan Glassware Market, By Distribution Channel, 2020-2033 (USD Million)
68. Japan Glassware Market, By End User, 2020-2033 (USD Million)
69. China Glassware Market, By Product, 2020-2033 (USD Million)
70. China Glassware Market, By Price Point, 2020-2033 (USD Million)
71. China Glassware Market, By Distribution Channel, 2020-2033 (USD Million)
72. China Glassware Market, By End User, 2020-2033 (USD Million)
73. India Glassware Market, By Product, 2020-2033 (USD Million)
74. India Glassware Market, By Price Point, 2020-2033 (USD Million)
75. India Glassware Market, By Distribution Channel, 2020-2033 (USD Million)
76. India Glassware Market, By End User, 2020-2033 (USD Million)
77. South America Glassware Market, By Product, 2020-2033 (USD Million)
78. South America Glassware Market, By Price Point, 2020-2033 (USD Million)
79. South America Glassware Market, By Distribution Channel, 2020-2033 (USD Million)
80. South America Glassware Market, By End User, 2020-2033 (USD Million)
81. Brazil Glassware Market, By Product, 2020-2033 (USD Million)
82. Brazil Glassware Market, By Price Point, 2020-2033 (USD Million)
83. Brazil Glassware Market, By Distribution Channel, 2020-2033 (USD Million)
84. Brazil Glassware Market, By End User, 2020-2033 (USD Million)
85. Middle East and Africa Glassware Market, By Product, 2020-2033 (USD Million)
86. Middle East and Africa Glassware Market, By Price Point, 2020-2033 (USD Million)
87. Middle East and Africa Glassware Market, By Distribution Channel, 2020-2033 (USD Million)
88. Middle East and Africa Glassware Market, By End User, 2020-2033 (USD Million)
89. UAE Glassware Market, By Product, 2020-2033 (USD Million)
90. UAE Glassware Market, By Price Point, 2020-2033 (USD Million)
91. UAE Glassware Market, By Distribution Channel, 2020-2033 (USD Million)
92. UAE Glassware Market, By End User, 2020-2033 (USD Million)
93. South Africa Glassware Market, By Product, 2020-2033 (USD Million)
94. South Africa Glassware Market, By Price Point, 2020-2033 (USD Million)
95. South Africa Glassware Market, By Distribution Channel, 2020-2033 (USD Million)
96. South Africa Glassware Market, By End User, 2020-2033 (USD Million)
List of Figures
1. Global Glassware Market Segmentation
2. Global Glassware Market: Research Methodology
3. Market Size Estimation Methodology: Bottom-Up Approach
4. Market Size Estimation Methodology: Top-Down Approach
5. Data Triangulation
6. Porter’s Five Forces Analysis
7. Value Chain Analysis
8. Global Glassware Market Attractiveness Analysis By Product
9. Global Glassware Market Attractiveness Analysis By Price Point
10. Global Glassware Market Attractiveness Analysis By Distribution Channel
11. Global Glassware Market Attractiveness Analysis By End User
12. Global Glassware Market Attractiveness Analysis By Region
13. Global Glassware Market: Dynamics
14. Global Glassware Market Share By Product (2023 & 2033)
15. Global Glassware Market Share By Price Point (2023 & 2033)
16. Global Glassware Market Share By Distribution Channel (2023 & 2033)
17. Global Glassware Market Share By End User (2023 & 2033)
18. Global Glassware Market Share By Regions (2023 & 2033)
19. Global Glassware Market Share By Company (2023)
This study forecasts revenue at global, regional, and country levels from 2020 to 2033. The Brainy Insights has segmented the global Glassware market based on below mentioned segments:
Global Glassware Market by Product:
Global Glassware Market by Price Point:
Global Glassware Market by End User:
Global Glassware Market by Distribution Channel:
Global Glassware by Region:
Research has its special purpose to undertake marketing efficiently. In this competitive scenario, businesses need information across all industry verticals; the information about customer wants, market demand, competition, industry trends, distribution channels etc. This information needs to be updated regularly because businesses operate in a dynamic environment. Our organization, The Brainy Insights incorporates scientific and systematic research procedures in order to get proper market insights and industry analysis for overall business success. The analysis consists of studying the market from a miniscule level wherein we implement statistical tools which helps us in examining the data with accuracy and precision.
Our research reports feature both; quantitative and qualitative aspects for any market. Qualitative information for any market research process are fundamental because they reveal the customer needs and wants, usage and consumption for any product/service related to a specific industry. This in turn aids the marketers/investors in knowing certain perceptions of the customers. Qualitative research can enlighten about the different product concepts and designs along with unique service offering that in turn, helps define marketing problems and generate opportunities. On the other hand, quantitative research engages with the data collection process through interviews, e-mail interactions, surveys and pilot studies. Quantitative aspects for the market research are useful to validate the hypotheses generated during qualitative research method, explore empirical patterns in the data with the help of statistical tools, and finally make the market estimations.
The Brainy Insights offers comprehensive research and analysis, based on a wide assortment of factual insights gained through interviews with CXOs and global experts and secondary data from reliable sources. Our analysts and industry specialist assume vital roles in building up statistical tools and analysis models, which are used to analyse the data and arrive at accurate insights with exceedingly informative research discoveries. The data provided by our organization have proven precious to a diverse range of companies, facilitating them to address issues such as determining which products/services are the most appealing, whether or not customers use the product in the manner anticipated, the purchasing intentions of the market and many others.
Our research methodology encompasses an idyllic combination of primary and secondary initiatives. Key phases involved in this process are listed below:

The phase involves the gathering and collecting of market data and its related information with the help of different sources & research procedures.

The data procurement stage involves in data gathering and collecting through various data sources.
This stage involves in extensive research. These data sources includes:
Purchased Database: Purchased databases play a crucial role in estimating the market sizes irrespective of the domain. Our purchased database includes:
Primary Research: The Brainy Insights interacts with leading companies and experts of the concerned domain to develop the analyst team’s market understanding and expertise. It improves and substantiates every single data presented in the market reports. Primary research mainly involves in telephonic interviews, E-mail interactions and face-to-face interviews with the raw material providers, manufacturers/producers, distributors, & independent consultants. The interviews that we conduct provides valuable data on market size and industry growth trends prevailing in the market. Our organization also conducts surveys with the various industry experts in order to gain overall insights of the industry/market. For instance, in healthcare industry we conduct surveys with the pharmacists, doctors, surgeons and nurses in order to gain insights and key information of a medical product/device/equipment which the customers are going to usage. Surveys are conducted in the form of questionnaire designed by our own analyst team. Surveys plays an important role in primary research because surveys helps us to identify the key target audiences of the market. Additionally, surveys helps to identify the key target audience engaged with the market. Our survey team conducts the survey by targeting the key audience, thus gaining insights from them. Based on the perspectives of the customers, this information is utilized to formulate market strategies. Moreover, market surveys helps us to understand the current competitive situation of the industry. To be precise, our survey process typically involve with the 360 analysis of the market. This analytical process begins by identifying the prospective customers for a product or service related to the market/industry to obtain data on how a product/service could fit into customers’ lives.

Secondary Research: The secondary data sources includes information published by the on-profit organizations such as World bank, WHO, company fillings, investor presentations, annual reports, national government documents, statistical databases, blogs, articles, white papers and others. From the annual report, we analyse a company’s revenue to understand the key segment and market share of that organization in a particular region. We analyse the company websites and adopt the product mapping technique which is important for deriving the segment revenue. In the product mapping method, we select and categorize the products offered by the companies catering to domain specific market, deduce the product revenue for each of the companies so as to get overall estimation of the market size. We also source data and analyses trends based on information received from supply side and demand side intermediaries in the value chain. The supply side denotes the data gathered from supplier, distributor, wholesaler and the demand side illustrates the data gathered from the end customers for respective market domain.

The supply side for a domain specific market is analysed by:
The demand side for the market is estimated through:
In-house Library: Apart from these third-party sources, we have our in-house library of qualitative and quantitative information. Our in-house database includes market data for various industry and domains. These data are updated on regular basis as per the changing market scenario. Our library includes, historic databases, internal audit reports and archives.
Sometimes there are instances where there is no metadata or raw data available for any domain specific market. For those cases, we use our expertise to forecast and estimate the market size in order to generate comprehensive data sets. Our analyst team adopt a robust research technique in order to produce the estimates:
Data Synthesis: This stage involves the analysis & mapping of all the information obtained from the previous step. It also involves in scrutinizing the data for any discrepancy observed while data gathering related to the market. The data is collected with consideration to the heterogeneity of sources. Robust scientific techniques are in place for synthesizing disparate data sets and provide the essential contextual information that can orient market strategies. The Brainy Insights has extensive experience in data synthesis where the data passes through various stages:


Market Deduction & Formulation: The final stage comprises of assigning data points at appropriate market spaces so as to deduce feasible conclusions. Analyst perspective & subject matter expert based holistic form of market sizing coupled with industry analysis also plays a crucial role in this stage.
This stage involves in finalization of the market size and numbers that we have collected from data integration step. With data interpolation, it is made sure that there is no gap in the market data. Successful trend analysis is done by our analysts using extrapolation techniques, which provide the best possible forecasts for the market.
Data Validation & Market Feedback: Validation is the most important step in the process. Validation & re-validation via an intricately designed process helps us finalize data-points to be used for final calculations.

The Brainy Insights interacts with leading companies and experts of the concerned domain to develop the analyst team’s market understanding and expertise. It improves and substantiates every single data presented in the market reports. The data validation interview and discussion panels are typically composed of the most experienced industry members. The participants include, however, are not limited to:
Moreover, we always validate our data and findings through primary respondents from all the major regions we are working on.


Free Customization
Fortune 500 Clients
Free Yearly Update On Purchase Of Multi/Corporate License
Companies Served Till Date