- +1-315-215-1633
- sales@thebrainyinsights.com

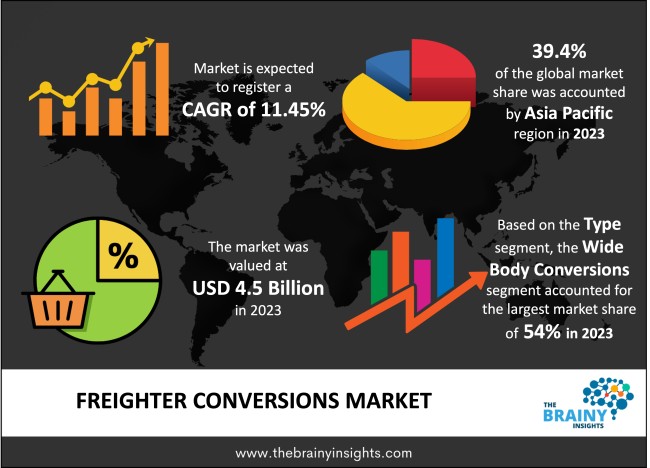
The global Freighter Conversions market was valued at USD 4.5 billion in 2023 and growing at a CAGR of 11.45% from 2024 to 2033. The market is expected to reach USD 13.30 billion by 2033. Increasing demand for aircraft facilities in the market and rapidly growing technoloigcal advancements globally will potentially drive the growth of the Freighter Conversions Market. Favourable government initiatives in the global market may drive the growth of the Freighter Conversions Market in the period forecasted.
Freighter conversions entail the conversion of passenger aircraft into cargo planes through substantial structural alterations. These modifications adapt the aircraft to carry cargo instead of passengers. Essential modifications include reinforcing the floor, integrating a spacious cargo door into the fuselage, and eliminating passenger features to establish an unobstructed cargo area. Additionally, upgrades to avionics and systems are often necessary to ensure compatibility with cargo operations.
Get an overview of this study by requesting a free sample
Increasing demand for aircraft facilities in the market – The growth in global trade and e-commerce has increased the need for efficient air cargo transportation, which in turn has boosted demand for freighter aircraft. To accommodate this demand, the expansion of conversion facilities now permits multiple aircraft to be converted from passenger to freighter (P2F) at the same time. This enhancement not only shortens the lead times for these conversions, allowing for quicker turnarounds, but also provides advantages to airlines and cargo operators. Additionally, the increased size of these conversion facilities improves their ability to handle a larger volume of aircraft conversions, aligning with the industry's expanding needs.
Lack of knowledge and skills of Freighter Conversions in the market– Converting passenger aircraft into freighters requires meticulous structural adjustments and strict adherence to aviation regulations. Without proficient engineers and technicians, there's a risk of subpar conversions that fail to meet safety and airworthiness standards. Such non-compliance could result in aircraft being grounded or facing operational restrictions, damaging the reputation of conversion providers.
Favourable government initiatives in the global market- Governments can incentivize airlines and cargo operators to invest in freighter conversions through financial support like tax incentives, subsidies, or grants. These incentives help alleviate the financial burden associated with conversion projects, rendering them more economically feasible and appealing to potential clients. Moreover, governments might allocate funds for research and development efforts aimed at enhancing conversion technologies and processes.
The regions analyzed for the market include North America, Europe, South America, Asia Pacific, the Middle East, and Africa. APAC emerged as the largest global Freighter Conversions market, accounting for 39.4% of the total market in the year 2023. Owing to rapidly growing e-commerce sector and abundance of manufacturing facilities in the region. Whereas North America exhibits the highest growth rate in the market owing to rapidly growing demand of air cargo services in the region.
APAC Region Freighter Conversions Market Share in 2023 - 39.4%
www.thebrainyinsights.com
Check the geographical analysis of this market by requesting a free sample
Wide body conversions has dominated the market accounting for 54% of the total market. Owing to rapid technological advances in the field of Freighter Conversions in the Wide Body Conversions Market. Whereas, Narrow Body Conversions is expected to provide a lucrative growth rate in the future, owing to increasing investments and rising government funding in the market.
Logistics company have dominated the Freighter Conversions market. Thereby acquiring 58.34% in the year 2023. Owing to rising government funding and rapidly growing investments in R&D by different market players. Airlines & Rental happen to be the fastest-growing segment within the market. Owing to increasing collaborations, in the global market.
| Attribute | Description |
|---|---|
| Market Size | Revenue (USD Billion) |
| Market size value in 2023 | USD 4.5 Billion |
| Market size value in 2033 | USD 13.30 Billion |
| CAGR (2024 to 2033) | 11.45% |
| Historical data | 2020-2022 |
| Base Year | 2023 |
| Forecast | 2024-2033 |
| Region | The regions analyzed for the market are Asia Pacific, Europe, South America, North America, and Middle East & Africa. Furthermore, the regions are further analyzed at the country level. |
| Segments | Type, Application |
As per The Brainy Insights, the size of the freighter conversions market was valued at USD 4.5 billion in 2023 to USD 13.30 billion by 2033.
The global freighter conversions market is growing at a CAGR of 11.45% during the forecast period 2024-2033.
The Asia Pacific region emerged as the largest market for the freighter conversions.
The increasing demand for aircraft facilities in the market will influence the market's growth.
1. Introduction
1.1. Objectives of the Study
1.2. Market Definition
1.3. Research Scope
1.4. Currency
1.5. Key Target Audience
2. Research Methodology and Assumptions
3. Executive Summary
4. Premium Insights
4.1. Porter’s Five Forces Analysis
4.2. Value Chain Analysis
4.3. Top Investment Pockets
4.3.1. Market Attractiveness Analysis by Type
4.3.2. Market Attractiveness Analysis by Application
4.3.3. Market Attractiveness Analysis by Region
4.4. Industry Trends
5. Market Dynamics
5.1. Market Evaluation
5.2. Drivers
5.2.1. Increasing demand for aircraft facilities in the market
5.2.2. Rapidly growing technoloigcal advancements globally
5.3. Restraints
5.3.1. Lack of knowledge and skills of Freighter Conversions in the market
5.4. Opportunities
5.4.1. Favourable government initiatives in the global market
5.5. Challenges
5.5.1. Increasing number of market players
6. Global Freighter Conversions Market Analysis and Forecast, By Type
6.1. Segment Overview
6.2. Wide body Conversions
6.3. Narrow body Conversions
7. Global Freighter Conversions Market Analysis and Forecast, By Application
7.1. Segment Overview
7.2. Logistics Company
7.3. Airlines & Rental
7.4. Others
8. Global Freighter Conversions Market Analysis and Forecast, By Regional Analysis
8.1. Segment Overview
8.2. North America
8.2.1. U.S.
8.2.2. Canada
8.2.3. Mexico
8.3. Europe
8.3.1. Germany
8.3.2. France
8.3.3. U.K.
8.3.4. Italy
8.3.5. Spain
8.4. Asia-Pacific
8.4.1. Japan
8.4.2. China
8.4.3. India
8.5. South America
8.5.1. Brazil
8.6. Middle East and Africa
8.6.1. UAE
8.6.2. South Africa
9. Global Freighter Conversions Market-Competitive Landscape
9.1. Overview
9.2. Market Share of Key Players in Global Freighter Conversions Market
9.2.1. Global Company Market Share
9.2.2. North America Company Market Share
9.2.3. Europe Company Market Share
9.2.4. APAC Company Market Share
9.3. Competitive Situations and Trends
9.3.1. Product Launches and Developments
9.3.2. Partnerships, Collaborations, and Agreements
9.3.3. Mergers & Acquisitions
9.3.4. Expansions
10. Company Profiles
10.1. Commercial Aircraft Corporation of China Ltd
10.1.1. Business Overview
10.1.2. Company Snapshot
10.1.3. Company Market Share Analysis
10.1.4. Company Product Portfolio
10.1.5. Recent Developments
10.1.6. SWOT Analysis
10.2. Airbus Group
10.2.1. Business Overview
10.2.2. Company Snapshot
10.2.3. Company Market Share Analysis
10.2.4. Company Product Portfolio
10.2.5. Recent Developments
10.2.6. SWOT Analysis
10.3. General Electric
10.3.1. Business Overview
10.3.2. Company Snapshot
10.3.3. Company Market Share Analysis
10.3.4. Company Product Portfolio
10.3.5. Recent Developments
10.3.6. SWOT Analysis
10.4. The Boeing Company
10.4.1. Business Overview
10.4.2. Company Snapshot
10.4.3. Company Market Share Analysis
10.4.4. Company Product Portfolio
10.4.5. Recent Developments
10.4.6. SWOT Analysis
10.5. Lockheed Martin Corporation
10.5.1. Business Overview
10.5.2. Company Snapshot
10.5.3. Company Market Share Analysis
10.5.4. Company Product Portfolio
10.5.5. Recent Developments
10.5.6. SWOT Analysis
10.6. General Dynamics Corporation
10.6.1. Business Overview
10.6.2. Company Snapshot
10.6.3. Company Market Share Analysis
10.6.4. Company Product Portfolio
10.6.5. Recent Developments
10.6.6. SWOT Analysis
10.7. Embraer S.A.
10.7.1. Business Overview
10.7.2. Company Snapshot
10.7.3. Company Market Share Analysis
10.7.4. Company Product Portfolio
10.7.5. Recent Developments
10.7.6. SWOT Analysis
10.8. Raytheon Technologies Corporation
10.8.1. Business Overview
10.8.2. Company Snapshot
10.8.3. Company Market Share Analysis
10.8.4. Company Product Portfolio
10.8.5. Recent Developments
10.8.6. SWOT Analysis
10.9. Textron Inc
10.9.1. Business Overview
10.9.2. Company Snapshot
10.9.3. Company Market Share Analysis
10.9.4. Company Product Portfolio
10.9.5. Recent Developments
10.9.6. SWOT Analysis
10.10. Dassault Aviation
10.10.1. Business Overview
10.10.2. Company Snapshot
10.10.3. Company Market Share Analysis
10.10.4. Company Product Portfolio
10.10.5. Recent Developments
10.10.6. SWOT Analysis
List of Table
1. Global Freighter Conversions Market, By Type, 2020-2033 (USD Billion)
2. Global Wide body Conversions, Freighter Conversions Market, By Region, 2020-2033 (USD Billion)
3. Global Narrow body Conversions, Freighter Conversions Market, By Region, 2020-2033 (USD Billion)
4. Global Freighter Conversions Market, By Application, 2020-2033 (USD Billion)
5. Global Logistics Company, Freighter Conversions Market, By Region, 2020-2033 (USD Billion)
6. Global Airlines & Rental, Freighter Conversions Market, By Region, 2020-2033 (USD Billion)
7. Global Others, Freighter Conversions Market, By Region, 2020-2033 (USD Billion)
8. Global Freighter Conversions Market, By Region, 2020-2033 (USD Billion)
9. North America Freighter Conversions Market, By Type, 2020-2033 (USD Billion)
10. North America Freighter Conversions Market, By Application, 2020-2033 (USD Billion)
11. U.S. Freighter Conversions Market, By Type, 2020-2033 (USD Billion)
12. U.S. Freighter Conversions Market, By Application, 2020-2033 (USD Billion)
13. Canada Freighter Conversions Market, By Type, 2020-2033 (USD Billion)
14. Canada Freighter Conversions Market, By Application, 2020-2033 (USD Billion)
15. Mexico Freighter Conversions Market, By Type, 2020-2033 (USD Billion)
16. Mexico Freighter Conversions Market, By Application, 2020-2033 (USD Billion)
17. Europe Freighter Conversions Market, By Type, 2020-2033 (USD Billion)
18. Europe Freighter Conversions Market, By Application, 2020-2033 (USD Billion)
19. Germany Freighter Conversions Market, By Type, 2020-2033 (USD Billion)
20. Germany Freighter Conversions Market, By Application, 2020-2033 (USD Billion)
21. France Freighter Conversions Market, By Type, 2020-2033 (USD Billion)
22. France Freighter Conversions Market, By Application, 2020-2033 (USD Billion)
23. U.K. Freighter Conversions Market, By Type, 2020-2033 (USD Billion)
24. U.K. Freighter Conversions Market, By Application, 2020-2033 (USD Billion)
25. Italy Freighter Conversions Market, By Type, 2020-2033 (USD Billion)
26. Italy Freighter Conversions Market, By Application, 2020-2033 (USD Billion)
27. Spain Freighter Conversions Market, By Type, 2020-2033 (USD Billion)
28. Spain Freighter Conversions Market, By Application, 2020-2033 (USD Billion)
29. Asia Pacific Freighter Conversions Market, By Type, 2020-2033 (USD Billion)
30. Asia Pacific Freighter Conversions Market, By Application, 2020-2033 (USD Billion)
31. Japan Freighter Conversions Market, By Type, 2020-2033 (USD Billion)
32. Japan Freighter Conversions Market, By Application, 2020-2033 (USD Billion)
33. China Freighter Conversions Market, By Type, 2020-2033 (USD Billion)
34. China Freighter Conversions Market, By Application, 2020-2033 (USD Billion)
35. India Freighter Conversions Market, By Type, 2020-2033 (USD Billion)
36. India Freighter Conversions Market, By Application, 2020-2033 (USD Billion)
37. South America Freighter Conversions Market, By Type, 2020-2033 (USD Billion)
38. South America Freighter Conversions Market, By Application, 2020-2033 (USD Billion)
39. Brazil Freighter Conversions Market, By Type, 2020-2033 (USD Billion)
40. Brazil Freighter Conversions Market, By Application, 2020-2033 (USD Billion)
41. Middle East and Africa Freighter Conversions Market, By Type, 2020-2033 (USD Billion)
42. Middle East and Africa Freighter Conversions Market, By Application, 2020-2033 (USD Billion)
43. UAE Freighter Conversions Market, By Type, 2020-2033 (USD Billion)
44. UAE Freighter Conversions Market, By Application, 2020-2033 (USD Billion)
45. South Africa Freighter Conversions Market, By Type, 2020-2033 (USD Billion)
46. South Africa Freighter Conversions Market, By Application, 2020-2033 (USD Billion)
List of Figures
1. Global Freighter Conversions Market Segmentation
2. Global Freighter Conversions Market: Research Methodology
3. Market Size Estimation Methodology: Bottom-Up Approach
4. Market Size Estimation Methodology: Top-Down Approach
5. Data Triangulation
6. Porter’s Five Forces Analysis
7. Value Chain Analysis
8. Global Freighter Conversions Market Attractiveness Analysis by Type
9. Global Freighter Conversions Market Attractiveness Analysis by Application
10. Global Freighter Conversions Market Attractiveness Analysis by Region
11. Global Freighter Conversions Market: Dynamics
12. Global Freighter Conversions Market Share by Type (2023 & 2033)
13. Global Freighter Conversions Market Share by Application (2023 & 2033)
14. Global Freighter Conversions Market Share by Regions (2023 & 2033)
15. Global Freighter Conversions Market Share by Company (2023)
This study forecasts revenue at global, regional, and country levels from 2020 to 2033. The Brainy Insights has segmented the global freighter conversions market based on below-mentioned segments:
Global Freighter Conversions Market by Type:
Global Freighter Conversions Market by Application:
Global Freighter Conversions Market by Region:
Research has its special purpose to undertake marketing efficiently. In this competitive scenario, businesses need information across all industry verticals; the information about customer wants, market demand, competition, industry trends, distribution channels etc. This information needs to be updated regularly because businesses operate in a dynamic environment. Our organization, The Brainy Insights incorporates scientific and systematic research procedures in order to get proper market insights and industry analysis for overall business success. The analysis consists of studying the market from a miniscule level wherein we implement statistical tools which helps us in examining the data with accuracy and precision.
Our research reports feature both; quantitative and qualitative aspects for any market. Qualitative information for any market research process are fundamental because they reveal the customer needs and wants, usage and consumption for any product/service related to a specific industry. This in turn aids the marketers/investors in knowing certain perceptions of the customers. Qualitative research can enlighten about the different product concepts and designs along with unique service offering that in turn, helps define marketing problems and generate opportunities. On the other hand, quantitative research engages with the data collection process through interviews, e-mail interactions, surveys and pilot studies. Quantitative aspects for the market research are useful to validate the hypotheses generated during qualitative research method, explore empirical patterns in the data with the help of statistical tools, and finally make the market estimations.
The Brainy Insights offers comprehensive research and analysis, based on a wide assortment of factual insights gained through interviews with CXOs and global experts and secondary data from reliable sources. Our analysts and industry specialist assume vital roles in building up statistical tools and analysis models, which are used to analyse the data and arrive at accurate insights with exceedingly informative research discoveries. The data provided by our organization have proven precious to a diverse range of companies, facilitating them to address issues such as determining which products/services are the most appealing, whether or not customers use the product in the manner anticipated, the purchasing intentions of the market and many others.
Our research methodology encompasses an idyllic combination of primary and secondary initiatives. Key phases involved in this process are listed below:

The phase involves the gathering and collecting of market data and its related information with the help of different sources & research procedures.

The data procurement stage involves in data gathering and collecting through various data sources.
This stage involves in extensive research. These data sources includes:
Purchased Database: Purchased databases play a crucial role in estimating the market sizes irrespective of the domain. Our purchased database includes:
Primary Research: The Brainy Insights interacts with leading companies and experts of the concerned domain to develop the analyst team’s market understanding and expertise. It improves and substantiates every single data presented in the market reports. Primary research mainly involves in telephonic interviews, E-mail interactions and face-to-face interviews with the raw material providers, manufacturers/producers, distributors, & independent consultants. The interviews that we conduct provides valuable data on market size and industry growth trends prevailing in the market. Our organization also conducts surveys with the various industry experts in order to gain overall insights of the industry/market. For instance, in healthcare industry we conduct surveys with the pharmacists, doctors, surgeons and nurses in order to gain insights and key information of a medical product/device/equipment which the customers are going to usage. Surveys are conducted in the form of questionnaire designed by our own analyst team. Surveys plays an important role in primary research because surveys helps us to identify the key target audiences of the market. Additionally, surveys helps to identify the key target audience engaged with the market. Our survey team conducts the survey by targeting the key audience, thus gaining insights from them. Based on the perspectives of the customers, this information is utilized to formulate market strategies. Moreover, market surveys helps us to understand the current competitive situation of the industry. To be precise, our survey process typically involve with the 360 analysis of the market. This analytical process begins by identifying the prospective customers for a product or service related to the market/industry to obtain data on how a product/service could fit into customers’ lives.

Secondary Research: The secondary data sources includes information published by the on-profit organizations such as World bank, WHO, company fillings, investor presentations, annual reports, national government documents, statistical databases, blogs, articles, white papers and others. From the annual report, we analyse a company’s revenue to understand the key segment and market share of that organization in a particular region. We analyse the company websites and adopt the product mapping technique which is important for deriving the segment revenue. In the product mapping method, we select and categorize the products offered by the companies catering to domain specific market, deduce the product revenue for each of the companies so as to get overall estimation of the market size. We also source data and analyses trends based on information received from supply side and demand side intermediaries in the value chain. The supply side denotes the data gathered from supplier, distributor, wholesaler and the demand side illustrates the data gathered from the end customers for respective market domain.

The supply side for a domain specific market is analysed by:
The demand side for the market is estimated through:
In-house Library: Apart from these third-party sources, we have our in-house library of qualitative and quantitative information. Our in-house database includes market data for various industry and domains. These data are updated on regular basis as per the changing market scenario. Our library includes, historic databases, internal audit reports and archives.
Sometimes there are instances where there is no metadata or raw data available for any domain specific market. For those cases, we use our expertise to forecast and estimate the market size in order to generate comprehensive data sets. Our analyst team adopt a robust research technique in order to produce the estimates:
Data Synthesis: This stage involves the analysis & mapping of all the information obtained from the previous step. It also involves in scrutinizing the data for any discrepancy observed while data gathering related to the market. The data is collected with consideration to the heterogeneity of sources. Robust scientific techniques are in place for synthesizing disparate data sets and provide the essential contextual information that can orient market strategies. The Brainy Insights has extensive experience in data synthesis where the data passes through various stages:


Market Deduction & Formulation: The final stage comprises of assigning data points at appropriate market spaces so as to deduce feasible conclusions. Analyst perspective & subject matter expert based holistic form of market sizing coupled with industry analysis also plays a crucial role in this stage.
This stage involves in finalization of the market size and numbers that we have collected from data integration step. With data interpolation, it is made sure that there is no gap in the market data. Successful trend analysis is done by our analysts using extrapolation techniques, which provide the best possible forecasts for the market.
Data Validation & Market Feedback: Validation is the most important step in the process. Validation & re-validation via an intricately designed process helps us finalize data-points to be used for final calculations.

The Brainy Insights interacts with leading companies and experts of the concerned domain to develop the analyst team’s market understanding and expertise. It improves and substantiates every single data presented in the market reports. The data validation interview and discussion panels are typically composed of the most experienced industry members. The participants include, however, are not limited to:
Moreover, we always validate our data and findings through primary respondents from all the major regions we are working on.


Free Customization
Fortune 500 Clients
Free Yearly Update On Purchase Of Multi/Corporate License
Companies Served Till Date