- +1-315-215-1633
- sales@thebrainyinsights.com

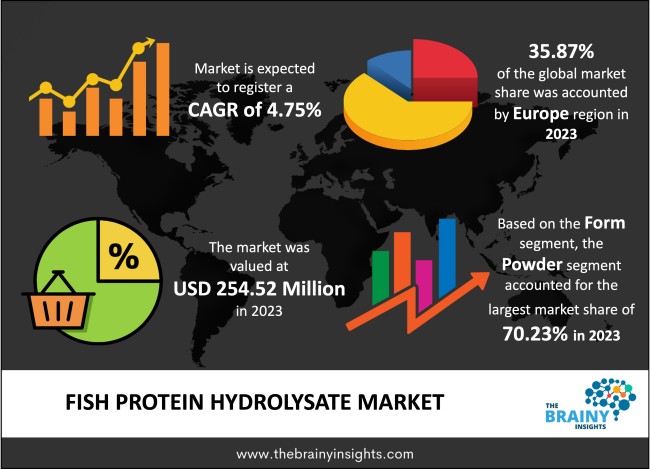
The global Fish Protein Hydrolysate market was valued at USD 254.52 Million in 2023 and growing at a CAGR of 4.75% from 2024 to 2033. The market is expected to reach USD 404.81 Million by 2033. Fish protein hydrolysate has a good water-holding capacity, helps in growth performance, and provides nutritious feed for livestock species like cattle, poultry, equine, and swine. It is a protein sourced from fish meat or fish processing by-products using enzymatic or chemical processes. Enzymatically produced hydrolysates are broadly accepted, and they consist of a mixture of peptides in different sizes and free amino acids. Fish protein hydrolysates are present in many forms but are broadly available as amorphous powders and are hygroscopic. It consists of more than 81% to 93% protein, 3% to 8% ash, 1% to 8% moisture and less than 5% of fat. Fish protein hydrolysate (FPH) is broadly manufactured using lean fish species that have no commercial values or use processing waste products. It has broad applications as an emulsifier, food binder, gelling agent and nutritional supplement. These factors are driving the growth of the Fish Protein Hydrolysate market.
The breakdown of the fish protein product is called fish protein hydrolysate, which has smaller peptides and amino acids. It consists of several bioactive peptides and amino acids, which have shown benefits to human health, and animal feed is a supplement. Fish protein hydrolysates are broadly used in aquaculture feeds because they have better protein content and perfect amino acid balance for marine animals. Also, compared with other plants and animals, Fish is considered a good source of protein. Earlier, fish protein hydrolysate was only used as animal feed. As people became more aware of the high protein content of Fish, they started using it in several sectors. Hence, the fish protein hydrolysate is now used in many products like food & beverages, medicines, cosmetics, nutraceuticals, pet food and animal & poultry feed. Also, the proteins that are found in fish change based on the species. Based on one of the studies, the world population will cross 9.7 billion by 2050, and there will be a growing need for nutrition and food for such a large population. The food supply must increase by 25% to 70% to feed such a large population. Fish is considered one of the crucial food sources; hence, it can broadly contribute to maintaining human nutrition and the global food supply. It is considered a good source of myriad micronutrients and nutrients like crucial amino acids, health-boosting omega-3 acids or LC-PUFA, high-quality protein, and important minerals like iodine, iron, zinc, calcium, phosphorous, selenium, vitamins A and B, and D, etc. Fish, hence, become an important component in many diets worldwide. Fish is considered a good source of protein; hence, the demand for fish protein hydrolysate (FPH) is growing. FPH is derived from the breakdown of fish protein, which consists of peptides and smaller amino acids. FPH is generally derived from treating fish meat or its byproducts with trypsin, pepsin, alcalase, chymotrypsin or other similar enzymes under defined pH and temperature conditions. FPH is a bioactive ingredient that can be used as organic fertilizer for plants. It has broad application in pharmaceutical supplements and food processing as it is rich in protein and crucial vitamins. All these factors are driving the Fish Protein Hydrolysate market.
Get an overview of this study by requesting a free sample
The benefit of FPH as aquafeed formulation – Fish protein hydrolysates have myriad physicochemical characteristics like high solubility, emulsifying properties, foaming properties, water holding and fat building capacity, etc, which help in significantly enhancing the palatability of the feed along with the increase in the biological nutrient uptake of animals. Also, FPH-derived peptides give benefits like immunomodulatory, antihypertensive, antioxidant, antimicrobial and anticancer properties, specifically through in-vivo intake. Also, in aquaculture activities, the use of peptide-rich FPH in the fish diets has shown an improvement in growth performance, higher antioxidant activities, improved utilization of nutrients and better immune response in fish, especially larvae and juveniles. All these factors are driving the Fish Protein Hydrolysate market.
Shortage of quality materials– There is a shortage of quality materials such as Atlantic salmon, tuna, etc., hampering the fish protein hydrolysate. Atlantic salmon are generally found near the shores of Scandinavian countries such as Sweden, Norway, Denmark, etc. Similarly, it is broadly preferred from the sea of Japan. These fish are difficult to get and highly biodegradable; therefore, they can be stored, processed, and sold fast to avoid spoilage. Also, there are obstructions in the transportation of fresh food. There is also a limitation of the supply chain. All these factors are acting as restraints for the market.
Demand from several sectors– Fish protein hydrolysate has fast absorption properties, which help develop lean muscle mass and decrease the risk of hypertension and high blood pressure among consumers. It is broadly used in protein and sports nutrition supplements. It also has its application in the treatment of irritable bowel syndrome (IBS) and Crohn’s disease. It is also used in hypoallergenic protein food for infants with celiac disease and lactose and gluten intolerance. FPH is used as a cryoprotectant in animal and aquaculture feed and helps prevent the spreading of infectious diseases. It also boosts animal immunity against fungi, bacteria, parasites and viruses. It is also considered a good ingredient for skincare and haircare routines. The cosmetic sector is using FPH for the rejuvenation and improvement in the texture of skin and hair. All these factors would, in turn, drive the Fish Protein Hydrolysate market in the forecasting period.
The regions analyzed for the market include North America, Europe, South America, Asia Pacific, the Middle East, and Africa. Europe emerged as the largest market for the global Fish Protein Hydrolysate market, with a 35.87% share of the market revenue in 2023. This market share is attributed to the surge in the humanization trend of pets. People in the region prefer to have pets and treat them as family members. This trend is very common in all the European countries. Hence, the demand for the FPH is growing for animal feed and pet food products. It helps enhance the digestive process of animals and ensures complete health. It is broadly used in premium pet food products and animal feeds. All these factors are driving the Fish Protein Hydrolysate market in the region.
Europe Region Fish Protein Hydrolysate Market Share in 2023 - 35.87%
www.thebrainyinsights.com
Check the geographical analysis of this market by requesting a free sample
The form segment is divided into powder, paste and liquid. The powder segment dominated the market, with a market share of around 70.23% in 2023. This significant market share is attributed to its broad use in making pharmaceutical-grade protein powder. These are economical in comparison to whey protein powder. Also, these FPH powders are good sources of amino acids, which are highly soluble in water; thus, there is more demand for nutraceutical and pharmaceutical formulations.
The technology segment is divided into enzymatic hydrolysis, acid hydrolysis and autolytic hydrolysis. Enzymatic hydrolysis segment dominated the market, with a market share of around 82.67% in 2023. This market share is attributed to the lower contamination and less use of heavy metals. This process retains the crucial nutrients and neutral taste, decreasing the reaction time. As it retains the important nutrients, this process is broadly used.
The application segment is divided into pharmaceuticals, food industries, animal feed industries, agriculture and others. Animal Feed Industries segment dominated the market, with a market share of around 57.89% in 2023. This market share is attributed to growing contagious diseases in livestock. Hence, the demand for supplemental feed additives, such as cattle and cows, is growing to improve livestock immunity. FPH also enhance feed effectiveness, which helps in increasing the amount of meat, milk and egg production and their quality.
The source segment is divided into salmon, tuna, anchovy, herring and others. Tuna segment dominated the market, with a market share of around 34.09% in 2023. This market share is attributed to the high level of crucial amino acids in the tuna-based FPH. Hence, it has become an important ingredient in products that support muscle growth and recovery. FPH derived from tuna fish is rich in antioxidants and thus helps protect against oxidative stress and free radical damage. It is broadly used in dietary supplements and sports nutritional products.
| Attribute | Description |
|---|---|
| Market Size | Revenue (USD Million) |
| Market size value in 2023 | USD 254.52 Million |
| Market size value in 2033 | USD 404.81 Million |
| CAGR (2024 to 2033) | 4.75% |
| Historical data | 2020-2022 |
| Base Year | 2023 |
| Forecast | 2024-2033 |
| Region | The regions analyzed for the market are Asia Pacific, Europe, South America, North America, and Middle East & Africa. Furthermore, the regions are further analyzed at the country level. |
| Segments | Form, Technology, Application and Source |
Europe region emerged as the largest market for the Fish Protein Hydrolysate.
The market's growth will be influenced by the benefit of FPH as aquafeed formulation.
Shortage of quality materials could hamper the market growth.
Demand from several sectors will provide huge opportunities to the market.
Key players are Biomega, Janatha Fish Meal & Oil Products, Diana Group (Symrise), Copalis, Scanbio Marine Group AS, Hofseth BioCare ASA, Bio-marine Ingredients Ireland, Shenzhen Taier, Neptune’s Harvest, Omega Protein Corporation and Pelagia among others.
1. Introduction
1.1. Objectives of the Study
1.2. Market Definition
1.3. Research Scope
1.4. Currency
1.5. Key Target Audience
2. Research Methodology and Assumptions
3. Executive Summary
4. Premium Insights
4.1. Porter’s Five Forces Analysis
4.2. Value Chain Analysis
4.3. Top Investment Pockets
4.3.1. Market Attractiveness Analysis By Form
4.3.2. Market Attractiveness Analysis By Technology
4.3.3. Market Attractiveness Analysis By Application
4.3.4. Market Attractiveness Analysis By Source
4.3.5. Market Attractiveness Analysis By Region
4.4. Industry Trends
5. Market Dynamics
5.1. Market Evaluation
5.2. Drivers
5.2.1. The benefit of FPH as aquafeed formulation
5.3. Restraints
5.3.1. Shortage of quality materials
5.4. Opportunities
5.4.1. Demand from several sectors
5.5. Challenges
5.5.1. Economic slowdown
6. Global Fish Protein Hydrolysate Market Analysis and Forecast, By Form
6.1. Segment Overview
6.2. Powder
6.3. Paste
6.4. Liquid
7. Global Fish Protein Hydrolysate Market Analysis and Forecast, By Technology
7.1. Segment Overview
7.2. Enzymatic Hydrolysis
7.3. Acid Hydrolysis
7.4. Autolytic Hydrolysis
8. Global Fish Protein Hydrolysate Market Analysis and Forecast, By Application
8.1. Segment Overview
8.2. Pharmaceuticals
8.3. Food Industries
8.4. Animal Feed Industries
8.5. Agriculture
8.6. Others
9. Global Fish Protein Hydrolysate Market Analysis and Forecast, By Source
9.1. Segment Overview
9.2. Salmon
9.3. Tuna
9.4. Anchovy
9.5. Herring
9.6. Others
10. Global Fish Protein Hydrolysate Market Analysis and Forecast, By Regional Analysis
10.1. Segment Overview
10.2. North America
10.2.1. U.S.
10.2.2. Canada
10.2.3. Mexico
10.3. Europe
10.3.1. Germany
10.3.2. France
10.3.3. U.K.
10.3.4. Italy
10.3.5. Spain
10.4. Asia-Pacific
10.4.1. Japan
10.4.2. China
10.4.3. India
10.5. South America
10.5.1. Brazil
10.6. Middle East and Africa
10.6.1. UAE
10.6.2. South Africa
11. Global Fish Protein Hydrolysate Market-Competitive Landscape
11.1. Overview
11.2. Market Share of Key Players in Global Fish Protein Hydrolysate Market
11.2.1. Global Company Market Share
11.2.2. North America Company Market Share
11.2.3. Europe Company Market Share
11.2.4. APAC Company Market Share
11.3. Competitive Situations and Trends
11.3.1. Product Launches and Developments
11.3.2. Partnerships, Collaborations, and Agreements
11.3.3. Mergers & Acquisitions
11.3.4. Expansions
12. Company Profiles
12.1. Biomega
12.1.1. Business Overview
12.1.2. Company Snapshot
12.1.3. Company Market Share Analysis
12.1.4. Company Product Portfolio
12.1.5. Recent Developments
12.1.6. SWOT Analysis
12.2. Janatha Fish Meal & Oil Products
12.2.1. Business Overview
12.2.2. Company Snapshot
12.2.3. Company Market Share Analysis
12.2.4. Company Product Portfolio
12.2.5. Recent Developments
12.2.6. SWOT Analysis
12.3. Diana Group (Symrise)
12.3.1. Business Overview
12.3.2. Company Snapshot
12.3.3. Company Market Share Analysis
12.3.4. Company Product Portfolio
12.3.5. Recent Developments
12.3.6. SWOT Analysis
12.4. Copalis
12.4.1. Business Overview
12.4.2. Company Snapshot
12.4.3. Company Market Share Analysis
12.4.4. Company Product Portfolio
12.4.5. Recent Developments
12.4.6. SWOT Analysis
12.5. Scanbio Marine Group AS
12.5.1. Business Overview
12.5.2. Company Snapshot
12.5.3. Company Market Share Analysis
12.5.4. Company Product Portfolio
12.5.5. Recent Developments
12.5.6. SWOT Analysis
12.6. Hofseth BioCare ASA
12.6.1. Business Overview
12.6.2. Company Snapshot
12.6.3. Company Market Share Analysis
12.6.4. Company Product Portfolio
12.6.5. Recent Developments
12.6.6. SWOT Analysis
12.7. Bio-marine Ingredients Ireland
12.7.1. Business Overview
12.7.2. Company Snapshot
12.7.3. Company Market Share Analysis
12.7.4. Company Product Portfolio
12.7.5. Recent Developments
12.7.6. SWOT Analysis
12.8. Shenzhen Taier
12.8.1. Business Overview
12.8.2. Company Snapshot
12.8.3. Company Market Share Analysis
12.8.4. Company Product Portfolio
12.8.5. Recent Developments
12.8.6. SWOT Analysis
12.9. Neptune’s Harvest
12.9.1. Business Overview
12.9.2. Company Snapshot
12.9.3. Company Market Share Analysis
12.9.4. Company Product Portfolio
12.9.5. Recent Developments
12.9.6. SWOT Analysis
12.10. Omega Protein Corporation
12.10.1. Business Overview
12.10.2. Company Snapshot
12.10.3. Company Market Share Analysis
12.10.4. Company Product Portfolio
12.10.5. Recent Developments
12.10.6. SWOT Analysis
12.11. Pelagia
12.11.1. Business Overview
12.11.2. Company Snapshot
12.11.3. Company Market Share Analysis
12.11.4. Company Product Portfolio
12.11.5. Recent Developments
12.11.6. SWOT Analysis
List of Table
1. Global Fish Protein Hydrolysate Market, By Form, 2020-2033 (USD Million)
2. Global Powder, Fish Protein Hydrolysate Market, By Region, 2020-2033 (USD Million)
3. Global Paste, Fish Protein Hydrolysate Market, By Region, 2020-2033 (USD Million)
4. Global Liquid, Fish Protein Hydrolysate Market, By Region, 2020-2033 (USD Million)
5. Global Fish Protein Hydrolysate Market, By Application, 2020-2033 (USD Million)
6. Global Pharmaceuticals, Fish Protein Hydrolysate Market, By Region, 2020-2033 (USD Million)
7. Global Food Industries, Fish Protein Hydrolysate Market, By Region, 2020-2033 (USD Million)
8. Global Animal Feed Industries, Fish Protein Hydrolysate Market, By Region, 2020-2033 (USD Million)
9. Global Agriculture, Fish Protein Hydrolysate Market, By Region, 2020-2033 (USD Million)
10. Global Others, Fish Protein Hydrolysate Market, By Region, 2020-2033 (USD Million)
11. Global Fish Protein Hydrolysate Market, By Technology, 2020-2033 (USD Million)
12. Global Enzymatic Hydrolysis, Fish Protein Hydrolysate Market, By Region, 2020-2033 (USD Million)
13. Global Acid Hydrolysis, Fish Protein Hydrolysate Market, By Region, 2020-2033 (USD Million)
14. Global Autolytic Hydrolysis, Fish Protein Hydrolysate Market, By Region, 2020-2033 (USD Million)
15. Global Fish Protein Hydrolysate Market, By Source, 2020-2033 (USD Million)
16. Global Salmon, Fish Protein Hydrolysate Market, By Region, 2020-2033 (USD Million)
17. Global Tuna, Fish Protein Hydrolysate Market, By Region, 2020-2033 (USD Million)
18. Global Anchovy, Fish Protein Hydrolysate Market, By Region, 2020-2033 (USD Million)
19. Global Herring, Fish Protein Hydrolysate Market, By Region, 2020-2033 (USD Million)
20. Global Others, Fish Protein Hydrolysate Market, By Region, 2020-2033 (USD Million)
21. North America Fish Protein Hydrolysate Market, By Form, 2020-2033 (USD Million)
22. North America Fish Protein Hydrolysate Market, By Application, 2020-2033 (USD Million)
23. North America Fish Protein Hydrolysate Market, By Technology, 2020-2033 (USD Million)
24. North America Fish Protein Hydrolysate Market, By Source, 2020-2033 (USD Million)
25. U.S. Fish Protein Hydrolysate Market, By Form, 2020-2033 (USD Million)
26. U.S. Fish Protein Hydrolysate Market, By Application, 2020-2033 (USD Million)
27. U.S. Fish Protein Hydrolysate Market, By Technology, 2020-2033 (USD Million)
28. U.S. Fish Protein Hydrolysate Market, By Source, 2020-2033 (USD Million)
29. Canada Fish Protein Hydrolysate Market, By Form, 2020-2033 (USD Million)
30. Canada Fish Protein Hydrolysate Market, By Application, 2020-2033 (USD Million)
31. Canada Fish Protein Hydrolysate Market, By Technology, 2020-2033 (USD Million)
32. Canada Fish Protein Hydrolysate Market, By Source, 2020-2033 (USD Million)
33. Mexico Fish Protein Hydrolysate Market, By Form, 2020-2033 (USD Million)
34. Mexico Fish Protein Hydrolysate Market, By Application, 2020-2033 (USD Million)
35. Mexico Fish Protein Hydrolysate Market, By Technology, 2020-2033 (USD Million)
36. Mexico Fish Protein Hydrolysate Market, By Source, 2020-2033 (USD Million)
37. Europe Fish Protein Hydrolysate Market, By Form, 2020-2033 (USD Million)
38. Europe Fish Protein Hydrolysate Market, By Application, 2020-2033 (USD Million)
39. Europe Fish Protein Hydrolysate Market, By Technology, 2020-2033 (USD Million)
40. Europe Fish Protein Hydrolysate Market, By Source, 2020-2033 (USD Million)
41. Germany Fish Protein Hydrolysate Market, By Form, 2020-2033 (USD Million)
42. Germany Fish Protein Hydrolysate Market, By Application, 2020-2033 (USD Million)
43. Germany Fish Protein Hydrolysate Market, By Technology, 2020-2033 (USD Million)
44. Germany Fish Protein Hydrolysate Market, By Source, 2020-2033 (USD Million)
45. France Fish Protein Hydrolysate Market, By Form, 2020-2033 (USD Million)
46. France Fish Protein Hydrolysate Market, By Application, 2020-2033 (USD Million)
47. France Fish Protein Hydrolysate Market, By Technology, 2020-2033 (USD Million)
48. France Fish Protein Hydrolysate Market, By Source, 2020-2033 (USD Million)
49. U.K. Fish Protein Hydrolysate Market, By Form, 2020-2033 (USD Million)
50. U.K. Fish Protein Hydrolysate Market, By Application, 2020-2033 (USD Million)
51. U.K. Fish Protein Hydrolysate Market, By Technology, 2020-2033 (USD Million)
52. U.K. Fish Protein Hydrolysate Market, By Source, 2020-2033 (USD Million)
53. Italy Fish Protein Hydrolysate Market, By Form, 2020-2033 (USD Million)
54. Italy Fish Protein Hydrolysate Market, By Application, 2020-2033 (USD Million)
55. Italy Fish Protein Hydrolysate Market, By Technology, 2020-2033 (USD Million)
56. Italy Fish Protein Hydrolysate Market, By Source, 2020-2033 (USD Million)
57. Spain Fish Protein Hydrolysate Market, By Form, 2020-2033 (USD Million)
58. Spain Fish Protein Hydrolysate Market, By Application, 2020-2033 (USD Million)
59. Spain Fish Protein Hydrolysate Market, By Technology, 2020-2033 (USD Million)
60. Spain Fish Protein Hydrolysate Market, By Source, 2020-2033 (USD Million)
61. Asia Pacific Fish Protein Hydrolysate Market, By Form, 2020-2033 (USD Million)
62. Asia Pacific Fish Protein Hydrolysate Market, By Application, 2020-2033 (USD Million)
63. Asia Pacific Fish Protein Hydrolysate Market, By Technology, 2020-2033 (USD Million)
64. Asia Pacific Fish Protein Hydrolysate Market, By Source, 2020-2033 (USD Million)
65. Japan Fish Protein Hydrolysate Market, By Form, 2020-2033 (USD Million)
66. Japan Fish Protein Hydrolysate Market, By Application, 2020-2033 (USD Million)
67. Japan Fish Protein Hydrolysate Market, By Technology, 2020-2033 (USD Million)
68. Japan Fish Protein Hydrolysate Market, By Source, 2020-2033 (USD Million)
69. China Fish Protein Hydrolysate Market, By Form, 2020-2033 (USD Million)
70. China Fish Protein Hydrolysate Market, By Application, 2020-2033 (USD Million)
71. China Fish Protein Hydrolysate Market, By Technology, 2020-2033 (USD Million)
72. China Fish Protein Hydrolysate Market, By Source, 2020-2033 (USD Million)
73. India Fish Protein Hydrolysate Market, By Form, 2020-2033 (USD Million)
74. India Fish Protein Hydrolysate Market, By Application, 2020-2033 (USD Million)
75. India Fish Protein Hydrolysate Market, By Technology, 2020-2033 (USD Million)
76. India Fish Protein Hydrolysate Market, By Source, 2020-2033 (USD Million)
77. South America Fish Protein Hydrolysate Market, By Form, 2020-2033 (USD Million)
78. South America Fish Protein Hydrolysate Market, By Application, 2020-2033 (USD Million)
79. South America Fish Protein Hydrolysate Market, By Technology, 2020-2033 (USD Million)
80. South America Fish Protein Hydrolysate Market, By Source, 2020-2033 (USD Million)
81. Brazil Fish Protein Hydrolysate Market, By Form, 2020-2033 (USD Million)
82. Brazil Fish Protein Hydrolysate Market, By Application, 2020-2033 (USD Million)
83. Brazil Fish Protein Hydrolysate Market, By Technology, 2020-2033 (USD Million)
84. Brazil Fish Protein Hydrolysate Market, By Source, 2020-2033 (USD Million)
85. Middle East and Africa Fish Protein Hydrolysate Market, By Form, 2020-2033 (USD Million)
86. Middle East and Africa Fish Protein Hydrolysate Market, By Application, 2020-2033 (USD Million)
87. Middle East and Africa Fish Protein Hydrolysate Market, By Technology, 2020-2033 (USD Million)
88. Middle East and Africa Fish Protein Hydrolysate Market, By Source, 2020-2033 (USD Million)
89. UAE Fish Protein Hydrolysate Market, By Form, 2020-2033 (USD Million)
90. UAE Fish Protein Hydrolysate Market, By Application, 2020-2033 (USD Million)
91. UAE Fish Protein Hydrolysate Market, By Technology, 2020-2033 (USD Million)
92. UAE Fish Protein Hydrolysate Market, By Source, 2020-2033 (USD Million)
93. South Africa Fish Protein Hydrolysate Market, By Form, 2020-2033 (USD Million)
94. South Africa Fish Protein Hydrolysate Market, By Application, 2020-2033 (USD Million)
95. South Africa Fish Protein Hydrolysate Market, By Technology, 2020-2033 (USD Million)
96. South Africa Fish Protein Hydrolysate Market, By Source, 2020-2033 (USD Million)
List of Figures
1. Global Fish Protein Hydrolysate Market Segmentation
2. Global Fish Protein Hydrolysate Market: Research Methodology
3. Market Size Estimation Methodology: Bottom-Up Approach
4. Market Size Estimation Methodology: Top-Down Approach
5. Data Triangulation
6. Porter’s Five Forces Analysis
7. Value Chain Analysis
8. Global Fish Protein Hydrolysate Market Attractiveness Analysis By Form
9. Global Fish Protein Hydrolysate Market Attractiveness Analysis By Application
10. Global Fish Protein Hydrolysate Market Attractiveness Analysis By Technology
11. Global Fish Protein Hydrolysate Market Attractiveness Analysis By Source
12. Global Fish Protein Hydrolysate Market Attractiveness Analysis By Region
13. Global Fish Protein Hydrolysate Market: Dynamics
14. Global Fish Protein Hydrolysate Market Share By Form (2023 & 2033)
15. Global Fish Protein Hydrolysate Market Share By Application (2023 & 2033)
16. Global Fish Protein Hydrolysate Market Share By Technology (2023 & 2033)
17. Global Fish Protein Hydrolysate Market Share By Source (2023 & 2033)
18. Global Fish Protein Hydrolysate Market Share By Regions (2023 & 2033)
19. Global Fish Protein Hydrolysate Market Share By Company (2023)
This study forecasts revenue at global, regional, and country levels from 2020 to 2033. The Brainy Insights has segmented the global Fish Protein Hydrolysate market based on below mentioned segments:
Global Fish Protein Hydrolysate Market by Form:
Global Fish Protein Hydrolysate Market by Technology:
Global Fish Protein Hydrolysate Market by Application:
Global Fish Protein Hydrolysate Market by Source:
Global Fish Protein Hydrolysate by Region:
Research has its special purpose to undertake marketing efficiently. In this competitive scenario, businesses need information across all industry verticals; the information about customer wants, market demand, competition, industry trends, distribution channels etc. This information needs to be updated regularly because businesses operate in a dynamic environment. Our organization, The Brainy Insights incorporates scientific and systematic research procedures in order to get proper market insights and industry analysis for overall business success. The analysis consists of studying the market from a miniscule level wherein we implement statistical tools which helps us in examining the data with accuracy and precision.
Our research reports feature both; quantitative and qualitative aspects for any market. Qualitative information for any market research process are fundamental because they reveal the customer needs and wants, usage and consumption for any product/service related to a specific industry. This in turn aids the marketers/investors in knowing certain perceptions of the customers. Qualitative research can enlighten about the different product concepts and designs along with unique service offering that in turn, helps define marketing problems and generate opportunities. On the other hand, quantitative research engages with the data collection process through interviews, e-mail interactions, surveys and pilot studies. Quantitative aspects for the market research are useful to validate the hypotheses generated during qualitative research method, explore empirical patterns in the data with the help of statistical tools, and finally make the market estimations.
The Brainy Insights offers comprehensive research and analysis, based on a wide assortment of factual insights gained through interviews with CXOs and global experts and secondary data from reliable sources. Our analysts and industry specialist assume vital roles in building up statistical tools and analysis models, which are used to analyse the data and arrive at accurate insights with exceedingly informative research discoveries. The data provided by our organization have proven precious to a diverse range of companies, facilitating them to address issues such as determining which products/services are the most appealing, whether or not customers use the product in the manner anticipated, the purchasing intentions of the market and many others.
Our research methodology encompasses an idyllic combination of primary and secondary initiatives. Key phases involved in this process are listed below:

The phase involves the gathering and collecting of market data and its related information with the help of different sources & research procedures.

The data procurement stage involves in data gathering and collecting through various data sources.
This stage involves in extensive research. These data sources includes:
Purchased Database: Purchased databases play a crucial role in estimating the market sizes irrespective of the domain. Our purchased database includes:
Primary Research: The Brainy Insights interacts with leading companies and experts of the concerned domain to develop the analyst team’s market understanding and expertise. It improves and substantiates every single data presented in the market reports. Primary research mainly involves in telephonic interviews, E-mail interactions and face-to-face interviews with the raw material providers, manufacturers/producers, distributors, & independent consultants. The interviews that we conduct provides valuable data on market size and industry growth trends prevailing in the market. Our organization also conducts surveys with the various industry experts in order to gain overall insights of the industry/market. For instance, in healthcare industry we conduct surveys with the pharmacists, doctors, surgeons and nurses in order to gain insights and key information of a medical product/device/equipment which the customers are going to usage. Surveys are conducted in the form of questionnaire designed by our own analyst team. Surveys plays an important role in primary research because surveys helps us to identify the key target audiences of the market. Additionally, surveys helps to identify the key target audience engaged with the market. Our survey team conducts the survey by targeting the key audience, thus gaining insights from them. Based on the perspectives of the customers, this information is utilized to formulate market strategies. Moreover, market surveys helps us to understand the current competitive situation of the industry. To be precise, our survey process typically involve with the 360 analysis of the market. This analytical process begins by identifying the prospective customers for a product or service related to the market/industry to obtain data on how a product/service could fit into customers’ lives.

Secondary Research: The secondary data sources includes information published by the on-profit organizations such as World bank, WHO, company fillings, investor presentations, annual reports, national government documents, statistical databases, blogs, articles, white papers and others. From the annual report, we analyse a company’s revenue to understand the key segment and market share of that organization in a particular region. We analyse the company websites and adopt the product mapping technique which is important for deriving the segment revenue. In the product mapping method, we select and categorize the products offered by the companies catering to domain specific market, deduce the product revenue for each of the companies so as to get overall estimation of the market size. We also source data and analyses trends based on information received from supply side and demand side intermediaries in the value chain. The supply side denotes the data gathered from supplier, distributor, wholesaler and the demand side illustrates the data gathered from the end customers for respective market domain.

The supply side for a domain specific market is analysed by:
The demand side for the market is estimated through:
In-house Library: Apart from these third-party sources, we have our in-house library of qualitative and quantitative information. Our in-house database includes market data for various industry and domains. These data are updated on regular basis as per the changing market scenario. Our library includes, historic databases, internal audit reports and archives.
Sometimes there are instances where there is no metadata or raw data available for any domain specific market. For those cases, we use our expertise to forecast and estimate the market size in order to generate comprehensive data sets. Our analyst team adopt a robust research technique in order to produce the estimates:
Data Synthesis: This stage involves the analysis & mapping of all the information obtained from the previous step. It also involves in scrutinizing the data for any discrepancy observed while data gathering related to the market. The data is collected with consideration to the heterogeneity of sources. Robust scientific techniques are in place for synthesizing disparate data sets and provide the essential contextual information that can orient market strategies. The Brainy Insights has extensive experience in data synthesis where the data passes through various stages:


Market Deduction & Formulation: The final stage comprises of assigning data points at appropriate market spaces so as to deduce feasible conclusions. Analyst perspective & subject matter expert based holistic form of market sizing coupled with industry analysis also plays a crucial role in this stage.
This stage involves in finalization of the market size and numbers that we have collected from data integration step. With data interpolation, it is made sure that there is no gap in the market data. Successful trend analysis is done by our analysts using extrapolation techniques, which provide the best possible forecasts for the market.
Data Validation & Market Feedback: Validation is the most important step in the process. Validation & re-validation via an intricately designed process helps us finalize data-points to be used for final calculations.

The Brainy Insights interacts with leading companies and experts of the concerned domain to develop the analyst team’s market understanding and expertise. It improves and substantiates every single data presented in the market reports. The data validation interview and discussion panels are typically composed of the most experienced industry members. The participants include, however, are not limited to:
Moreover, we always validate our data and findings through primary respondents from all the major regions we are working on.


Free Customization
Fortune 500 Clients
Free Yearly Update On Purchase Of Multi/Corporate License
Companies Served Till Date