- +1-315-215-1633
- sales@thebrainyinsights.com

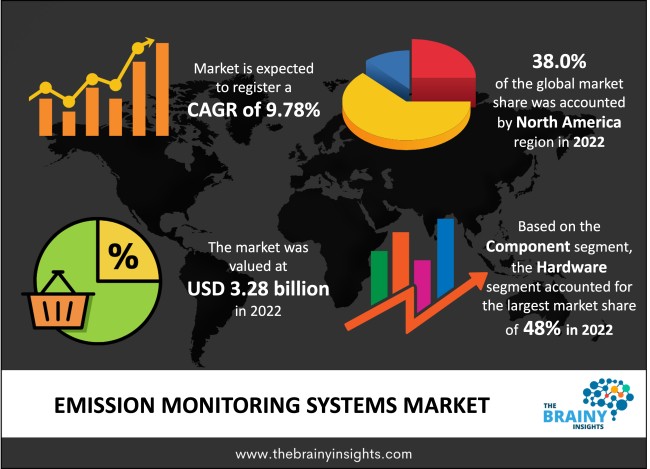
The global emission monitoring systems market was valued at USD 3.28 billion in 2022 and growing at a CAGR of 9.78% from 2023 to 2032. The development of emission monitoring systems became crucial as the awareness towards environmental friendliness and sustainability started growing exponentially. Emission monitoring systems (EMS) are integrated instruments that measure, track, and report the atmospheric emissions of various pollutants and greenhouse gases. These systems are used in various industries and applications, including power plants, manufacturing facilities, refineries, and transportation, to ensure adherence to environmental norms and standards. Tracking, measuring, and managing emissions from industrial processes, vehicles, and other sources are crucial for emission monitoring systems (EMS). These systems are essential for guaranteeing environmental compliance, improving air quality, and reducing the harmful impacts of pollutants on the ecosystem and the general public's health.
Since the Industrial Revolution, when the adverse environmental consequences of fast industrialization became apparent, there has been a need for emission monitoring. Early efforts to reduce emissions primarily targeted obstructive pollutants like smoke and particulate matter. More complex monitoring methods and systems were created over time as scientific knowledge of air quality and its effects on human health and the environment evolved. Emission monitoring has a long history that dates back to the early stages of industrialization when it became clear how pollution affected air quality. Early attempts concentrated on emissions that could be seen with the naked eye, including smoke and soot, but as scientific understanding increased, more complex monitoring techniques were developed. Emission monitoring systems (EMS) perform various vital functions in environmental management. First, emission monitoring systems help organizations evade fines and legal consequences by ensuring compliance with emission limitations established by regulatory agencies. Second, emission monitoring systems (EMS) provide information for evaluating the environmental effects of industrial operations and assisting in detecting pollution sources and their reduction. These technologies also play a critical role in aiding studies into climate change and emissions trading schemes.
Get an overview of this study by requesting a free sample
Rising Demand for Emission Monitoring Systems- The stringent environmental laws and emissions standards drive the global emission monitoring system (EMS) market. Stricter regulations are being imposed on pollutant emissions from a variety of sources, such as industrial sites, power plants, and cars, by governments and international organizations. To effectively monitor and report emissions following these standards, sophisticated EMS must be implemented. The demand for sophisticated EMS systems is driven by the requirement for real-time data to verify compliance. Monitoring emissions is currently more crucial than ever because of rising environmental consciousness and the need to maintain the earth's ecological balance. More and more people, business enterprises, and governments are realizing how important it is to reduce air pollution and greenhouse gas emissions. Many organizations are establishing challenging sustainability objectives, such as becoming carbon neutral, which calls for thorough emission monitoring to monitor development. This consciousness is driving investments in emission monitoring system technology. Thus, these factors are escalating the market growth.
Cost and Budget Constraints - The primary factor is the high costs of purchasing, installing, and maintaining these systems, hindering the widespread adoption of emission monitoring systems. For organizations, especially small and medium-sized enterprises (SMEs), high-quality sensors, data analytics software, and other hardware/software components can be expensive. Budget restrictions frequently prevent these organizations from investing in advanced emission monitoring system (EMS) solutions, which limits market expansion. Although the demand for emission monitoring systems (EMS) is driven by strict environmental regulations, their complexity and frequent modifications can pose serious difficulties. Because compliance standards differ across countries and industries, it can be difficult for organizations to navigate the regulatory landscape successfully. Some organizations are discouraged from implementing emission monitoring systems (EMS) because adhering to these standards frequently requires significant resources and expertise.
Rising Number of Coal-based Power Generation Plants- One of the central regions that uses coal to produce electricity is APAC. China and India are two of the APAC region's biggest coal consumers for power production. According to the International Energy Agency, coal remained a significant fuel in the world's energy systems in 2020 and accounted for nearly 39% of the world's electricity. China and India saw the most significant increases in electricity production from coal, respectively. According to the US Energy Information Administration, China is the world's largest coal consumer, obtaining more than 71% of its electricity from coal. In addition, the nation intends to build additional coal-fired power facilities in Bangladesh, Pakistan, and South Africa. Similarly, India's Ministry of Power anticipates a 25% increase in coal-fired power generation capacity to 239 GW by 2022. The most significant sources of sulfur dioxide emissions are coal-fired power stations. Therefore, the establishment of new coal-fired power plants by China and India to electrify the developing world and ensure the expansion of their economies is projected to produce attractive prospects for the market growth and development.
The regions analyzed for the market include Europe, North America, South America, Asia Pacific, and Middle East & Africa. North America emerged as the largest market for the global emission monitoring systems market, with a 38.0% share of the market revenue in 2022. The region has a well-established environmental protection and sustainability regulatory framework, including strict emission regulations implemented by the associations, namely, the U.S. Environmental Protection Agency (EPA) and Environment and Climate Change Canada (ECCC). These laws influence the adoption of emission monitoring solutions for comprehensive monitoring and reporting. The emission monitoring systems market within the North American region benefits from a robust industrial base that includes the oil and gas, manufacturing, and power generation industries. Many sectors need intensive emissions monitoring to comply with standards and show environmental responsibility. Additionally, EMS is frequently used by North American businesses to support their corporate social responsibility (CSR) initiatives, demonstrating a more profound commitment to sustainability. Additionally, the regional market players engage in various market strategies such as product developments, and product innovations to maintain their competitive edge.
North America Region Emission Monitoring Systems Market Share in 2022 - 38.0%
www.thebrainyinsights.com
Check the geographical analysis of this market by requesting a free sample
The type segment is divided into continuous emission monitoring system (CEMS) and predictive emission monitoring system (PEMS). The synthetic segment dominated the market, with a market share of around 78% in 2022. CEMS offers precise and timely data on emissions, enabling enterprises to track and monitor their pollutant levels continuously. CEMS includes a variety of actions aimed at locating and disclosing atmospheric pollution emissions from stationary sources. Regulatory authorities mandate that a variety of industries, including waste incinerators, cement plants, kraft pulp mills, coal-based power plants, biomass power plants, oil-fired power plants, and biomass power plants, continuously monitor their emissions, put emission control measures into place, and provide ongoing documentation of their emissions to local environmental control agencies.
The component segment is divided into hardware, software and services. The hardware segment dominated the market, with a market share of around 48% in 2022. The hardware parts make it possible to continuously measure, record, and monitor emissions from stationary sources, giving accurate and reliable information for legal compliance and environmental management. Sensors, gas analyzers, opacity and particulate matter monitors, sampling systems, control units, and data collection systems are only a few of the hardware elements used in emission monitoring systems. The pollutant concentrations in the emissions are measured and quantified using this equipment. To protect them from environmental elements like dust, moisture, and temperature changes, the hardware components of emission monitoring systems are frequently placed in protective enclosures or cabinets. Emission monitoring systems frequently come with networking and communication components to standardize data transmission and system integration.
The industry segment is divided into oil & gas, metals & mining, power generation, chemical and others. The oil & gas segment dominated the market, with a market share of around 35% in 2022. Oil and gas companies use emission monitoring systems to operate more profitably, minimize expenses, and exhibit environmental sustainability. Emission monitoring is essential to ensure compliance with environmental laws and limit the adverse effects of the pollutants. To accomplish this, oil and gas enterprises utilize emission monitoring systems. The emission monitoring systems are primarily utilized to manage and monitor greenhouse gas emissions, such as carbon dioxide, carbon monoxide, methane, and other volatile organic compounds. By identifying pollutant sources and putting specific emission reduction methods in place, these systems enable companies to track and measure their emissions precisely. These factors are boosting the segment's growth and development.
| Attribute | Description |
|---|---|
| Market Size | Revenue (USD Billion) |
| Market size value in 2022 | USD 3.28 Billion |
| Market size value in 2032 | USD 8.34 Billion |
| CAGR (2023 to 2032) | 9.78% |
| Historical data | 2019-2021 |
| Base Year | 2022 |
| Forecast | 2023-2032 |
| Region | The regions analyzed for the market are Asia Pacific, Europe, South America, North America, and Middle East & Africa. Furthermore, the regions are further analyzed at the country level. |
| Segments | Type, Component, Industry |
As per The Brainy Insights, the market size of the global emission monitoring systems market was valued at USD 3.28 billion in 2022 to USD 8.34 billion by 2032.
Global emission monitoring systems market is growing at a CAGR of 9.78% during the forecast period 2023-2032.
The market's growth will be influenced by the rising demand for emission monitoring systems across developed and developing nations.
The technological complexity associated with emission monitoring systems is anticipated to hamper the market growth.
1. Introduction
1.1. Objectives of the Study
1.2. Market Definition
1.3. Research Scope
1.4. Currency
1.5. Key Target Audience
2. Research Methodology and Assumptions
3. Executive Summary
4. Premium Insights
4.1. Porter’s Five Forces Analysis
4.2. Value Chain Analysis
4.3. Top Investment Pockets
4.3.1. Market Attractiveness Analysis by Type
4.3.2. Market Attractiveness Analysis by Industry
4.3.3. Market Attractiveness Analysis by Component
4.3.4. Market Attractiveness Analysis by Region
4.4. Industry Trends
5. Market Dynamics
5.1. Market Evaluation
5.2. Drivers
5.2.1. Rising Demand for Emission Monitoring Systems
5.3. Restraints
5.3.1. Technological Complexity
5.4. Opportunities
5.4.1. Technological Advancements
6. Global Emission Monitoring Systems Market Analysis and Forecast, By Type
6.1. Segment Overview
6.2. Continuous Emission Monitoring System (CEMS)
6.3. Predictive Emission Monitoring System (PEMS)
7. Global Emission Monitoring Systems Market Analysis and Forecast, By Industry
7.1. Segment Overview
7.2. Oil & Gas
7.3. Metals & Mining
7.4. Power Generation
7.5. Chemical
7.6. Others
8. Global Emission Monitoring Systems Market Analysis and Forecast, By Component
8.1. Segment Overview
8.2. Hardware
8.3. Software
8.4. Services
9. Global Emission Monitoring Systems Market Analysis and Forecast, By Regional Analysis
9.1. Segment Overview
9.2. North America
9.2.1. U.S.
9.2.2. Canada
9.2.3. Mexico
9.3. Europe
9.3.1. Germany
9.3.2. France
9.3.3. U.K.
9.3.4. Italy
9.3.5. Spain
9.4. Asia-Pacific
9.4.1. Japan
9.4.2. China
9.4.3. India
9.4.4. South Korea
9.4.5. Australia
9.5. South America
9.5.1. Brazil
9.5.2. Argentina
9.6. Middle East and Africa
9.6.1. UAE
9.6.2. South Africa
9.6.3. Saudi Arabia
10. Global Emission Monitoring Systems Market-Competitive Landscape
10.1. Overview
10.2. Market Share of Key Players in the Emission Monitoring Systems Market
10.2.1. Global Company Market Share
10.2.2. North America Company Market Share
10.2.3. Europe Company Market Share
10.2.4. APAC Company Market Share
10.3. Competitive Situations and Trends
10.3.1. Type Launches and Developments
10.3.2. Partnerships, Collaborations, and Agreements
10.3.3. Mergers & Acquisitions
10.3.4. Expansions
11. Company Profiles
11.1. AMETEK, Inc.
11.1.1. Business Overview
11.1.2. Company Snapshot
11.1.3. Company Market Share Analysis
11.1.4. Company Type Portfolio
11.1.5. Recent Developments
11.1.6. SWOT Analysis
11.2. ABB Ltd
11.2.1. Business Overview
11.2.2. Company Snapshot
11.2.3. Company Market Share Analysis
11.2.4. Company Type Portfolio
11.2.5. Recent Developments
11.2.6. SWOT Analysis
11.3. Emerson Electric Co.
11.3.1. Business Overview
11.3.2. Company Snapshot
11.3.3. Company Market Share Analysis
11.3.4. Company Type Portfolio
11.3.5. Recent Developments
11.3.6. SWOT Analysis
11.4. Siemens AG
11.4.1. Business Overview
11.4.2. Company Snapshot
11.4.3. Company Market Share Analysis
11.4.4. Company Type Portfolio
11.4.5. Recent Developments
11.4.6. SWOT Analysis
11.5. General Electric Company
11.5.1. Business Overview
11.5.2. Company Snapshot
11.5.3. Company Market Share Analysis
11.5.4. Company Type Portfolio
11.5.5. Recent Developments
11.5.6. SWOT Analysis
11.6. Rockwell Automation, Inc.
11.6.1. Business Overview
11.6.2. Company Snapshot
11.6.3. Company Market Share Analysis
11.6.4. Company Type Portfolio
11.6.5. Recent Developments
11.6.6. SWOT Analysis
11.7. Horiba Ltd.
11.7.1. Business Overview
11.7.2. Company Snapshot
11.7.3. Company Market Share Analysis
11.7.4. Company Type Portfolio
11.7.5. Recent Developments
11.7.6. SWOT Analysis
11.8. Sick AG
11.8.1. Business Overview
11.8.2. Company Snapshot
11.8.3. Company Market Share Analysis
11.8.4. Company Type Portfolio
11.8.5. Recent Developments
11.8.6. SWOT Analysis
11.9. Thermo Fisher Scientific Inc.
11.9.1. Business Overview
11.9.2. Company Snapshot
11.9.3. Company Market Share Analysis
11.9.4. Company Type Portfolio
11.9.5. Recent Developments
11.9.6. SWOT Analysis
11.10. Teledyne Technologies, Inc.
11.10.1. Business Overview
11.10.2. Company Snapshot
11.10.3. Company Market Share Analysis
11.10.4. Company Type Portfolio
11.10.5. Recent Developments
11.10.6. SWOT Analysis
11.11. ACOEM Ecotech Pty. Ltd.
11.11.1. Business Overview
11.11.2. Company Snapshot
11.11.3. Company Market Share Analysis
11.11.4. Company Type Portfolio
11.11.5. Recent Developments
11.11.6. SWOT Analysis
11.12. CMC Solutions
11.12.1. Business Overview
11.12.2. Company Snapshot
11.12.3. Company Market Share Analysis
11.12.4. Company Type Portfolio
11.12.5. Recent Developments
11.12.6. SWOT Analysis
List of Table
1. Global Emission Monitoring Systems Market, By Type, 2019-2032 (USD Billion)
2. Global Continuous Emission Monitoring System (CEMS) Emission Monitoring Systems Market, By Region, 2019-2032 (USD Billion)
3. Global Predictive Emission Monitoring System (PEMS) Emission Monitoring Systems Market, By Region, 2019-2032 (USD Billion)
4. Global Emission Monitoring Systems Market, By Industry, 2019-2032 (USD Billion)
5. Global Oil & Gas Emission Monitoring Systems Market, By Region, 2019-2032 (USD Billion)
6. Global Metals & Mining Emission Monitoring Systems Market, By Region, 2019-2032 (USD Billion)
7. Global Power Generation Emission Monitoring Systems Market, By Region, 2019-2032 (USD Billion)
8. Global Chemical Emission Monitoring Systems Market, By Region, 2019-2032 (USD Billion)
9. Global Others Emission Monitoring Systems Market, By Region, 2019-2032 (USD Billion)
10. Global Emission Monitoring Systems Market, By Component, 2019-2032 (USD Billion)
11. Global Hardware Emission Monitoring Systems Market, By Region, 2019-2032 (USD Billion)
12. Global Software Emission Monitoring Systems Market, By Region, 2019-2032 (USD Billion)
13. Global Services Emission Monitoring Systems Market, By Region, 2019-2032 (USD Billion)
14. Global Emission Monitoring Systems Market, By Region, 2019-2032 (USD Billion)
15. North America Emission Monitoring Systems Market, By Type, 2019-2032 (USD Billion)
16. North America Emission Monitoring Systems Market, By Industry, 2019-2032 (USD Billion)
17. North America Emission Monitoring Systems Market, By Component, 2019-2032 (USD Billion)
18. U.S. Emission Monitoring Systems Market, By Type, 2019-2032 (USD Billion)
19. U.S. Emission Monitoring Systems Market, By Industry, 2019-2032 (USD Billion)
20. U.S. Emission Monitoring Systems Market, By Component, 2019-2032 (USD Billion)
21. Canada Emission Monitoring Systems Market, By Type, 2019-2032 (USD Billion)
22. Canada Emission Monitoring Systems Market, By Industry, 2019-2032 (USD Billion)
23. Canada Emission Monitoring Systems Market, By Component, 2019-2032 (USD Billion)
24. Mexico Emission Monitoring Systems Market, By Type, 2019-2032 (USD Billion)
25. Mexico Emission Monitoring Systems Market, By Industry, 2019-2032 (USD Billion)
26. Mexico Emission Monitoring Systems Market, By Component, 2019-2032 (USD Billion)
27. Europe Emission Monitoring Systems Market, By Type, 2019-2032 (USD Billion)
28. Europe Emission Monitoring Systems Market, By Industry, 2019-2032 (USD Billion)
29. Europe Emission Monitoring Systems Market, By Component, 2019-2032 (USD Billion)
30. Germany Emission Monitoring Systems Market, By Type, 2019-2032 (USD Billion)
31. Germany Emission Monitoring Systems Market, By Industry, 2019-2032 (USD Billion)
32. Germany Emission Monitoring Systems Market, By Component, 2019-2032 (USD Billion)
33. France Emission Monitoring Systems Market, By Type, 2019-2032 (USD Billion)
34. France Emission Monitoring Systems Market, By Industry, 2019-2032 (USD Billion)
35. France Emission Monitoring Systems Market, By Component, 2019-2032 (USD Billion)
36. U.K. Emission Monitoring Systems Market, By Type, 2019-2032 (USD Billion)
37. U.K. Emission Monitoring Systems Market, By Industry, 2019-2032 (USD Billion)
38. U.K. Emission Monitoring Systems Market, By Component, 2019-2032 (USD Billion)
39. Italy Emission Monitoring Systems Market, By Type, 2019-2032 (USD Billion)
40. Italy Emission Monitoring Systems Market, By Industry, 2019-2032 (USD Billion)
41. Italy Emission Monitoring Systems Market, By Component, 2019-2032 (USD Billion)
42. Italy Emission Monitoring Systems Market, By Industry, 2019-2032 (USD Billion)
43. Spain Emission Monitoring Systems Market, By Type, 2019-2032 (USD Billion)
44. Spain Emission Monitoring Systems Market, By Component, 2019-2032 (USD Billion)
45. Spain Emission Monitoring Systems Market, By Industry, 2019-2032 (USD Billion)
46. Asia Pacific Emission Monitoring Systems Market, By Type, 2019-2032 (USD Billion)
47. Asia Pacific Emission Monitoring Systems Market, By Industry, 2019-2032 (USD Billion)
48. Asia Pacific Emission Monitoring Systems Market, By Component, 2019-2032 (USD Billion)
49. Japan Emission Monitoring Systems Market, By Type, 2019-2032 (USD Billion)
50. Japan Emission Monitoring Systems Market, By Component, 2019-2032 (USD Billion)
51. Japan Emission Monitoring Systems Market, By Industry, 2019-2032 (USD Billion)
52. China Emission Monitoring Systems Market, By Type, 2019-2032 (USD Billion)
53. China Emission Monitoring Systems Market, By Component, 2019-2032 (USD Billion)
54. China Emission Monitoring Systems Market, By Industry, 2019-2032 (USD Billion)
55. India Emission Monitoring Systems Market, By Type, 2019-2032 (USD Billion)
56. India Emission Monitoring Systems Market, By Component, 2019-2032 (USD Billion)
57. India Emission Monitoring Systems Market, By Industry, 2019-2032 (USD Billion)
58. South Korea Emission Monitoring Systems Market, By Type, 2019-2032 (USD Billion)
59. South Korea Emission Monitoring Systems Market, By Industry, 2019-2032 (USD Billion)
60. South Korea Emission Monitoring Systems Market, By Component, 2019-2032 (USD Billion)
61. Australia Emission Monitoring Systems Market, By Type, 2019-2032 (USD Billion)
62. Australia Emission Monitoring Systems Market, By Component, 2019-2032 (USD Billion)
63. Australia Emission Monitoring Systems Market, By Industry, 2019-2032 (USD Billion)
64. South America Emission Monitoring Systems Market, By Type, 2019-2032 (USD Billion)
65. South America Emission Monitoring Systems Market, By Industry, 2019-2032 (USD Billion)
66. South America Emission Monitoring Systems Market, By Component, 2019-2032 (USD Billion)
67. Brazil Emission Monitoring Systems Market, By Type, 2019-2032 (USD Billion)
68. Brazil Emission Monitoring Systems Market, By Component, 2019-2032 (USD Billion)
69. Brazil Emission Monitoring Systems Market, By Industry, 2019-2032 (USD Billion)
70. Argentina Emission Monitoring Systems Market, By Type, 2019-2032 (USD Billion)
71. Argentina Emission Monitoring Systems Market, By Component, 2019-2032 (USD Billion)
72. Argentina Emission Monitoring Systems Market, By Industry, 2019-2032 (USD Billion)
73. Middle East and Africa Emission Monitoring Systems Market, By Type, 2019-2032 (USD Billion)
74. Middle East and Africa Emission Monitoring Systems Market, By Component, 2019-2032 (USD Billion)
75. Middle East and Africa Emission Monitoring Systems Market, By Industry, 2019-2032 (USD Billion)
76. UAE Emission Monitoring Systems Market, By Type, 2019-2032 (USD Billion)
77. UAE Emission Monitoring Systems Market, By Component, 2019-2032 (USD Billion)
78. UAE Emission Monitoring Systems Market, By Industry, 2019-2032 (USD Billion)
79. South Africa Emission Monitoring Systems Market, By Type, 2019-2032 (USD Billion)
80. South Africa Emission Monitoring Systems Market, By Component, 2019-2032 (USD Billion)
81. South Africa Emission Monitoring Systems Market, By Industry, 2019-2032 (USD Billion)
82. Saudi Arabia Emission Monitoring Systems Market, By Type, 2019-2032 (USD Billion)
83. Saudi Arabia Emission Monitoring Systems Market, By Component, 2019-2032 (USD Billion)
84. Saudi Arabia Emission Monitoring Systems Market, By Industry, 2019-2032 (USD Billion)
List of Figures
1. Global Emission Monitoring Systems Market Segmentation
2. Emission Monitoring Systems Market: Research Methodology
3. Market Size Estimation Methodology: Bottom-Up Approach
4. Market Size Estimation Methodology: Top-Down Approach
5. Data Triangulation
6. Porter’s Five Forces Analysis
7. Value Chain Analysis
8. Global Emission Monitoring Systems Market Attractiveness Analysis by Type
9. Global Emission Monitoring Systems Market Attractiveness Analysis by Industry
10. Global Emission Monitoring Systems Market Attractiveness Analysis by Component
11. Global Emission Monitoring Systems Market Attractiveness Analysis by Region
12. Global Emission Monitoring Systems Market: Dynamics
13. Global Emission Monitoring Systems Market Share By Type (2023 & 2032)
14. Global Emission Monitoring Systems Market Share by Industry (2023 & 2032)
15. Global Emission Monitoring Systems Market Share by Component (2023 & 2032)
16. Global Emission Monitoring Systems Market Share by Regions (2023 & 2032)
17. Global Emission Monitoring Systems Market Share by Company (2022)
This study forecasts revenue at global, regional, and country levels from 2019 to 2032. The Brainy Insights has segmented the global emission monitoring systems market based on below mentioned segments:
Global Emission Monitoring Systems Market by Type:
Global Emission Monitoring Systems Market by industry:
Global Emission Monitoring Systems Market by Component:
Global Emission Monitoring Systems Market by Region:
Research has its special purpose to undertake marketing efficiently. In this competitive scenario, businesses need information across all industry verticals; the information about customer wants, market demand, competition, industry trends, distribution channels etc. This information needs to be updated regularly because businesses operate in a dynamic environment. Our organization, The Brainy Insights incorporates scientific and systematic research procedures in order to get proper market insights and industry analysis for overall business success. The analysis consists of studying the market from a miniscule level wherein we implement statistical tools which helps us in examining the data with accuracy and precision.
Our research reports feature both; quantitative and qualitative aspects for any market. Qualitative information for any market research process are fundamental because they reveal the customer needs and wants, usage and consumption for any product/service related to a specific industry. This in turn aids the marketers/investors in knowing certain perceptions of the customers. Qualitative research can enlighten about the different product concepts and designs along with unique service offering that in turn, helps define marketing problems and generate opportunities. On the other hand, quantitative research engages with the data collection process through interviews, e-mail interactions, surveys and pilot studies. Quantitative aspects for the market research are useful to validate the hypotheses generated during qualitative research method, explore empirical patterns in the data with the help of statistical tools, and finally make the market estimations.
The Brainy Insights offers comprehensive research and analysis, based on a wide assortment of factual insights gained through interviews with CXOs and global experts and secondary data from reliable sources. Our analysts and industry specialist assume vital roles in building up statistical tools and analysis models, which are used to analyse the data and arrive at accurate insights with exceedingly informative research discoveries. The data provided by our organization have proven precious to a diverse range of companies, facilitating them to address issues such as determining which products/services are the most appealing, whether or not customers use the product in the manner anticipated, the purchasing intentions of the market and many others.
Our research methodology encompasses an idyllic combination of primary and secondary initiatives. Key phases involved in this process are listed below:

The phase involves the gathering and collecting of market data and its related information with the help of different sources & research procedures.

The data procurement stage involves in data gathering and collecting through various data sources.
This stage involves in extensive research. These data sources includes:
Purchased Database: Purchased databases play a crucial role in estimating the market sizes irrespective of the domain. Our purchased database includes:
Primary Research: The Brainy Insights interacts with leading companies and experts of the concerned domain to develop the analyst team’s market understanding and expertise. It improves and substantiates every single data presented in the market reports. Primary research mainly involves in telephonic interviews, E-mail interactions and face-to-face interviews with the raw material providers, manufacturers/producers, distributors, & independent consultants. The interviews that we conduct provides valuable data on market size and industry growth trends prevailing in the market. Our organization also conducts surveys with the various industry experts in order to gain overall insights of the industry/market. For instance, in healthcare industry we conduct surveys with the pharmacists, doctors, surgeons and nurses in order to gain insights and key information of a medical product/device/equipment which the customers are going to usage. Surveys are conducted in the form of questionnaire designed by our own analyst team. Surveys plays an important role in primary research because surveys helps us to identify the key target audiences of the market. Additionally, surveys helps to identify the key target audience engaged with the market. Our survey team conducts the survey by targeting the key audience, thus gaining insights from them. Based on the perspectives of the customers, this information is utilized to formulate market strategies. Moreover, market surveys helps us to understand the current competitive situation of the industry. To be precise, our survey process typically involve with the 360 analysis of the market. This analytical process begins by identifying the prospective customers for a product or service related to the market/industry to obtain data on how a product/service could fit into customers’ lives.

Secondary Research: The secondary data sources includes information published by the on-profit organizations such as World bank, WHO, company fillings, investor presentations, annual reports, national government documents, statistical databases, blogs, articles, white papers and others. From the annual report, we analyse a company’s revenue to understand the key segment and market share of that organization in a particular region. We analyse the company websites and adopt the product mapping technique which is important for deriving the segment revenue. In the product mapping method, we select and categorize the products offered by the companies catering to domain specific market, deduce the product revenue for each of the companies so as to get overall estimation of the market size. We also source data and analyses trends based on information received from supply side and demand side intermediaries in the value chain. The supply side denotes the data gathered from supplier, distributor, wholesaler and the demand side illustrates the data gathered from the end customers for respective market domain.

The supply side for a domain specific market is analysed by:
The demand side for the market is estimated through:
In-house Library: Apart from these third-party sources, we have our in-house library of qualitative and quantitative information. Our in-house database includes market data for various industry and domains. These data are updated on regular basis as per the changing market scenario. Our library includes, historic databases, internal audit reports and archives.
Sometimes there are instances where there is no metadata or raw data available for any domain specific market. For those cases, we use our expertise to forecast and estimate the market size in order to generate comprehensive data sets. Our analyst team adopt a robust research technique in order to produce the estimates:
Data Synthesis: This stage involves the analysis & mapping of all the information obtained from the previous step. It also involves in scrutinizing the data for any discrepancy observed while data gathering related to the market. The data is collected with consideration to the heterogeneity of sources. Robust scientific techniques are in place for synthesizing disparate data sets and provide the essential contextual information that can orient market strategies. The Brainy Insights has extensive experience in data synthesis where the data passes through various stages:


Market Deduction & Formulation: The final stage comprises of assigning data points at appropriate market spaces so as to deduce feasible conclusions. Analyst perspective & subject matter expert based holistic form of market sizing coupled with industry analysis also plays a crucial role in this stage.
This stage involves in finalization of the market size and numbers that we have collected from data integration step. With data interpolation, it is made sure that there is no gap in the market data. Successful trend analysis is done by our analysts using extrapolation techniques, which provide the best possible forecasts for the market.
Data Validation & Market Feedback: Validation is the most important step in the process. Validation & re-validation via an intricately designed process helps us finalize data-points to be used for final calculations.

The Brainy Insights interacts with leading companies and experts of the concerned domain to develop the analyst team’s market understanding and expertise. It improves and substantiates every single data presented in the market reports. The data validation interview and discussion panels are typically composed of the most experienced industry members. The participants include, however, are not limited to:
Moreover, we always validate our data and findings through primary respondents from all the major regions we are working on.


Free Customization
Fortune 500 Clients
Free Yearly Update On Purchase Of Multi/Corporate License
Companies Served Till Date