- +1-315-215-1633
- sales@thebrainyinsights.com

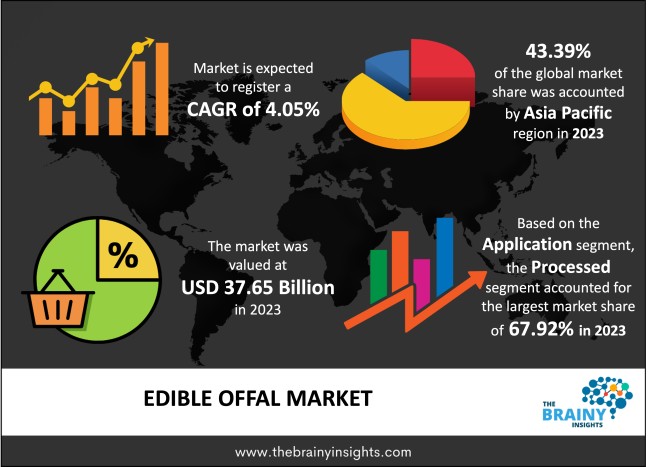
The global edible offal market was valued at USD 37.65 Billion in 2023 and grew at a CAGR of 4.05% from 2024 to 2033. The market is expected to reach USD 55.99 Billion by 2033. The growth of the Edible Offal market can be attributed to the rising demand for leather Edible Offalg and wine production applications.
The internal organs of a butchered animal are known as offal, sometimes as a variety of meats, pluck, or organ meats. The term offal can also apply to the leftovers from grinding grains like corn or wheat. The internal animal parts consumed, such as the kidney, tongue, heart, liver, and sweetbreads, are edible offal. It can be consumed raw or added to other foods. Offal is typically inexpensive, simple to prepare, and highly nutritious. Certain types of meat have higher protein, vitamin, and mineral content than muscle. Fresh offals attract a higher price on the wholesale market than edible offals because they are less perishable and can be frozen before leaving the abattoir. Varieties of meats are the foundation of many traditional European haute cuisine dishes, such as grilled sweetbreads and tripe à la mode de Caen.
Get an overview of this study by requesting a free sample
High nutritional value of offal: Depending on the organ type and animal source, organ meat has a slightly different nutritional composition. However, most organs are quite nutrient-dense. A majority have higher nutritious density than muscle meat. They are especially high in folate and vitamin B12, two B vitamins. They are also a good source of key fat-soluble vitamins, such as vitamins A, D, E, and K, as well as minerals like iron, magnesium, selenium, and zinc. Additionally, organ meats are a fantastic source of protein. As heme iron from meat is highly accessible, the body can absorb it more readily than non-heme iron from plant-based diets.
Fatty liver diseases: Eating organ meat may marginally raise the risk of nonalcoholic fatty liver disease. Consumers must avoid consuming organ meat if they have high cholesterol and Type 2 diabetes, as both conditions are risk factors for nonalcoholic fatty liver disease. Thus, this is impacting the growth of the edible offal market.
Growing preference for protein-based food: Protein claims are becoming increasingly popular worldwide. Unlike previous health fads, such as the superfood diet, the need for high-protein foods has become ingrained in ordinary consumer attitudes and habits. While the sports nutrition industry has grown in popularity and the protein industry continues to expand, people are still more likely to get their protein from ordinary foods and beverages like meat and dairy. High-protein meals are in high demand, and manufacturers are experimenting with animal-derived proteins like meat. Even though plant-derived protein has been making headlines, demand for protein in general, including animal-derived protein, is on the rise.
The regions analyzed for the market include North America, Europe, South America, Asia Pacific, the Middle East, and Africa. Asia-Pacific emerged as the most significant edible offal market, with a 43.39% market revenue share in 2023.
The Asia-Pacific region will account for the largest market share with revenue growth. The rising demand for different food cuisines in the region drives the market's growth. Furthermore, the increasing demand for meat products for animal protein in the region has promoted the supply of edible offal. Also, consumers are now increasing their interest in sustainably sourced offal. Thus, this has led to the government implementing several favourable initiatives.
Asia-Pacific region Edible Offal Market Share in 2023 - 43.39%
www.thebrainyinsights.com
Check the geographical analysis of this market by requesting a free sample
The source segment is divided into goat, pig, cattle, sheep, horse, poultry and others. The pig segment dominated the market, with a share of around 44.82% in 2023. The most popular type of meat consumed worldwide is pork, and consumption has risen rapidly. Important nutrients in pork flesh, such as zinc and iron, are necessary for long-term health.
The application segment is divided into processed and fresh. The processed segment further includes frozen, canned, sausage and others. The fresh segment further includes human food, pet feed and others. The processed segment dominated the market, with a share of around 67.92% in 2023. As it can be stored and transported more conveniently, processed edible offal is more convenient for businesses and consumers. Examples of processed offal products are canning goods, sausages, pâtés, and other ready-to-eat products.
The distribution channel segment is divided into food services and retail. The food services segment dominated the market, with a share of around 66.75% in 2023. Offal is becoming a more common feature on menus for food services, including catering, restaurants, and street food sellers, in an effort to satisfy a broader variety of customer tastes and preferences.
| Attribute | Description |
|---|---|
| Market Size | Revenue (USD Billion) |
| Market size value in 2023 | USD 37.65 Billion |
| Market size value in 2033 | USD 55.99 Billion |
| CAGR (2024 to 2033) | 4.05% |
| Historical data | 2020-2022 |
| Base Year | 2023 |
| Forecast | 2024-2033 |
| Region | The market's regions are Asia Pacific, Europe, South America, North America, and the Middle East and Africa. Furthermore, the regions are further analyzed at the country level. |
| Segments | Source, Application and Distribution Channel |
As per The Brainy Insights, the size of the edible offal market was valued at USD 37.65 Billion in 2023 to USD 55.99 Billion by 2033.
Global edible offal market is growing at a CAGR of 4.05% during the forecast period 2024-2033.
Asia-Pacific region emerged as the largest market for the edible offal.
The market's growth will be influenced by the rising demand for meat products.
The occurrence of fatty liver diseases can hamper the market growth.
The increasing requirement for protein is providing huge opportunities to the market.
Key players are Offal Delight, Offal Good, Offal Cuisine, Alpha Field Products Co, JBS Food, Yoma International, Cenfood International Inc., Sure Good Foods Ltd., Organic Meat Company among others.
1. Introduction
1.1. Objectives of the Study
1.2. Market Definition
1.3. Research Scope
1.4. Currency
1.5. Key Target Audience
2. Research Methodology and Assumptions
3. Executive Summary
4. Premium Insights
4.1. Porter’s Five Forces Analysis
4.2. Value Chain Analysis
4.3. Top Investment Pockets
4.3.1. Market Attractiveness Analysis by Source
4.3.2. Market Attractiveness Analysis by Application
4.3.3. Market Attractiveness Analysis by Distribution Channel
4.3.4. Market Attractiveness Analysis by Region
4.4. Industry Trends
5. Market Dynamics
5.1. Market Evaluation
5.2. Drivers
5.2.1. Increasing demand for edible offal
5.3. Restraints
5.3.1. Leads to fatty liver
5.4. Opportunities
5.4.1. Growth of animal protein industry
5.5. Challenges
5.5.1. Animal diseases
6. Global Edible Offal Market Analysis and Forecast, By Source
6.1. Segment Overview
6.2. Goat
6.3. Pig
6.4. Cattle
6.5. Sheep
6.6. Horse
6.7. Poultry
6.8. Others
7. Global Edible Offal Market Analysis and Forecast, By Application
7.1. Segment Overview
7.2. Processed
7.2.1. Frozen
7.2.2. Canned
7.2.3. Sausage
7.2.4. Others
7.3. Fresh
7.3.1. Human Food
7.3.2. Pet Feed
7.3.3. Others
8. Global Edible Offal Market Analysis and Forecast, By Distribution Channel
8.1. Segment Overview
8.2. Food Services
8.3. Retail
9. Global Edible Offal Market Analysis and Forecast, By Regional Analysis
9.1. Segment Overview
9.2. North America
9.2.1. U.S.
9.2.2. Canada
9.2.3. Mexico
9.3. Europe
9.3.1. Germany
9.3.2. France
9.3.3. U.K.
9.3.4. Italy
9.3.5. Spain
9.4. Asia-Pacific
9.4.1. Japan
9.4.2. China
9.4.3. India
9.5. South America
9.5.1. Brazil
9.6. Middle East and Africa
9.6.1. UAE
9.6.2. South Africa
10. Global Edible Offal Market-Competitive Landscape
10.1. Overview
10.2. Market Share of Key Players in the Edible Offal Market
10.2.1. Global Company Market Share
10.2.2. North America Company Market Share
10.2.3. Europe Company Market Share
10.2.4. APAC Company Market Share
10.3. Competitive Situations and Trends
10.3.1. Product Launches and Developments
10.3.2. Partnerships, Collaborations, and Agreements
10.3.3. Mergers & Acquisitions
10.3.4. Expansions
11. Company Profiles
11.1. Offal Delight
11.1.1. Business Overview
11.1.2. Company Snapshot
11.1.3. Company Market Share Analysis
11.1.4. Company Product Portfolio
11.1.5. Recent Developments
11.1.6. SWOT Analysis
11.2. Offal Good
11.2.1. Business Overview
11.2.2. Company Snapshot
11.2.3. Company Market Share Analysis
11.2.4. Company Product Portfolio
11.2.5. Recent Developments
11.3. Offal Cuisine
11.3.1. Business Overview
11.3.2. Company Snapshot
11.3.3. Company Market Share Analysis
11.3.4. Company Product Portfolio
11.3.5. Recent Developments
11.3.6. SWOT Analysis
11.4. Alpha Field Products Co
11.4.1. Business Overview
11.4.2. Company Snapshot
11.4.3. Company Market Share Analysis
11.4.4. Company Product Portfolio
11.4.5. Recent Developments
11.4.6. SWOT Analysis
11.5. JBS Food
11.5.1. Business Overview
11.5.2. Company Snapshot
11.5.3. Company Market Share Analysis
11.5.4. Company Product Portfolio
11.5.5. Recent Developments
11.5.6. SWOT Analysis
11.6. Yoma International
11.6.1. Business Overview
11.6.2. Company Snapshot
11.6.3. Company Market Share Analysis
11.6.4. Company Product Portfolio
11.6.5. Recent Developments
11.6.6. SWOT Analysis
11.7. Cenfood International Inc.
11.7.1. Business Overview
11.7.2. Company Snapshot
11.7.3. Company Market Share Analysis
11.7.4. Company Product Portfolio
11.7.5. Recent Developments
11.7.6. SWOT Analysis
11.8. Sure Good Foods Ltd.
11.8.1. Business Overview
11.8.2. Company Snapshot
11.8.3. Company Market Share Analysis
11.8.4. Company Product Portfolio
11.8.5. Recent Developments
11.8.6. SWOT Analysis
11.9. Organic Meat Company
11.9.1. Business Overview
11.9.2. Company Snapshot
11.9.3. Company Market Share Analysis
11.9.4. Company Product Portfolio
11.9.5. Recent Developments
11.9.6. SWOT Analysis
List of Table
1. Global Edible Offal Market, By Source, 2020-2033 (USD Billion)
2. Global Goat, Edible Offal Market, By Region, 2020-2033 (USD Billion)
3. Global Pig, Edible Offal Market, By Region, 2020-2033 (USD Billion)
4. Global Cattle, Edible Offal Market, By Region, 2020-2033 (USD Billion)
5. Global Sheep, Edible Offal Market, By Region, 2020-2033 (USD Billion)
6. Global Horse, Edible Offal Market, By Region, 2020-2033 (USD Billion)
7. Global Poultry, Edible Offal Market, By Region, 2020-2033 (USD Billion)
8. Global Others, Edible Offal Market, By Region, 2020-2033 (USD Billion)
9. Global Edible Offal Market, By Application, 2020-2033 (USD Billion)
10. Global Processed, Edible Offal Market, By Region, 2020-2033 (USD Billion)
11. Global Fresh, Edible Offal Market, By Region, 2020-2033 (USD Billion)
12. Global Edible Offal Market, By Distribution Channel, 2020-2033 (USD Billion)
13. Global Food Services, Edible Offal Market, By Region, 2020-2033 (USD Billion)
14. Global Retail, Edible Offal Market, By Region, 2020-2033 (USD Billion)
15. Global Edible Offal Market, By Region, 2020-2033 (USD Billion)
16. North America Edible Offal Market, By Source, 2020-2033 (USD Billion)
17. North America Edible Offal Market, By Application, 2020-2033 (USD Billion)
18. North America Edible Offal Market, By Distribution Channel, 2020-2033 (USD Billion)
19. U.S. Edible Offal Market, By Source, 2020-2033 (USD Billion)
20. U.S. Edible Offal Market, By Application, 2020-2033 (USD Billion)
21. U.S. Edible Offal Market, By Distribution Channel, 2020-2033 (USD Billion)
22. Canada Edible Offal Market, By Source, 2020-2033 (USD Billion)
23. Canada Edible Offal Market, By Application, 2020-2033 (USD Billion)
24. Canada Edible Offal Market, By Distribution Channel, 2020-2033 (USD Billion)
25. Mexico Edible Offal Market, By Source, 2020-2033 (USD Billion)
26. Mexico Edible Offal Market, By Application, 2020-2033 (USD Billion)
27. Mexico Edible Offal Market, By Distribution Channel, 2020-2033 (USD Billion)
28. Europe Edible Offal Market, By Source, 2020-2033 (USD Billion)
29. Europe Edible Offal Market, By Application, 2020-2033 (USD Billion)
30. Europe Edible Offal Market, By Distribution Channel, 2020-2033 (USD Billion)
31. Germany Edible Offal Market, By Source, 2020-2033 (USD Billion)
32. Germany Edible Offal Market, By Application, 2020-2033 (USD Billion)
33. Germany Edible Offal Market, By Distribution Channel, 2020-2033 (USD Billion)
34. France Edible Offal Market, By Source, 2020-2033 (USD Billion)
35. France Edible Offal Market, By Application, 2020-2033 (USD Billion)
36. France Edible Offal Market, By Distribution Channel, 2020-2033 (USD Billion)
37. U.K. Edible Offal Market, By Source, 2020-2033 (USD Billion)
38. U.K. Edible Offal Market, By Application, 2020-2033 (USD Billion)
39. U.K. Edible Offal Market, By Distribution Channel, 2020-2033 (USD Billion)
40. Italy Edible Offal Market, By Source, 2020-2033 (USD Billion)
41. Italy Edible Offal Market, By Application, 2020-2033 (USD Billion)
42. Italy Edible Offal Market, By Distribution Channel, 2020-2033 (USD Billion)
43. Spain Edible Offal Market, By Source, 2020-2033 (USD Billion)
44. Spain Edible Offal Market, By Application, 2020-2033 (USD Billion)
45. Spain Edible Offal Market, By Distribution Channel, 2020-2033 (USD Billion)
46. Asia Pacific Edible Offal Market, By Source, 2020-2033 (USD Billion)
47. Asia Pacific Edible Offal Market, By Application, 2020-2033 (USD Billion)
48. Asia Pacific Edible Offal Market, By Distribution Channel, 2020-2033 (USD Billion)
49. Japan Edible Offal Market, By Source, 2020-2033 (USD Billion)
50. Japan Edible Offal Market, By Application, 2020-2033 (USD Billion)
51. Japan Edible Offal Market, By Distribution Channel, 2020-2033 (USD Billion)
52. China Edible Offal Market, By Source, 2020-2033 (USD Billion)
53. China Edible Offal Market, By Application, 2020-2033 (USD Billion)
54. China Edible Offal Market, By Distribution Channel, 2020-2033 (USD Billion)
55. India Edible Offal Market, By Source, 2020-2033 (USD Billion)
56. India Edible Offal Market, By Application, 2020-2033 (USD Billion)
57. India Edible Offal Market, By Distribution Channel, 2020-2033 (USD Billion)
58. South America Edible Offal Market, By Source, 2020-2033 (USD Billion)
59. South America Edible Offal Market, By Application, 2020-2033 (USD Billion)
60. South America Edible Offal Market, By Distribution Channel, 2020-2033 (USD Billion)
61. Brazil Edible Offal Market, By Source, 2020-2033 (USD Billion)
62. Brazil Edible Offal Market, By Application, 2020-2033 (USD Billion)
63. Brazil Edible Offal Market, By Distribution Channel, 2020-2033 (USD Billion)
64. Middle East and Africa Edible Offal Market, By Source, 2020-2033 (USD Billion)
65. Middle East and Africa Edible Offal Market, By Application, 2020-2033 (USD Billion)
66. Middle East and Africa Edible Offal Market, By Distribution Channel, 2020-2033 (USD Billion)
67. UAE Edible Offal Market, By Source, 2020-2033 (USD Billion)
68. UAE Edible Offal Market, By Application, 2020-2033 (USD Billion)
69. UAE Edible Offal Market, By Distribution Channel, 2020-2033 (USD Billion)
70. South Africa Edible Offal Market, By Source, 2020-2033 (USD Billion)
71. South Africa Edible Offal Market, By Application, 2020-2033 (USD Billion)
72. South Africa Edible Offal Market, By Distribution Channel, 2020-2033 (USD Billion)
List of Figures
1. Global Edible Offal Market Segmentation
2. Edible Offal Market: Research Methodology
3. Market Size Estimation Methodology: Bottom-Up Approach
4. Market Size Estimation Methodology: Top-Down Approach
5. Data Triangulation
6. Porter’s Five Forces Analysis
7. Value Chain Analysis
8. Global Edible Offal Market Attractiveness Analysis by Source
9. Global Edible Offal Market Attractiveness Analysis by Application
10. Global Edible Offal Market Attractiveness Analysis by Distribution Channel
11. Global Edible Offal Market Attractiveness Analysis by Region
12. Global Edible Offal Market: Dynamics
13. Global Edible Offal Market Share by Source (2023 & 2033)
14. Global Edible Offal Market Share by Application (2023 & 2033)
15. Global Edible Offal Market Share by Distribution Channel (2023 & 2033)
16. Global Edible Offal Market Share by Regions (2023 & 2033)
17. Global Edible Offal Market Share by Company (2023)
This study forecasts revenue at global, regional, and country levels from 2020 to 2033. The Brainy Insights has segmented the global edible offal market based on below mentioned segments:
Global Edible Offal Market by Source:
Global Edible Offal Market by Application:
Global Edible Offal Market by Distribution Channel:
Global Edible Offal Market by Region:
Research has its special purpose to undertake marketing efficiently. In this competitive scenario, businesses need information across all industry verticals; the information about customer wants, market demand, competition, industry trends, distribution channels etc. This information needs to be updated regularly because businesses operate in a dynamic environment. Our organization, The Brainy Insights incorporates scientific and systematic research procedures in order to get proper market insights and industry analysis for overall business success. The analysis consists of studying the market from a miniscule level wherein we implement statistical tools which helps us in examining the data with accuracy and precision.
Our research reports feature both; quantitative and qualitative aspects for any market. Qualitative information for any market research process are fundamental because they reveal the customer needs and wants, usage and consumption for any product/service related to a specific industry. This in turn aids the marketers/investors in knowing certain perceptions of the customers. Qualitative research can enlighten about the different product concepts and designs along with unique service offering that in turn, helps define marketing problems and generate opportunities. On the other hand, quantitative research engages with the data collection process through interviews, e-mail interactions, surveys and pilot studies. Quantitative aspects for the market research are useful to validate the hypotheses generated during qualitative research method, explore empirical patterns in the data with the help of statistical tools, and finally make the market estimations.
The Brainy Insights offers comprehensive research and analysis, based on a wide assortment of factual insights gained through interviews with CXOs and global experts and secondary data from reliable sources. Our analysts and industry specialist assume vital roles in building up statistical tools and analysis models, which are used to analyse the data and arrive at accurate insights with exceedingly informative research discoveries. The data provided by our organization have proven precious to a diverse range of companies, facilitating them to address issues such as determining which products/services are the most appealing, whether or not customers use the product in the manner anticipated, the purchasing intentions of the market and many others.
Our research methodology encompasses an idyllic combination of primary and secondary initiatives. Key phases involved in this process are listed below:

The phase involves the gathering and collecting of market data and its related information with the help of different sources & research procedures.

The data procurement stage involves in data gathering and collecting through various data sources.
This stage involves in extensive research. These data sources includes:
Purchased Database: Purchased databases play a crucial role in estimating the market sizes irrespective of the domain. Our purchased database includes:
Primary Research: The Brainy Insights interacts with leading companies and experts of the concerned domain to develop the analyst team’s market understanding and expertise. It improves and substantiates every single data presented in the market reports. Primary research mainly involves in telephonic interviews, E-mail interactions and face-to-face interviews with the raw material providers, manufacturers/producers, distributors, & independent consultants. The interviews that we conduct provides valuable data on market size and industry growth trends prevailing in the market. Our organization also conducts surveys with the various industry experts in order to gain overall insights of the industry/market. For instance, in healthcare industry we conduct surveys with the pharmacists, doctors, surgeons and nurses in order to gain insights and key information of a medical product/device/equipment which the customers are going to usage. Surveys are conducted in the form of questionnaire designed by our own analyst team. Surveys plays an important role in primary research because surveys helps us to identify the key target audiences of the market. Additionally, surveys helps to identify the key target audience engaged with the market. Our survey team conducts the survey by targeting the key audience, thus gaining insights from them. Based on the perspectives of the customers, this information is utilized to formulate market strategies. Moreover, market surveys helps us to understand the current competitive situation of the industry. To be precise, our survey process typically involve with the 360 analysis of the market. This analytical process begins by identifying the prospective customers for a product or service related to the market/industry to obtain data on how a product/service could fit into customers’ lives.

Secondary Research: The secondary data sources includes information published by the on-profit organizations such as World bank, WHO, company fillings, investor presentations, annual reports, national government documents, statistical databases, blogs, articles, white papers and others. From the annual report, we analyse a company’s revenue to understand the key segment and market share of that organization in a particular region. We analyse the company websites and adopt the product mapping technique which is important for deriving the segment revenue. In the product mapping method, we select and categorize the products offered by the companies catering to domain specific market, deduce the product revenue for each of the companies so as to get overall estimation of the market size. We also source data and analyses trends based on information received from supply side and demand side intermediaries in the value chain. The supply side denotes the data gathered from supplier, distributor, wholesaler and the demand side illustrates the data gathered from the end customers for respective market domain.

The supply side for a domain specific market is analysed by:
The demand side for the market is estimated through:
In-house Library: Apart from these third-party sources, we have our in-house library of qualitative and quantitative information. Our in-house database includes market data for various industry and domains. These data are updated on regular basis as per the changing market scenario. Our library includes, historic databases, internal audit reports and archives.
Sometimes there are instances where there is no metadata or raw data available for any domain specific market. For those cases, we use our expertise to forecast and estimate the market size in order to generate comprehensive data sets. Our analyst team adopt a robust research technique in order to produce the estimates:
Data Synthesis: This stage involves the analysis & mapping of all the information obtained from the previous step. It also involves in scrutinizing the data for any discrepancy observed while data gathering related to the market. The data is collected with consideration to the heterogeneity of sources. Robust scientific techniques are in place for synthesizing disparate data sets and provide the essential contextual information that can orient market strategies. The Brainy Insights has extensive experience in data synthesis where the data passes through various stages:


Market Deduction & Formulation: The final stage comprises of assigning data points at appropriate market spaces so as to deduce feasible conclusions. Analyst perspective & subject matter expert based holistic form of market sizing coupled with industry analysis also plays a crucial role in this stage.
This stage involves in finalization of the market size and numbers that we have collected from data integration step. With data interpolation, it is made sure that there is no gap in the market data. Successful trend analysis is done by our analysts using extrapolation techniques, which provide the best possible forecasts for the market.
Data Validation & Market Feedback: Validation is the most important step in the process. Validation & re-validation via an intricately designed process helps us finalize data-points to be used for final calculations.

The Brainy Insights interacts with leading companies and experts of the concerned domain to develop the analyst team’s market understanding and expertise. It improves and substantiates every single data presented in the market reports. The data validation interview and discussion panels are typically composed of the most experienced industry members. The participants include, however, are not limited to:
Moreover, we always validate our data and findings through primary respondents from all the major regions we are working on.


Free Customization
Fortune 500 Clients
Free Yearly Update On Purchase Of Multi/Corporate License
Companies Served Till Date