- +1-315-215-1633
- sales@thebrainyinsights.com

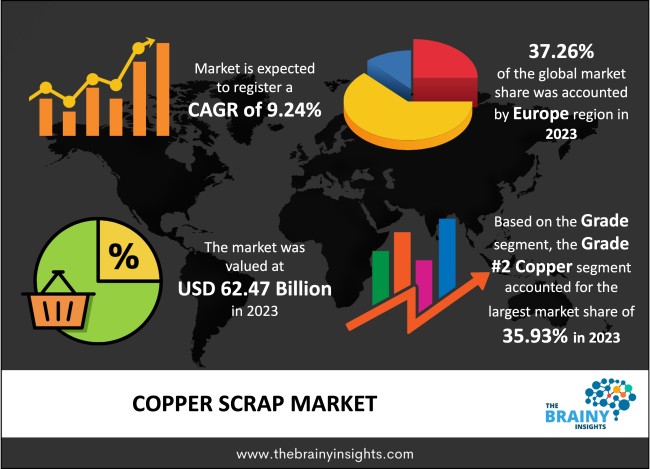
The global copper scrap market was valued at USD 62.47 Billion in 2023 and grew at a CAGR of 9.24% from 2024 to 2033. The market is expected to reach USD 151.17 Billion by 2033. The growth of the copper scrap market can be attributed to the increasing number of electrical components, building components, automotive parts, etc.
Scrap copper is simply any piece of copper that is no longer used for its intended use. It could originate from plumbing pipes, electrical cables, old coins, jewellery, or any other source. Scrap copper is one of the most valuable recyclable wastes because it can be reused and repurposed without losing quality. Recycling copper requires less energy than mining and processing new copper ore, lowering pollutants and greenhouse gas emissions. The energy generated in heat by the converter's exothermic S and Fe oxidation reactions is very beneficial for melting scrap, especially if the oxidation reactions require a lot of oxygen. Most smelters use a Peirce-Smith converter to melt scrap copper and solid reverts. Several smelters smelt dried concentrates in their converters by injecting them through the tuyeres.
Get an overview of this study by requesting a free sample
Increase preference for copper scrap in different applications: Copper is a precious metal that is always in high demand due to its broad usage in energy transition, building, electric vehicles, and other applications, as it is a good heat and electricity conductor and more flexible than other metals. While new copper is becoming more expensive, a viable alternative is recycled copper scrap metal. There has been an increase in scrap copper production over the previous year, as mine supplies may end at any time, unable to match demand for copper. When resources are limited, recycling metal becomes even more crucial.
High price: The capital expenditure of copper scrap is high, which restrains the market. Medium—and small-scale industries find it difficult to cope with the high prices of copper scrap. Scrap copper retains approximately 90% of the original copper's price, making buying scrap copper equivalent to purchasing new copper. Thus, this restrains market growth.
Investment in clean energy: Clean energy is the world's fastest-growing energy source, up 42% from 2010 to 2020. Clean energy is created by systems that emit no pollutants, notably greenhouse gases that contribute to climate change, such as CO2. Using copper scrap does not release hazardous compounds or gases into the atmosphere, which can harm the environment and humans. As the population expands, so will the demand for energy sources. The amount of energy required varies in every country in the world. Renewable energy sources and long-term growth have been the top priorities for industries during the last two decades.
The regions analyzed for the market include North America, Europe, South America, Asia Pacific, the Middle East, and Africa. North America emerged as the most significant copper scrap market, with a 37.26% market revenue share in 2023.
North America region will account for the largest market share with revenue growth. The rising demand for copper scrap in infrastructure redevelopment drives the market's growth. Furthermore, there has been an increase in applications of copper scrap in automotive, electrical and electronics, building and construction, etc. With rising initiatives for clean energy development, the end-user industries are opting to use copper scrap in their applications.
Europe region Copper Scrap Market Share in 2023 - 37.26%
www.thebrainyinsights.com
Check the geographical analysis of this market by requesting a free sample
The grade segment is divided into bare bright copper, grade #1 copper, grade #2 copper, and light copper. The grade #2 copper segment dominated the market, with a share of around 35.93% in 2023. This form of copper is commonly used in construction since it is less expensive than other varieties. It contains soldered pipes and wires, as well as painted plumbing tubes.
The application segment is divided into brass mills, wire rod mills, ingot makers and others. The wire rod mills segment dominated the market, with a share of around 37.31% in 2023. Copper wire rods are used to produce wires, cables, transformers, and other components. It has been useful for millennia in transmitting energy and transporting telecommunications signals. It is also suitable for building bridges, houses, and highways.
The end-use segment is divided into electrical and electronics, building and construction, transportation, industrial machinery and others. The electrical and electronics segment dominated the market, with a share of around 42.97% in 2023. Copper is utilized in a multitude of applications, including electrical cables. Copper is a highly conductive metal that allows electricity to move through it more easily, making it excellent for use in electrical wiring.
| Attribute | Description |
|---|---|
| Market Size | Revenue (USD Billion) |
| Market size value in 2023 | USD 62.47 Billion |
| Market size value in 2033 | USD 151.17 Billion |
| CAGR (2024 to 2033) | 9.24% |
| Historical data | 2020-2022 |
| Base Year | 2023 |
| Forecast | 2024-2033 |
| Region | The market's regions are Asia Pacific, Europe, South America, North America, and the Middle East and Africa. Furthermore, the regions are further analyzed at the country level. |
| Segments | Grade, Application and End-Use |
As per The Brainy Insights, the size of the copper scrap market was valued at USD 62.47 Billion in 2023 to USD 151.17 Billion by 2033.
Global copper scrap market is growing at a CAGR of 9.24% during the forecast period 2024-2033.
North America region emerged as the largest market for the copper scrap.
The market's growth will be influenced by the rising demand for copper scrap in different industries.
The high price of copper scrap can hamper the market growth.
The growing investment in clean energy is providing huge opportunities to the market.
Key players are Ames Copper Group, CMC, Aurubis AG, Global Metals & Iron Inc., Glencore, JAIN RESOURCE RECYCLING PVT LTD., OmniSource, KGHM METRACO S.A., Pascha GmbH, S.I.C. Recycling Inc., Perniagaan Logam Panchavarnam SDN BHD among others.
1. Introduction
1.1. Objectives of the Study
1.2. Market Definition
1.3. Research Scope
1.4. Currency
1.5. Key Target Audience
2. Research Methodology and Assumptions
3. Executive Summary
4. Premium Insights
4.1. Porter’s Five Forces Analysis
4.2. Value Chain Analysis
4.3. Top Investment Pockets
4.3.1. Market Attractiveness Analysis by Grade
4.3.2. Market Attractiveness Analysis by Application
4.3.3. Market Attractiveness Analysis by End-use
4.3.4. Market Attractiveness Analysis by Region
4.4. Industry Trends
5. Market Dynamics
5.1. Market Evaluation
5.2. Drivers
5.2.1. Increasing demand for copper scrap in different regions
5.3. Restraints
5.3.1. Fluctuating cost of raw material
5.4. Opportunities
5.4.1. Growth of clean energy industry
5.5. Challenges
5.5.1. Complex manufacturing
6. Global Copper Scrap Market Analysis and Forecast, By Grade
6.1. Segment Overview
6.2. Bare Bright Copper
6.3. Grade #1 Copper
6.4. Grade #2 Copper
6.5. Light Copper
7. Global Copper Scrap Market Analysis and Forecast, By Application
7.1. Segment Overview
7.2. Brass Mills
7.3. Wire Rod Mills
7.4. Ingot Makers
7.5. Others
8. Global Copper Scrap Market Analysis and Forecast, By End-use
8.1. Segment Overview
8.2. Electrical and Electronics
8.3. Building and Construction
8.4. Transportation
8.5. Industrial Machinery
8.6. Others
9. Global Copper Scrap Market Analysis and Forecast, By Regional Analysis
9.1. Segment Overview
9.2. North America
9.2.1. U.S.
9.2.2. Canada
9.2.3. Mexico
9.3. Europe
9.3.1. Germany
9.3.2. France
9.3.3. U.K.
9.3.4. Italy
9.3.5. Spain
9.4. Asia-Pacific
9.4.1. Japan
9.4.2. China
9.4.3. India
9.5. South America
9.5.1. Brazil
9.6. Middle East and Africa
9.6.1. UAE
9.6.2. South Africa
10. Global Copper Scrap Market-Competitive Landscape
10.1. Overview
10.2. Market Share of Key Players in the Copper Scrap Market
10.2.1. Global Company Market Share
10.2.2. North America Company Market Share
10.2.3. Europe Company Market Share
10.2.4. APAC Company Market Share
10.3. Competitive Situations and Trends
10.3.1. Product Launches and Developments
10.3.2. Partnerships, Collaborations, and Agreements
10.3.3. Mergers & Acquisitions
10.3.4. Expansions
11. Company Profiles
11.1. Ames Copper Group
11.1.1. Business Overview
11.1.2. Company Snapshot
11.1.3. Company Market Share Analysis
11.1.4. Company Product Portfolio
11.1.5. Recent Developments
11.1.6. SWOT Analysis
11.2. CMC
11.2.1. Business Overview
11.2.2. Company Snapshot
11.2.3. Company Market Share Analysis
11.2.4. Company Product Portfolio
11.2.5. Recent Developments
11.3. Aurubis AG
11.3.1. Business Overview
11.3.2. Company Snapshot
11.3.3. Company Market Share Analysis
11.3.4. Company Product Portfolio
11.3.5. Recent Developments
11.3.6. SWOT Analysis
11.4. Global Metals & Iron Inc.
11.4.1. Business Overview
11.4.2. Company Snapshot
11.4.3. Company Market Share Analysis
11.4.4. Company Product Portfolio
11.4.5. Recent Developments
11.4.6. SWOT Analysis
11.5. Glencore
11.5.1. Business Overview
11.5.2. Company Snapshot
11.5.3. Company Market Share Analysis
11.5.4. Company Product Portfolio
11.5.5. Recent Developments
11.5.6. SWOT Analysis
11.6. JAIN RESOURCE RECYCLING PVT LTD.
11.6.1. Business Overview
11.6.2. Company Snapshot
11.6.3. Company Market Share Analysis
11.6.4. Company Product Portfolio
11.6.5. Recent Developments
11.6.6. SWOT Analysis
11.7. OmniSource
11.7.1. Business Overview
11.7.2. Company Snapshot
11.7.3. Company Market Share Analysis
11.7.4. Company Product Portfolio
11.7.5. Recent Developments
11.7.6. SWOT Analysis
11.8. KGHM METRACO S.A.
11.8.1. Business Overview
11.8.2. Company Snapshot
11.8.3. Company Market Share Analysis
11.8.4. Company Product Portfolio
11.8.5. Recent Developments
11.8.6. SWOT Analysis
11.9. Pascha GmbH
11.9.1. Business Overview
11.9.2. Company Snapshot
11.9.3. Company Market Share Analysis
11.9.4. Company Product Portfolio
11.9.5. Recent Developments
11.9.6. SWOT Analysis
11.10. S.I.C. Recycling Inc.
11.10.1. Business Overview
11.10.2. Company Snapshot
11.10.3. Company Market Share Analysis
11.10.4. Company Product Portfolio
11.10.5. Recent Developments
11.10.6. SWOT Analysis
11.11. Perniagaan Logam Panchavarnam SDN BHD
11.11.1. Business Overview
11.11.2. Company Snapshot
11.11.3. Company Market Share Analysis
11.11.4. Company Product Portfolio
11.11.5. Recent Developments
11.11.6. SWOT Analysis
List of Table
1. Global Copper Scrap Market, By Grade, 2020-2033 (USD Billion)
2. Global Bare Bright Copper, Copper Scrap Market, By Region, 2020-2033 (USD Billion)
3. Global Grade #1 Copper, Copper Scrap Market, By Region, 2020-2033 (USD Billion)
4. Global Grade #2 Copper, Copper Scrap Market, By Region, 2020-2033 (USD Billion)
5. Global Light Copper, Copper Scrap Market, By Region, 2020-2033 (USD Billion)
6. Global Copper Scrap Market, By Application, 2020-2033 (USD Billion)
7. Global Brass Mills, Copper Scrap Market, By Region, 2020-2033 (USD Billion)
8. Global Wire Rod Mills, Copper Scrap Market, By Region, 2020-2033 (USD Billion)
9. Global Ingot Makers, Copper Scrap Market, By Region, 2020-2033 (USD Billion)
10. Global Others, Copper Scrap Market, By Region, 2020-2033 (USD Billion)
11. Global Copper Scrap Market, By End-use, 2020-2033 (USD Billion)
12. Global Electrical and Electronics, Copper Scrap Market, By Region, 2020-2033 (USD Billion)
13. Global Building and Construction, Copper Scrap Market, By Region, 2020-2033 (USD Billion)
14. Global Transportation, Copper Scrap Market, By Region, 2020-2033 (USD Billion)
15. Global Industrial Machinery, Copper Scrap Market, By Region, 2020-2033 (USD Billion)
16. Global Others, Copper Scrap Market, By Region, 2020-2033 (USD Billion)
17. Global Copper Scrap Market, By Region, 2020-2033 (USD Billion)
18. North America Copper Scrap Market, By Grade, 2020-2033 (USD Billion)
19. North America Copper Scrap Market, By Application, 2020-2033 (USD Billion)
20. North America Copper Scrap Market, By End-use, 2020-2033 (USD Billion)
21. U.S. Copper Scrap Market, By Grade, 2020-2033 (USD Billion)
22. U.S. Copper Scrap Market, By Application, 2020-2033 (USD Billion)
23. U.S. Copper Scrap Market, By End-use, 2020-2033 (USD Billion)
24. Canada Copper Scrap Market, By Grade, 2020-2033 (USD Billion)
25. Canada Copper Scrap Market, By Application, 2020-2033 (USD Billion)
26. Canada Copper Scrap Market, By End-use, 2020-2033 (USD Billion)
27. Mexico Copper Scrap Market, By Grade, 2020-2033 (USD Billion)
28. Mexico Copper Scrap Market, By Application, 2020-2033 (USD Billion)
29. Mexico Copper Scrap Market, By End-use, 2020-2033 (USD Billion)
30. Europe Copper Scrap Market, By Grade, 2020-2033 (USD Billion)
31. Europe Copper Scrap Market, By Application, 2020-2033 (USD Billion)
32. Europe Copper Scrap Market, By End-use, 2020-2033 (USD Billion)
33. Germany Copper Scrap Market, By Grade, 2020-2033 (USD Billion)
34. Germany Copper Scrap Market, By Application, 2020-2033 (USD Billion)
35. Germany Copper Scrap Market, By End-use, 2020-2033 (USD Billion)
36. France Copper Scrap Market, By Grade, 2020-2033 (USD Billion)
37. France Copper Scrap Market, By Application, 2020-2033 (USD Billion)
38. France Copper Scrap Market, By End-use, 2020-2033 (USD Billion)
39. U.K. Copper Scrap Market, By Grade, 2020-2033 (USD Billion)
40. U.K. Copper Scrap Market, By Application, 2020-2033 (USD Billion)
41. U.K. Copper Scrap Market, By End-use, 2020-2033 (USD Billion)
42. Italy Copper Scrap Market, By Grade, 2020-2033 (USD Billion)
43. Italy Copper Scrap Market, By Application, 2020-2033 (USD Billion)
44. Italy Copper Scrap Market, By End-use, 2020-2033 (USD Billion)
45. Spain Copper Scrap Market, By Grade, 2020-2033 (USD Billion)
46. Spain Copper Scrap Market, By Application, 2020-2033 (USD Billion)
47. Spain Copper Scrap Market, By End-use, 2020-2033 (USD Billion)
48. Asia Pacific Copper Scrap Market, By Grade, 2020-2033 (USD Billion)
49. Asia Pacific Copper Scrap Market, By Application, 2020-2033 (USD Billion)
50. Asia Pacific Copper Scrap Market, By End-use, 2020-2033 (USD Billion)
51. Japan Copper Scrap Market, By Grade, 2020-2033 (USD Billion)
52. Japan Copper Scrap Market, By Application, 2020-2033 (USD Billion)
53. Japan Copper Scrap Market, By End-use, 2020-2033 (USD Billion)
54. China Copper Scrap Market, By Grade, 2020-2033 (USD Billion)
55. China Copper Scrap Market, By Application, 2020-2033 (USD Billion)
56. China Copper Scrap Market, By End-use, 2020-2033 (USD Billion)
57. India Copper Scrap Market, By Grade, 2020-2033 (USD Billion)
58. India Copper Scrap Market, By Application, 2020-2033 (USD Billion)
59. India Copper Scrap Market, By End-use, 2020-2033 (USD Billion)
60. South America Copper Scrap Market, By Grade, 2020-2033 (USD Billion)
61. South America Copper Scrap Market, By Application, 2020-2033 (USD Billion)
62. South America Copper Scrap Market, By End-use, 2020-2033 (USD Billion)
63. Brazil Copper Scrap Market, By Grade, 2020-2033 (USD Billion)
64. Brazil Copper Scrap Market, By Application, 2020-2033 (USD Billion)
65. Brazil Copper Scrap Market, By End-use, 2020-2033 (USD Billion)
66. Middle East and Africa Copper Scrap Market, By Grade, 2020-2033 (USD Billion)
67. Middle East and Africa Copper Scrap Market, By Application, 2020-2033 (USD Billion)
68. Middle East and Africa Copper Scrap Market, By End-use, 2020-2033 (USD Billion)
69. UAE Copper Scrap Market, By Grade, 2020-2033 (USD Billion)
70. UAE Copper Scrap Market, By Application, 2020-2033 (USD Billion)
71. UAE Copper Scrap Market, By End-use, 2020-2033 (USD Billion)
72. South Africa Copper Scrap Market, By Grade, 2020-2033 (USD Billion)
73. South Africa Copper Scrap Market, By Application, 2020-2033 (USD Billion)
74. South Africa Copper Scrap Market, By End-use, 2020-2033 (USD Billion)
List of Figures
1. Global Copper Scrap Market Segmentation
2. Copper Scrap Market: Research Methodology
3. Market Size Estimation Methodology: Bottom-Up Approach
4. Market Size Estimation Methodology: Top-Down Approach
5. Data Triangulation
6. Porter’s Five Forces Analysis
7. Value Chain Analysis
8. Global Copper Scrap Market Attractiveness Analysis by Grade
9. Global Copper Scrap Market Attractiveness Analysis by Application
10. Global Copper Scrap Market Attractiveness Analysis by End-use
11. Global Copper Scrap Market Attractiveness Analysis by Region
12. Global Copper Scrap Market: Dynamics
13. Global Copper Scrap Market Share by Grade (2023 & 2033)
14. Global Copper Scrap Market Share by Application (2023 & 2033)
15. Global Copper Scrap Market Share by End-use (2023 & 2033)
16. Global Copper Scrap Market Share by Regions (2023 & 2033)
17. Global Copper Scrap Market Share by Company (2023)
This study forecasts revenue at global, regional, and country levels from 2020 to 2033. The Brainy Insights has segmented the global copper scrap market based on below mentioned segments:
Global Copper Scrap Market by Grade:
Global Copper Scrap Market by Application:
Global Copper Scrap Market by End-use:
Global Copper Scrap Market by Region:
Research has its special purpose to undertake marketing efficiently. In this competitive scenario, businesses need information across all industry verticals; the information about customer wants, market demand, competition, industry trends, distribution channels etc. This information needs to be updated regularly because businesses operate in a dynamic environment. Our organization, The Brainy Insights incorporates scientific and systematic research procedures in order to get proper market insights and industry analysis for overall business success. The analysis consists of studying the market from a miniscule level wherein we implement statistical tools which helps us in examining the data with accuracy and precision.
Our research reports feature both; quantitative and qualitative aspects for any market. Qualitative information for any market research process are fundamental because they reveal the customer needs and wants, usage and consumption for any product/service related to a specific industry. This in turn aids the marketers/investors in knowing certain perceptions of the customers. Qualitative research can enlighten about the different product concepts and designs along with unique service offering that in turn, helps define marketing problems and generate opportunities. On the other hand, quantitative research engages with the data collection process through interviews, e-mail interactions, surveys and pilot studies. Quantitative aspects for the market research are useful to validate the hypotheses generated during qualitative research method, explore empirical patterns in the data with the help of statistical tools, and finally make the market estimations.
The Brainy Insights offers comprehensive research and analysis, based on a wide assortment of factual insights gained through interviews with CXOs and global experts and secondary data from reliable sources. Our analysts and industry specialist assume vital roles in building up statistical tools and analysis models, which are used to analyse the data and arrive at accurate insights with exceedingly informative research discoveries. The data provided by our organization have proven precious to a diverse range of companies, facilitating them to address issues such as determining which products/services are the most appealing, whether or not customers use the product in the manner anticipated, the purchasing intentions of the market and many others.
Our research methodology encompasses an idyllic combination of primary and secondary initiatives. Key phases involved in this process are listed below:

The phase involves the gathering and collecting of market data and its related information with the help of different sources & research procedures.

The data procurement stage involves in data gathering and collecting through various data sources.
This stage involves in extensive research. These data sources includes:
Purchased Database: Purchased databases play a crucial role in estimating the market sizes irrespective of the domain. Our purchased database includes:
Primary Research: The Brainy Insights interacts with leading companies and experts of the concerned domain to develop the analyst team’s market understanding and expertise. It improves and substantiates every single data presented in the market reports. Primary research mainly involves in telephonic interviews, E-mail interactions and face-to-face interviews with the raw material providers, manufacturers/producers, distributors, & independent consultants. The interviews that we conduct provides valuable data on market size and industry growth trends prevailing in the market. Our organization also conducts surveys with the various industry experts in order to gain overall insights of the industry/market. For instance, in healthcare industry we conduct surveys with the pharmacists, doctors, surgeons and nurses in order to gain insights and key information of a medical product/device/equipment which the customers are going to usage. Surveys are conducted in the form of questionnaire designed by our own analyst team. Surveys plays an important role in primary research because surveys helps us to identify the key target audiences of the market. Additionally, surveys helps to identify the key target audience engaged with the market. Our survey team conducts the survey by targeting the key audience, thus gaining insights from them. Based on the perspectives of the customers, this information is utilized to formulate market strategies. Moreover, market surveys helps us to understand the current competitive situation of the industry. To be precise, our survey process typically involve with the 360 analysis of the market. This analytical process begins by identifying the prospective customers for a product or service related to the market/industry to obtain data on how a product/service could fit into customers’ lives.

Secondary Research: The secondary data sources includes information published by the on-profit organizations such as World bank, WHO, company fillings, investor presentations, annual reports, national government documents, statistical databases, blogs, articles, white papers and others. From the annual report, we analyse a company’s revenue to understand the key segment and market share of that organization in a particular region. We analyse the company websites and adopt the product mapping technique which is important for deriving the segment revenue. In the product mapping method, we select and categorize the products offered by the companies catering to domain specific market, deduce the product revenue for each of the companies so as to get overall estimation of the market size. We also source data and analyses trends based on information received from supply side and demand side intermediaries in the value chain. The supply side denotes the data gathered from supplier, distributor, wholesaler and the demand side illustrates the data gathered from the end customers for respective market domain.

The supply side for a domain specific market is analysed by:
The demand side for the market is estimated through:
In-house Library: Apart from these third-party sources, we have our in-house library of qualitative and quantitative information. Our in-house database includes market data for various industry and domains. These data are updated on regular basis as per the changing market scenario. Our library includes, historic databases, internal audit reports and archives.
Sometimes there are instances where there is no metadata or raw data available for any domain specific market. For those cases, we use our expertise to forecast and estimate the market size in order to generate comprehensive data sets. Our analyst team adopt a robust research technique in order to produce the estimates:
Data Synthesis: This stage involves the analysis & mapping of all the information obtained from the previous step. It also involves in scrutinizing the data for any discrepancy observed while data gathering related to the market. The data is collected with consideration to the heterogeneity of sources. Robust scientific techniques are in place for synthesizing disparate data sets and provide the essential contextual information that can orient market strategies. The Brainy Insights has extensive experience in data synthesis where the data passes through various stages:


Market Deduction & Formulation: The final stage comprises of assigning data points at appropriate market spaces so as to deduce feasible conclusions. Analyst perspective & subject matter expert based holistic form of market sizing coupled with industry analysis also plays a crucial role in this stage.
This stage involves in finalization of the market size and numbers that we have collected from data integration step. With data interpolation, it is made sure that there is no gap in the market data. Successful trend analysis is done by our analysts using extrapolation techniques, which provide the best possible forecasts for the market.
Data Validation & Market Feedback: Validation is the most important step in the process. Validation & re-validation via an intricately designed process helps us finalize data-points to be used for final calculations.

The Brainy Insights interacts with leading companies and experts of the concerned domain to develop the analyst team’s market understanding and expertise. It improves and substantiates every single data presented in the market reports. The data validation interview and discussion panels are typically composed of the most experienced industry members. The participants include, however, are not limited to:
Moreover, we always validate our data and findings through primary respondents from all the major regions we are working on.


Free Customization
Fortune 500 Clients
Free Yearly Update On Purchase Of Multi/Corporate License
Companies Served Till Date