- +1-315-215-1633
- sales@thebrainyinsights.com

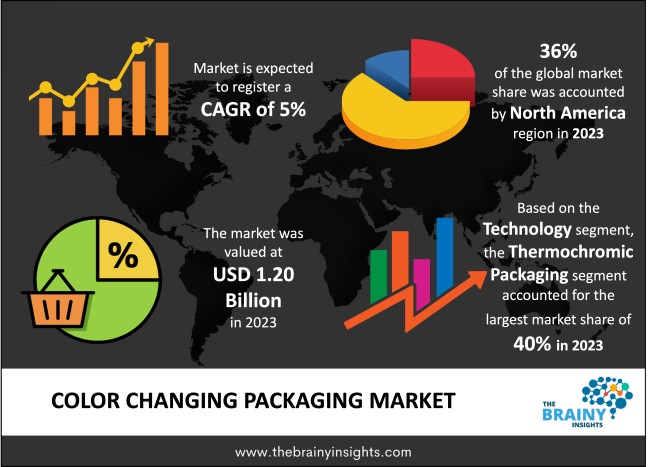
The global color changing packaging market was valued at USD 1.20 billion in 2023 and grew at a CAGR of 5% from 2024 to 2033. The market is expected to reach USD 1.95 billion by 2033. The rapidly developing technologies advancing color changing packaging materials and manufacturing processes will drive the growth of the global color changing packaging market.
The color changing packaging is an advanced solution that has been developed to increase the performance, stability, and customer appeal of packaging products. This packaging can contain materials or signs that are sensitive to certain environmental conditions such as temperature, pH change, Ultraviolet light or gas content. This technology, which usually involves the use of thermochromic, photochromic or gas-sensitive pigments, is applied in almost every industry, especially in food and beverages, drugs and cosmetics. Color-changing packs are key elements in food industry as they offer assurance of safe and quality products. For example, temperature sensitive stickers or labels are used to show whether food or other perishable products have been exposed to right temperature for storage or not. Equally, gas-sensitive indicators are used to show evidence of spoilage through change of color due to presence of carbon dioxide or ammonia in the packaged foods. In the case of pharmaceuticals, advanced packaging designs work to help preserve the quality of the drugs. Apart from safety, color change packaging makes consumers happier and engaged.
Get an overview of this study by requesting a free sample
The increasing emphasis on food safety and quality – Growing consumer concern over the quality and safety of the foods they consume is a key factor driving consumers interest in technologies such as color-changing packaging solutions. Customers increased awareness about safety and quality of their food, due to the rising incidences of food borne illnesses contributes to the market’s growth. This has created demand for packaging, which not only maintains the physical characteristics of the product but provides information on its condition at a given time. For example, in using thermochromic labels, consumers can know whether the stored or transported products have had an exposure to extreme temperatures. This technology also fits regulatory measures especially those that call for traceability and safety in perishable products. The increasing trend of convenience foods, individually frozen, and exotic perishable products have added higher demands for such technological packaging methods. Therefore, the increasing emphasis on food safety and quality will contribute to the global color changing packaging market’s growth.
High Production Costs – color changing packaging technology employs the use of suitable pigments including thermochromic, photochromic or gas sensitive pigments and unique processes. These materials are on an average costly to process and integrate into packing methodologies further compounding the overall production costs. Moreover, the price disparity is contributed by the research and development costs into creating color changing packaging. Firms spending in new types of pigments, or other materials that are less expensive but better for the environment, or products that are more reliable need to cover some of those costs, which implies higher prices for the product. Therefore, colour-changing packaging remains expensive to produce, making it unpopular in sensitive markets where high costs can decrease demand when incorporated into a product’s price. Therefore, high production costs will hamper the market’s growth.
Technological Advancements - The use of color changing packaging has been made possible through technological development which has enhanced the applicability of the technology across markets. Technological growth of new materials which are more stable, harder, and suitable for use with diverse materials and packaging solutions. There has been a major breakthrough in pigments which are non-hazardous and eco-friendly. The rising trend of environmentally conscience packaging is now met through the incorporation of biodegradable indicators. The availability of digital and nanotechnology advancements has also contributed towards the market’s growth. Smart sensors have also been added to packaging, and the incorporation of the colour indicating systems has also boosted packaging. The ability to develop innovative materials and effective usage of technologically enhanced applications also contributes to the global color changing packaging market’s growth and development during the forecast period.
The regions analyzed for the market include North America, Europe, South America, Asia Pacific, the Middle East, and Africa. North America emerged as the most significant global color changing packaging market, with a 36% market revenue share in 2023.
North America is the largest consumer in the color-changing packaging market because of the technological environment, regulatory measures, and consumer preferences for color changing packaging. The US and Canada are the two leading members of the region that have embraced the adoption of advanced packaging methods in various industries such as the food and beverage processing sector, the pharma industry, and consumer goods processing industries among others. Flexible demand in the market, technological developments, and legal requirements contribute to the dominance of North America in the global color changing packaging market.
North America Region Color Changing Packaging Market Share in 2023 - 36%
www.thebrainyinsights.com
Check the geographical analysis of this market by requesting a free sample
The technology segment is divided into thermochromic packaging, photochromic packaging, gas-sensitive packaging, and pH-sensitive packaging. The thermochromic packaging segment dominated the market, with a market share of around 40% in 2023. Thermochromic packaging currently holds the dominant position in the market given its application flexibility, stability and popularity. This technology utilizes temperature-sensitive materials. Thermochromic applications are most commonly used in the food and beverage sector. This helps give the consumers some visible indictors so as whether the certain food product has been stored or served at the right temperatures to make it safe for food consumption. Another area of great value of thermochromic packaging is the pharmaceutical industry, mainly for products which require temperature-controlled supply chains such as vaccines, biologics, and certain temperature sensitive drugs. Another advantage that contributes to the enhanced popularity of thermochromic packaging is the fact that it can also support promotional as well as interactive forms of function. Products that have thermal sensitive packaging are highly conspicuous and effective in capturing consumer interest and are widely used in the marketing strategies. Furthermore, new thermochromic materials have been found to have enhanced capabilities, stability, and affordability, making the application broader in its promotion.
The application segment is divided into freshness and spoilage indicators, temperature monitoring, and interactive and promotional packaging. The freshness and spoilage indicators segment dominated the market, with a market share of around 42% in 2023. Freshness and spoilage indicators are the most popular applications of color-changing packaging elements as they are critical to food safety and minimal waste practices. Due to mounting concerns on food waste and safety, freshness indicator has emerged as an essential asset to a manufacturer and a consumer. A major factor in favor of the dominance of freshness and spoilage indicators is the strict rules governing food safety. As consumers become more demanding and push for better information about product origin, these indicators aid manufacturers in meeting safety regulations and give consumers more utility from the product. Since people are increasingly concerned with safe, quality, and fresh food, freshness and spoilage characteristics are expected to be more widely established and a growing market in the color-changing packaging industry.
The end use industry segment is divided into food and beverages, pharmaceuticals, cosmetics and personal care, and other. The food and beverages segment dominated the market, with a market share of around 45% in 2023. As consumers become more conscious of health and food safety, there has been a demand for color-changing packaging solutions. Thermochromic and spoilage indicators are now one of the most important tools to determine the freshness and quality of packaged products. This improves the consumer experience. These indicators make it easier for the consumer to determine if a particular product is bad and therefore reduce the incidence of food borne illnesses. As the need for products with improved product quality and safety standards takes root, color changing packaging remains instrumental in this industry’s growth and efficiency.
| Attribute | Description |
|---|---|
| Market Size | Revenue (USD Billion) |
| Market size value in 2023 | USD 1.20 Billion |
| Market size value in 2033 | USD 1.95 Billion |
| CAGR (2024 to 2033) | 5% |
| Historical data | 2020-2022 |
| Base Year | 2023 |
| Forecast | 2024-2033 |
| Region | The regions analyzed for the market are Asia Pacific, Europe, South America, North America, and Middle East and Africa. Furthermore, the regions are further analyzed at the country level. |
| Segments | Technology, Application and End Use Industry |
As per The Brainy Insights, the size of the global color changing packaging market was valued at USD 1.20 billion in 2023 to USD 1.95 billion by 2033.
Global color changing packaging market is growing at a CAGR of 5% during the forecast period 2024-2033.
The market's growth will be influenced by the increasing emphasis on food safety and quality.
High production costs could hamper the market growth.
This study forecasts revenue at global, regional, and country levels from 2020 to 2033. The Brainy Insights has segmented the global color changing packaging market based on below mentioned segments:
Global Color Changing Packaging Market by Technology:
Global Color Changing Packaging Market by Application:
Global Color Changing Packaging Market by End Use Industry:
Global Color Changing Packaging Market by Region:
Research has its special purpose to undertake marketing efficiently. In this competitive scenario, businesses need information across all industry verticals; the information about customer wants, market demand, competition, industry trends, distribution channels etc. This information needs to be updated regularly because businesses operate in a dynamic environment. Our organization, The Brainy Insights incorporates scientific and systematic research procedures in order to get proper market insights and industry analysis for overall business success. The analysis consists of studying the market from a miniscule level wherein we implement statistical tools which helps us in examining the data with accuracy and precision.
Our research reports feature both; quantitative and qualitative aspects for any market. Qualitative information for any market research process are fundamental because they reveal the customer needs and wants, usage and consumption for any product/service related to a specific industry. This in turn aids the marketers/investors in knowing certain perceptions of the customers. Qualitative research can enlighten about the different product concepts and designs along with unique service offering that in turn, helps define marketing problems and generate opportunities. On the other hand, quantitative research engages with the data collection process through interviews, e-mail interactions, surveys and pilot studies. Quantitative aspects for the market research are useful to validate the hypotheses generated during qualitative research method, explore empirical patterns in the data with the help of statistical tools, and finally make the market estimations.
The Brainy Insights offers comprehensive research and analysis, based on a wide assortment of factual insights gained through interviews with CXOs and global experts and secondary data from reliable sources. Our analysts and industry specialist assume vital roles in building up statistical tools and analysis models, which are used to analyse the data and arrive at accurate insights with exceedingly informative research discoveries. The data provided by our organization have proven precious to a diverse range of companies, facilitating them to address issues such as determining which products/services are the most appealing, whether or not customers use the product in the manner anticipated, the purchasing intentions of the market and many others.
Our research methodology encompasses an idyllic combination of primary and secondary initiatives. Key phases involved in this process are listed below:

The phase involves the gathering and collecting of market data and its related information with the help of different sources & research procedures.

The data procurement stage involves in data gathering and collecting through various data sources.
This stage involves in extensive research. These data sources includes:
Purchased Database: Purchased databases play a crucial role in estimating the market sizes irrespective of the domain. Our purchased database includes:
Primary Research: The Brainy Insights interacts with leading companies and experts of the concerned domain to develop the analyst team’s market understanding and expertise. It improves and substantiates every single data presented in the market reports. Primary research mainly involves in telephonic interviews, E-mail interactions and face-to-face interviews with the raw material providers, manufacturers/producers, distributors, & independent consultants. The interviews that we conduct provides valuable data on market size and industry growth trends prevailing in the market. Our organization also conducts surveys with the various industry experts in order to gain overall insights of the industry/market. For instance, in healthcare industry we conduct surveys with the pharmacists, doctors, surgeons and nurses in order to gain insights and key information of a medical product/device/equipment which the customers are going to usage. Surveys are conducted in the form of questionnaire designed by our own analyst team. Surveys plays an important role in primary research because surveys helps us to identify the key target audiences of the market. Additionally, surveys helps to identify the key target audience engaged with the market. Our survey team conducts the survey by targeting the key audience, thus gaining insights from them. Based on the perspectives of the customers, this information is utilized to formulate market strategies. Moreover, market surveys helps us to understand the current competitive situation of the industry. To be precise, our survey process typically involve with the 360 analysis of the market. This analytical process begins by identifying the prospective customers for a product or service related to the market/industry to obtain data on how a product/service could fit into customers’ lives.

Secondary Research: The secondary data sources includes information published by the on-profit organizations such as World bank, WHO, company fillings, investor presentations, annual reports, national government documents, statistical databases, blogs, articles, white papers and others. From the annual report, we analyse a company’s revenue to understand the key segment and market share of that organization in a particular region. We analyse the company websites and adopt the product mapping technique which is important for deriving the segment revenue. In the product mapping method, we select and categorize the products offered by the companies catering to domain specific market, deduce the product revenue for each of the companies so as to get overall estimation of the market size. We also source data and analyses trends based on information received from supply side and demand side intermediaries in the value chain. The supply side denotes the data gathered from supplier, distributor, wholesaler and the demand side illustrates the data gathered from the end customers for respective market domain.

The supply side for a domain specific market is analysed by:
The demand side for the market is estimated through:
In-house Library: Apart from these third-party sources, we have our in-house library of qualitative and quantitative information. Our in-house database includes market data for various industry and domains. These data are updated on regular basis as per the changing market scenario. Our library includes, historic databases, internal audit reports and archives.
Sometimes there are instances where there is no metadata or raw data available for any domain specific market. For those cases, we use our expertise to forecast and estimate the market size in order to generate comprehensive data sets. Our analyst team adopt a robust research technique in order to produce the estimates:
Data Synthesis: This stage involves the analysis & mapping of all the information obtained from the previous step. It also involves in scrutinizing the data for any discrepancy observed while data gathering related to the market. The data is collected with consideration to the heterogeneity of sources. Robust scientific techniques are in place for synthesizing disparate data sets and provide the essential contextual information that can orient market strategies. The Brainy Insights has extensive experience in data synthesis where the data passes through various stages:


Market Deduction & Formulation: The final stage comprises of assigning data points at appropriate market spaces so as to deduce feasible conclusions. Analyst perspective & subject matter expert based holistic form of market sizing coupled with industry analysis also plays a crucial role in this stage.
This stage involves in finalization of the market size and numbers that we have collected from data integration step. With data interpolation, it is made sure that there is no gap in the market data. Successful trend analysis is done by our analysts using extrapolation techniques, which provide the best possible forecasts for the market.
Data Validation & Market Feedback: Validation is the most important step in the process. Validation & re-validation via an intricately designed process helps us finalize data-points to be used for final calculations.

The Brainy Insights interacts with leading companies and experts of the concerned domain to develop the analyst team’s market understanding and expertise. It improves and substantiates every single data presented in the market reports. The data validation interview and discussion panels are typically composed of the most experienced industry members. The participants include, however, are not limited to:
Moreover, we always validate our data and findings through primary respondents from all the major regions we are working on.


Free Customization
Fortune 500 Clients
Free Yearly Update On Purchase Of Multi/Corporate License
Companies Served Till Date