- +1-315-215-1633
- sales@thebrainyinsights.com

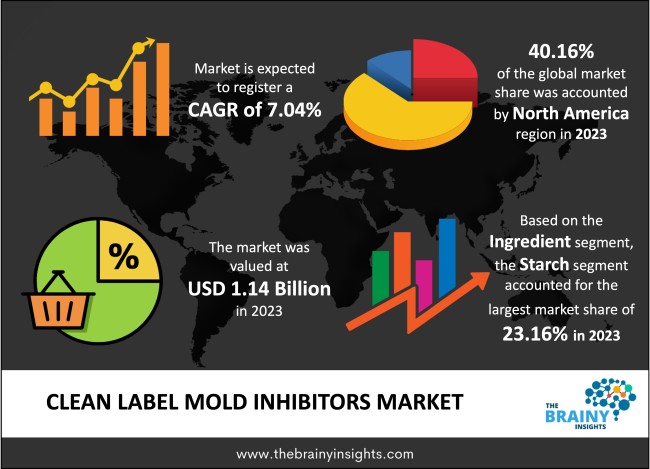
The global Clean Label Mold Inhibitors market generated USD 1.14 Billion revenue in 2023 and is projected to grow at a CAGR of 7.04% from 2024 to 2033. The market is expected to reach USD 2.25 Billion by 2033. According to the market study, the ever-growing demand for natural/organic products is one of the basic factors contributing to the growth of this market. Moreover, the increased focus on R&D activities is another factor that has further fuelled the growth of the clean label mold inhibitors market. Since the natural/organic and clean label product market has grown, many companies have rapidly expanded their R&D budgets to create successful natural-based mold inhibitors to meet consumer demand. This emphasis on R&D has allowed the identification of new natural actives and the enhancement of existing ones to ensure they adhere to the ever-evolving regulations and consumer demands regarding efficacy and product safety. In addition, improved technology and an increased understanding of the mechanisms of mold inhibition enable clean label mold inhibitors to perform better and become suitable for broader applications, opening up new markets. This continuous investment in R&D enables the company to address the current market need and future developments to ensure further growth and a competitive edge.
Clean label mold inhibitors are compounds employed in foods to avoid mold growth and prolong the product's shelf life without contravening the clean label principle. These inhibitors are derived/extracted from natural sources and do not contain synthetic additives consistent with the current trend of natural products and clean labels. Clean label mold inhibitors are substances used to prevent the formation of fungi and mold that may be hazardous to human health as they affect food products. They are mainly obtained from essential oils, plant extracts or organic acids, which have been known to maintain the ability to inhibit bacterial growth. Calcium propionate is one of the most common clean label mold inhibitors. It is extracted from calcium salt and propionic acid. It produces bakery products to inhibit mold growth and increase shelf life. However, as a huge portion of the world's consumers is looking for products with clean labels and natural formulations, manufacturers are looking for new and improved sources of mold inhibitors like plant and natural-based antioxidants. Clean label mold inhibitors are added to foods and beverages such as bread, bakery, dairy, meat, and beverages. It enables the preservation of product quality and safety while at the same time meeting the clean label requirements. In conclusion, clean label mold inhibitors are vital in the current food manufacturing sector as they address the consumers' need for natural and easily comprehensible ingredients while at the same time ensuring effective mold prevention. They are essential in maintaining hygiene and guaranteeing perishable food products' extended lifespan and cleanliness.
Get an overview of this study by requesting a free sample
Enormous Awareness and Demand for Clean-Label Food - Some major factors driving the industry demand are growing consumer understanding and knowledge of food ingredients and the rising preference for natural and easily recognizable items. Furthermore, there has been a growing trend of consumers reading labels and avoiding artificial ingredients, creating more demand for clean-label mold inhibitors.
Wellness Developments - The growing understanding and knowledge of health issues and the need to remove artificial products from the diet have led to a new call for natural products. The clean-label trend is becoming increasingly popular because consumers consider it safer and healthier, positively impacting the demand for natural mold inhibitors.
Legal Pressures - Pressure from various governments and standard-setting organizations regarding the use of food additives and safety measures makes manufacturers opt for natural alternatives. This compliance has been identified as one of the key factors supporting the implementation of clean-label mold inhibitors.
Higher Expenses - The disadvantage is that natural mold inhibitors are more expensive than synthetic ones. Because of narrow profit margins, the high production and sourcing costs may challenge manufacturers, especially those with limited resources.
Limited Life Span - Some clean-label mold inhibitors are less effective than their synthetic counterparts in terms of shelf life and efficacy. This factor may be a problem for food producers since they require stable methods and efficient measures to preserve their products.
Improvements in Technology - The constant innovation and upgrading in the food industry, in terms of research in preservation and safety, can result in better and more diverse options for clean-label mold inhibitors. New techniques in extraction and formulation may open up new possibilities to improve the efficacy and marketability of natural preservatives.
Sustainability and Safety Creativities - Understanding and knowing the consumer and industry's goals for sustainability are likely to drive growth for clean-label mold inhibitors because they are associated with better environmental practices. Brands that focus on their product's sustainability and use natural ingredients can improve consumer appeal.
Maintaining Regular Supply of High-Quality Natural Ingredients - Securing a constant supply of high-quality natural ingredients can be challenging in terms of time and cost. A fluctuation in raw material supply may cause a rippling effect on the production process and increase costs.
Food Additive Norms - With an emphasis on food additive regulation, these naturally occurring inhibitors of mold must be rigorously tested and developed to meet international standards, which is quite a time-consuming and costly process.
The regions analyzed for the market include North America, Europe, South America, Asia Pacific, the Middle East, and Africa. North America emerged as the most prominent global Clean Label Mold Inhibitors market, with a 40.16% market revenue share in 2023.
Consumers in North America have improved their knowledge of food ingredients and have become more health conscious. This factor creates the need for natural and clean label products, encompassing mold inhibitors. However, another factor that plays a significant role in the food industry in North America, especially in the United States and Canada, is the stringent food safety regulation that allows only natural ingredients. Limitations placed on artificial additives drive the consumption of cleaner label options. Moreover, it is also important to note that North America's food and beverage sector is well developed and progressive. Due to rising consumer awareness and stringent regulatory policies, key factors expected to drive the market growth in this region are increasing awareness among the manufacturers to invest in new technologies, such as clean label mold inhibitors. In addition, the current trend towards improving the health of North Americans means that they are inclined to consume items containing natural components. The shifting consumer preference towards clean-label products and increasing concerns about food safety also fuel the growth of clean-label mold inhibitors. Furthermore, the region is also characterized by a strong priority on sustainability and safe and green societal initiatives. Because natural mold inhibitors are believed to be safer and climate friendly than synthetic ones, making them popular in the region.
North America Region Clean Label Mold Inhibitors Market Share in 2023 - 40.16%
www.thebrainyinsights.com
Check the geographical analysis of this market by requesting a free sample
The ingredient segment is divided into fermented flour, starch, vinegar, whey and others. The starch segment dominated the market, with a share of around 23.16% in 2023. Starch is obtained from natural materials like corn, potatoes, and tapioca, which is in line with the current trend, where consumers are sensitive to artificial additives and are inclined towards natural products. Furthermore, using starch-based inhibitors greatly increases the shelf life of various food products as they check for moisture and mold formation. Owing to their efficiency, they have become a commonly used ingredient by food manufacturing companies. Also, starch is widely used in bakery goods, dairy products, and other food industries. This property makes it a versatile mold inhibitor that can be used across various food sub-sectors. Besides fighting mold, starch is a thickener and modifier in food products to enhance their texture, uniformity, and overall quality. This multifunctionality can be valuable for manufacturers who want to increase the appeal and performance of their products in several ways.
The end-use segment is classified into animal feed, food & beverages, pharmaceuticals, personal care & cosmetics, and others. The pharmaceuticals segment dominated the market, with a share of around 33.28% in 2023. The pharmaceutical business is one of the most regulated industries regarding quality standards and safety. Therefore, there is a great market for clean-label mold inhibitors that meet these requirements to avoid using synthetic chemicals in products. Moreover, the US FDA and the European Medicines Agency have put down very rigorous rules regarding the use of pharmaceutical ingredients. Pharmaceutical companies can thus easily meet these regulations by using clean-label, natural and non-synthetic mold inhibitors. The citizens and the patient population have become more aware of the need for medications and health supplements that have natural components. This clean label trend has especially been seen in the pharmaceutical industry where consumers are more inclined to use products that are considered safer and healthier. In addition, mold inhibitors enhance various pharmaceutical products' shelf life and stability. These clean-label mold inhibitors give all the advantages that synthetic chemicals offer without the disadvantage of side effects or legal hurdles.
| Attribute | Description |
|---|---|
| Market Size | Revenue (USD Billion) |
| Market size value in 2023 | USD 1.14 Billion |
| Market size value in 2033 | USD 2.25 Billion |
| CAGR (2024 to 2033) | 7.04% |
| Historical data | 2020-2022 |
| Base Year | 2023 |
| Forecast | 2024-2033 |
| Region | The regions analyzed for the market are Asia Pacific, Europe, South America, North America, and Middle East & Africa. Furthermore, the regions are further analyzed at the country level. |
| Segments | Ingredient and End-use |
As per The Brainy Insights, the size of the clean label mold inhibitors market was valued at USD 1.14 billion in 2023 to USD 2.25 billion by 2033.
The global clean label mold inhibitors market is growing at a CAGR of 7.04% during the forecast period 2024-2033.
North America became the largest market for clean label mold inhibitors.
Consumer demand for clean label products and regulatory pressures drive the market's growth.
1. Introduction
1.1. Objectives of the Study
1.2. Market Definition
1.3. Research Scope
1.4. Currency
1.5. Key Target Audience
2. Research Methodology and Assumptions
3. Executive Summary
4. Premium Insights
4.1. Porter’s Five Forces Analysis
4.2. Value Chain Analysis
4.3. Top Investment Pockets
4.3.1. Market Attractiveness Analysis By Ingredient
4.3.2. Market Attractiveness Analysis By End-use
4.3.3. Market Attractiveness Analysis By Region
4.4. Industry Trends
5. Market Dynamics
5.1. Market Evaluation
5.2. Drivers
5.2.1. Consumer Demand for Clean Label Products
5.2.2. Regulatory Pressures
5.3. Restraints
5.3.1. Higher Costs
5.4. Opportunities
5.4.1. Technological Advancements
5.5. Challenges
5.5.1. Sourcing Consistency
6. Global Clean Label Mold Inhibitors Market Analysis and Forecast, By Ingredient
6.1. Segment Overview
6.2. Fermented Flour
6.3. Starch
6.4. Vinegar
6.5. Whey
6.6. Others
7. Global Clean Label Mold Inhibitors Market Analysis and Forecast, By End-use
7.1. Segment Overview
7.2. Animal Feed
7.3. Food & Beverages
7.4. Pharmaceuticals
7.5. Personal Care & Cosmetics
7.6. Others
8. Global Clean Label Mold Inhibitors Market Analysis and Forecast, By Regional Analysis
8.1. Segment Overview
8.2. North America
8.2.1. U.S.
8.2.2. Canada
8.2.3. Mexico
8.3. Europe
8.3.1. Germany
8.3.2. France
8.3.3. U.K.
8.3.4. Italy
8.3.5. Spain
8.4. Asia-Pacific
8.4.1. Japan
8.4.2. China
8.4.3. India
8.5. South America
8.5.1. Brazil
8.6. Middle East and Africa
8.6.1. UAE
8.6.2. South Africa
9. Global Clean Label Mold Inhibitors Market-Competitive Landscape
9.1. Overview
9.2. Market Share of Key Players in the Clean Label Mold Inhibitors Market
9.2.1. Global Company Market Share
9.2.2. North America Company Market Share
9.2.3. Europe Company Market Share
9.2.4. APAC Company Market Share
9.3. Competitive Situations and Trends
9.3.1. Product Launches and Developments
9.3.2. Partnerships, Collaborations, and Agreements
9.3.3. Mergers & Acquisitions
9.3.4. Expansions
10. Company Profiles
10.1. Associated British Foods plc
10.1.1. Business Overview
10.1.2. Company Snapshot
10.1.3. Company Market Share Analysis
10.1.4. Company Product Portfolio
10.1.5. Recent Developments
10.1.6. SWOT Analysis
10.2. A&B Ingredients, Inc.
10.2.1. Business Overview
10.2.2. Company Snapshot
10.2.3. Company Market Share Analysis
10.2.4. Company Product Portfolio
10.2.5. Recent Developments
10.2.6. SWOT Analysis
10.3. BioVeritas
10.3.1. Business Overview
10.3.2. Company Snapshot
10.3.3. Company Market Share Analysis
10.3.4. Company Product Portfolio
10.3.5. Recent Developments
10.3.6. SWOT Analysis
10.4. Corbion N. V.
10.4.1. Business Overview
10.4.2. Company Snapshot
10.4.3. Company Market Share Analysis
10.4.4. Company Product Portfolio
10.4.5. Recent Developments
10.4.6. SWOT Analysis
10.5. Cargill
10.5.1. Business Overview
10.5.2. Company Snapshot
10.5.3. Company Market Share Analysis
10.5.4. Company Product Portfolio
10.5.5. Recent Developments
10.5.6. SWOT Analysis
10.6. Glanbia plc
10.6.1. Business Overview
10.6.2. Company Snapshot
10.6.3. Company Market Share Analysis
10.6.4. Company Product Portfolio
10.6.5. Recent Developments
10.6.6. SWOT Analysis
10.7. Handary SA
10.7.1. Business Overview
10.7.2. Company Snapshot
10.7.3. Company Market Share Analysis
10.7.4. Company Product Portfolio
10.7.5. Recent Developments
10.7.6. SWOT Analysis
10.8. Kemin Industries, Inc.
10.8.1. Business Overview
10.8.2. Company Snapshot
10.8.3. Company Market Share Analysis
10.8.4. Company Product Portfolio
10.8.5. Recent Developments
10.8.6. SWOT Analysis
10.9. Kerry Group plc
10.9.1. Business Overview
10.9.2. Company Snapshot
10.9.3. Company Market Share Analysis
10.9.4. Company Product Portfolio
10.9.5. Recent Developments
10.9.6. SWOT Analysis
10.10. Lesaffre Corporation
10.10.1. Business Overview
10.10.2. Company Snapshot
10.10.3. Company Market Share Analysis
10.10.4. Company Product Portfolio
10.10.5. Recent Developments
10.10.6. SWOT Analysis
10.11. Puratos Group
10.11.1. Business Overview
10.11.2. Company Snapshot
10.11.3. Company Market Share Analysis
10.11.4. Company Product Portfolio
10.11.5. Recent Developments
10.11.6. SWOT Analysis
10.12. Ribus, Inc.
10.12.1. Business Overview
10.12.2. Company Snapshot
10.12.3. Company Market Share Analysis
10.12.4. Company Product Portfolio
10.12.5. Recent Developments
10.12.6. SWOT Analysis
10.13. Tate & Lyle PLC
10.13.1. Business Overview
10.13.2. Company Snapshot
10.13.3. Company Market Share Analysis
10.13.4. Company Product Portfolio
10.13.5. Recent Developments
10.13.6. SWOT Analysis
List of Table
1. Global Clean Label Mold Inhibitors Market, By Ingredient, 2020-2033 (USD Billion) (Tons)
2. Global Fermented Flour, Clean Label Mold Inhibitors Market, By Region, 2020-2033 (USD Billion) (Tons)
3. Global Starch, Clean Label Mold Inhibitors Market, By Region, 2020-2033 (USD Billion) (Tons)
4. Global Vinegar, Clean Label Mold Inhibitors Market, By Region, 2020-2033 (USD Billion) (Tons)
5. Global Whey, Clean Label Mold Inhibitors Market, By Region, 2020-2033 (USD Billion) (Tons)
6. Global Others, Clean Label Mold Inhibitors Market, By Region, 2020-2033 (USD Billion) (Tons)
7. Global Clean Label Mold Inhibitors Market, By End-use, 2020-2033 (USD Billion) (Tons)
8. Global Animal Feed, Clean Label Mold Inhibitors Market, By Region, 2020-2033 (USD Billion) (Tons)
9. Global Food & Beverages, Clean Label Mold Inhibitors Market, By Region, 2020-2033 (USD Billion) (Tons)
10. Global Pharmaceuticals, Clean Label Mold Inhibitors Market, By Region, 2020-2033 (USD Billion) (Tons)
11. Global Personal Care & Cosmetics, Clean Label Mold Inhibitors Market, By Region, 2020-2033 (USD Billion) (Tons)
12. Global Others, Clean Label Mold Inhibitors Market, By Region, 2020-2033 (USD Billion) (Tons)
13. Global Clean Label Mold Inhibitors Market, By Region, 2020-2033 (USD Billion) (Tons)
14. North America Clean Label Mold Inhibitors Market, By Ingredient, 2020-2033 (USD Billion) (Tons)
15. North America Clean Label Mold Inhibitors Market, By End-use, 2020-2033 (USD Billion) (Tons)
16. U.S. Clean Label Mold Inhibitors Market, By Ingredient, 2020-2033 (USD Billion) (Tons)
17. U.S. Clean Label Mold Inhibitors Market, By End-use, 2020-2033 (USD Billion) (Tons)
18. Canada Clean Label Mold Inhibitors Market, By Ingredient, 2020-2033 (USD Billion) (Tons)
19. Canada Clean Label Mold Inhibitors Market, By End-use, 2020-2033 (USD Billion) (Tons)
20. Mexico Clean Label Mold Inhibitors Market, By Ingredient, 2020-2033 (USD Billion) (Tons)
21. Mexico Clean Label Mold Inhibitors Market, By End-use, 2020-2033 (USD Billion) (Tons)
22. Europe Clean Label Mold Inhibitors Market, By Ingredient, 2020-2033 (USD Billion) (Tons)
23. Europe Clean Label Mold Inhibitors Market, By End-use, 2020-2033 (USD Billion) (Tons)
24. Germany Clean Label Mold Inhibitors Market, By Ingredient, 2020-2033 (USD Billion) (Tons)
25. Germany Clean Label Mold Inhibitors Market, By End-use, 2020-2033 (USD Billion) (Tons)
26. France Clean Label Mold Inhibitors Market, By Ingredient, 2020-2033 (USD Billion) (Tons)
27. France Clean Label Mold Inhibitors Market, By End-use, 2020-2033 (USD Billion) (Tons)
28. U.K. Clean Label Mold Inhibitors Market, By Ingredient, 2020-2033 (USD Billion) (Tons)
29. U.K. Clean Label Mold Inhibitors Market, By End-use, 2020-2033 (USD Billion) (Tons)
30. Italy Clean Label Mold Inhibitors Market, By Ingredient, 2020-2033 (USD Billion) (Tons)
31. Italy Clean Label Mold Inhibitors Market, By End-use, 2020-2033 (USD Billion) (Tons)
32. Spain Clean Label Mold Inhibitors Market, By Ingredient, 2020-2033 (USD Billion) (Tons)
33. Spain Clean Label Mold Inhibitors Market, By End-use, 2020-2033 (USD Billion) (Tons)
34. Asia Pacific Clean Label Mold Inhibitors Market, By Ingredient, 2020-2033 (USD Billion) (Tons)
35. Asia Pacific Clean Label Mold Inhibitors Market, By End-use, 2020-2033 (USD Billion) (Tons)
36. Japan Clean Label Mold Inhibitors Market, By Ingredient, 2020-2033 (USD Billion) (Tons)
37. Japan Clean Label Mold Inhibitors Market, By End-use, 2020-2033 (USD Billion) (Tons)
38. China Clean Label Mold Inhibitors Market, By Ingredient, 2020-2033 (USD Billion) (Tons)
39. China Clean Label Mold Inhibitors Market, By End-use, 2020-2033 (USD Billion) (Tons)
40. India Clean Label Mold Inhibitors Market, By Ingredient, 2020-2033 (USD Billion) (Tons)
41. India Clean Label Mold Inhibitors Market, By End-use, 2020-2033 (USD Billion) (Tons)
42. South America Clean Label Mold Inhibitors Market, By Ingredient, 2020-2033 (USD Billion) (Tons)
43. South America Clean Label Mold Inhibitors Market, By End-use, 2020-2033 (USD Billion) (Tons)
44. Brazil Clean Label Mold Inhibitors Market, By Ingredient, 2020-2033 (USD Billion) (Tons)
45. Brazil Clean Label Mold Inhibitors Market, By End-use, 2020-2033 (USD Billion) (Tons)
46. Middle East and Africa Clean Label Mold Inhibitors Market, By Ingredient, 2020-2033 (USD Billion) (Tons)
47. Middle East and Africa Clean Label Mold Inhibitors Market, By End-use, 2020-2033 (USD Billion) (Tons)
48. UAE Clean Label Mold Inhibitors Market, By Ingredient, 2020-2033 (USD Billion) (Tons)
49. UAE Clean Label Mold Inhibitors Market, By End-use, 2020-2033 (USD Billion) (Tons)
50. South Africa Clean Label Mold Inhibitors Market, By Ingredient, 2020-2033 (USD Billion) (Tons)
51. South Africa Clean Label Mold Inhibitors Market, By End-use, 2020-2033 (USD Billion) (Tons)
List of Figures
1. Global Clean Label Mold Inhibitors Market Segmentation
2. Clean Label Mold Inhibitors Market: Research Methodology
3. Market Size Estimation Methodology: Bottom-Up Approach
4. Market Size Estimation Methodology: Top-Down Approach
5. Data Triangulation
6. Porter’s Five Forces Analysis
7. Value Chain Analysis
8. Global Clean Label Mold Inhibitors Market Attractiveness Analysis By Ingredient
9. Global Clean Label Mold Inhibitors Market Attractiveness Analysis By End-use
10. Global Clean Label Mold Inhibitors Market Attractiveness Analysis By Region
11. Global Clean Label Mold Inhibitors Market: Dynamics
12. Global Clean Label Mold Inhibitors Market Share By Ingredient (2024 & 2033)
13. Global Clean Label Mold Inhibitors Market Share By End-use (2024 & 2033)
14. Global Clean Label Mold Inhibitors Market Share By Regions (2024 & 2033)
15. Global Clean Label Mold Inhibitors Market Share by Company (2023)
This study forecasts revenue at global, regional, and country levels from 2020 to 2033. The Brainy Insights has segmented the global Clean Label Mold Inhibitors market based on below-mentioned segments:
Global Clean Label Mold Inhibitors Market by Ingredient:
Global Clean Label Mold Inhibitors Market by End-use:
Global Clean Label Mold Inhibitors Market by Region:
Research has its special purpose to undertake marketing efficiently. In this competitive scenario, businesses need information across all industry verticals; the information about customer wants, market demand, competition, industry trends, distribution channels etc. This information needs to be updated regularly because businesses operate in a dynamic environment. Our organization, The Brainy Insights incorporates scientific and systematic research procedures in order to get proper market insights and industry analysis for overall business success. The analysis consists of studying the market from a miniscule level wherein we implement statistical tools which helps us in examining the data with accuracy and precision.
Our research reports feature both; quantitative and qualitative aspects for any market. Qualitative information for any market research process are fundamental because they reveal the customer needs and wants, usage and consumption for any product/service related to a specific industry. This in turn aids the marketers/investors in knowing certain perceptions of the customers. Qualitative research can enlighten about the different product concepts and designs along with unique service offering that in turn, helps define marketing problems and generate opportunities. On the other hand, quantitative research engages with the data collection process through interviews, e-mail interactions, surveys and pilot studies. Quantitative aspects for the market research are useful to validate the hypotheses generated during qualitative research method, explore empirical patterns in the data with the help of statistical tools, and finally make the market estimations.
The Brainy Insights offers comprehensive research and analysis, based on a wide assortment of factual insights gained through interviews with CXOs and global experts and secondary data from reliable sources. Our analysts and industry specialist assume vital roles in building up statistical tools and analysis models, which are used to analyse the data and arrive at accurate insights with exceedingly informative research discoveries. The data provided by our organization have proven precious to a diverse range of companies, facilitating them to address issues such as determining which products/services are the most appealing, whether or not customers use the product in the manner anticipated, the purchasing intentions of the market and many others.
Our research methodology encompasses an idyllic combination of primary and secondary initiatives. Key phases involved in this process are listed below:

The phase involves the gathering and collecting of market data and its related information with the help of different sources & research procedures.

The data procurement stage involves in data gathering and collecting through various data sources.
This stage involves in extensive research. These data sources includes:
Purchased Database: Purchased databases play a crucial role in estimating the market sizes irrespective of the domain. Our purchased database includes:
Primary Research: The Brainy Insights interacts with leading companies and experts of the concerned domain to develop the analyst team’s market understanding and expertise. It improves and substantiates every single data presented in the market reports. Primary research mainly involves in telephonic interviews, E-mail interactions and face-to-face interviews with the raw material providers, manufacturers/producers, distributors, & independent consultants. The interviews that we conduct provides valuable data on market size and industry growth trends prevailing in the market. Our organization also conducts surveys with the various industry experts in order to gain overall insights of the industry/market. For instance, in healthcare industry we conduct surveys with the pharmacists, doctors, surgeons and nurses in order to gain insights and key information of a medical product/device/equipment which the customers are going to usage. Surveys are conducted in the form of questionnaire designed by our own analyst team. Surveys plays an important role in primary research because surveys helps us to identify the key target audiences of the market. Additionally, surveys helps to identify the key target audience engaged with the market. Our survey team conducts the survey by targeting the key audience, thus gaining insights from them. Based on the perspectives of the customers, this information is utilized to formulate market strategies. Moreover, market surveys helps us to understand the current competitive situation of the industry. To be precise, our survey process typically involve with the 360 analysis of the market. This analytical process begins by identifying the prospective customers for a product or service related to the market/industry to obtain data on how a product/service could fit into customers’ lives.

Secondary Research: The secondary data sources includes information published by the on-profit organizations such as World bank, WHO, company fillings, investor presentations, annual reports, national government documents, statistical databases, blogs, articles, white papers and others. From the annual report, we analyse a company’s revenue to understand the key segment and market share of that organization in a particular region. We analyse the company websites and adopt the product mapping technique which is important for deriving the segment revenue. In the product mapping method, we select and categorize the products offered by the companies catering to domain specific market, deduce the product revenue for each of the companies so as to get overall estimation of the market size. We also source data and analyses trends based on information received from supply side and demand side intermediaries in the value chain. The supply side denotes the data gathered from supplier, distributor, wholesaler and the demand side illustrates the data gathered from the end customers for respective market domain.

The supply side for a domain specific market is analysed by:
The demand side for the market is estimated through:
In-house Library: Apart from these third-party sources, we have our in-house library of qualitative and quantitative information. Our in-house database includes market data for various industry and domains. These data are updated on regular basis as per the changing market scenario. Our library includes, historic databases, internal audit reports and archives.
Sometimes there are instances where there is no metadata or raw data available for any domain specific market. For those cases, we use our expertise to forecast and estimate the market size in order to generate comprehensive data sets. Our analyst team adopt a robust research technique in order to produce the estimates:
Data Synthesis: This stage involves the analysis & mapping of all the information obtained from the previous step. It also involves in scrutinizing the data for any discrepancy observed while data gathering related to the market. The data is collected with consideration to the heterogeneity of sources. Robust scientific techniques are in place for synthesizing disparate data sets and provide the essential contextual information that can orient market strategies. The Brainy Insights has extensive experience in data synthesis where the data passes through various stages:


Market Deduction & Formulation: The final stage comprises of assigning data points at appropriate market spaces so as to deduce feasible conclusions. Analyst perspective & subject matter expert based holistic form of market sizing coupled with industry analysis also plays a crucial role in this stage.
This stage involves in finalization of the market size and numbers that we have collected from data integration step. With data interpolation, it is made sure that there is no gap in the market data. Successful trend analysis is done by our analysts using extrapolation techniques, which provide the best possible forecasts for the market.
Data Validation & Market Feedback: Validation is the most important step in the process. Validation & re-validation via an intricately designed process helps us finalize data-points to be used for final calculations.

The Brainy Insights interacts with leading companies and experts of the concerned domain to develop the analyst team’s market understanding and expertise. It improves and substantiates every single data presented in the market reports. The data validation interview and discussion panels are typically composed of the most experienced industry members. The participants include, however, are not limited to:
Moreover, we always validate our data and findings through primary respondents from all the major regions we are working on.


Free Customization
Fortune 500 Clients
Free Yearly Update On Purchase Of Multi/Corporate License
Companies Served Till Date