- +1-315-215-1633
- sales@thebrainyinsights.com

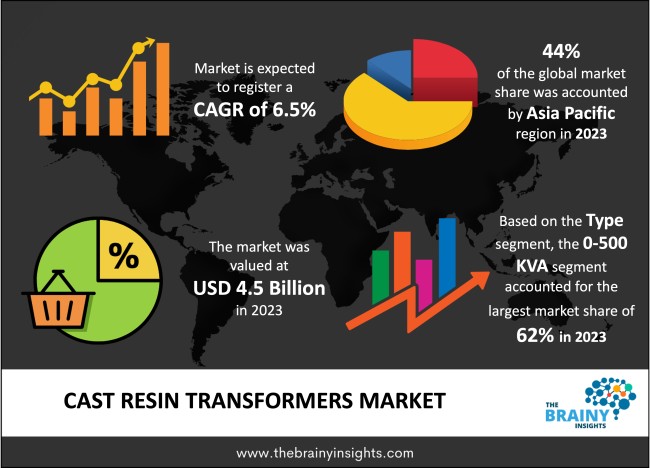
The global Cast Resin Transformers market was valued at USD 4.5 billion in 2023 and growing at a CAGR of 6.5% from 2024 to 2033. The market is expected to reach USD 8.45 billion by 2033. Increased demand for energy efficiency and increased electricity consumption in the market will potentially drive the growth of the Cast Resin Transformers Market. Whereas, rapidly growing power grid infrastructure and favorable government policies may drive the growth of the Cast Resin Transformers Market in the period forecasted.
Cast resin transformers, which are a category of dry-type transformers, employ epoxy resin encapsulation to safeguard the core and windings from environmental and mechanical influences. In this design, both the primary and secondary windings are embedded in epoxy resin. Once cast, the resin solidifies into a robust insulating layer. This method removes the need for a liquid cooling agent, like oil, which is frequently used in other transformer varieties.
Get an overview of this study by requesting a free sample
Increased demand for energy efficiency– The surge in demand for energy efficiency has become a crucial catalyst propelling the rapid expansion of the dry-type transformer market. With nations worldwide confronting the challenges of climate change and striving to cut down on carbon emissions, there's been a notable shift toward adopting sustainable energy consumption practices. This escalating demand for energy efficiency is driving the widespread adoption of dry-type transformers. According to the International Energy Agency (IEA), global energy demand is projected to increase by 1.8% annually from 2021 to 2030. In 2022, global investments in energy efficiency soared to USD 560 billion, marking a 16% increase from 2021, and this upward trajectory is expected to persist in the years ahead. Various countries have implemented measures to enhance energy efficiency. For instance, American households are eligible for a tax credit covering up to 10% of the expenses for energy-efficient upgrades. Additionally, in 2021, the European Commission revised its eco-design and energy labeling regulations, introducing new standards for various products. Dry-type transformers boast higher energy efficiency because they eschew the use of oil for winding cooling, thereby eliminating a significant source of energy loss.
Increased installation and maintenance costs– The expansion of the dry type transformer market faces several challenges, with one prominent hurdle being the significant cost difference between dry type transformers and their oil-filled counterparts. This price gap considerably limits their widespread adoption across various industries and applications. Dry type transformers require a larger initial investment due to their reliance on specialized materials, advanced insulation techniques, and intricate manufacturing processes. Furthermore, these transformers rely on materials with excellent heat conduction and dissipation capabilities, such as aluminum or copper, which often undergo special coatings or unique designs to enhance heat transfer from the windings.
Rapidly growing power grid infrastructure- As the global transition to cleaner energy sources gains momentum and decentralized power generation becomes more prevalent, there's a growing need for transformers that can effectively handle fluctuating loads and power variations. Dry-type transformers are exceptionally suited to meet these demands due to their adaptability and resilience, making them a preferred choice for accommodating the diverse energy requirements of modern power grids. With the widespread adoption of smart grid technologies and initiatives aimed at grid modernization, there's an increasing demand for transformers that offer both flexibility and high performance. This evolving landscape presents a significant opportunity for manufacturers specializing in dry-type transformers, especially as the expansion of electrical infrastructure worldwide continues to advance.
The regions analyzed for the market include North America, Europe, South America, Asia Pacific, the Middle East, and Africa. APAC emerged as the largest global Cast Resin Transformers market, accounting for 44% of the total market. Owing to huge consumer base in the region, and rapidly growing demand for electricity consumption in the region. Whereas North America exhibits the highest growth rate in the market owing to rapidly growing investments in Cast Resin Transformers industry.
APAC Region Cast Resin Transformers Market Share in 2023 - 44%
www.thebrainyinsights.com
Check the geographical analysis of this market by requesting a free sample
0-500 KVA has dominated the market accounting for 62% of the total market in the year 2023. With their adaptability and low-risk attributes, cast resin transformers within this range prove ideal for various applications, including demanding environments. These transformers boast self-extinguishing properties, necessitate minimal maintenance, and exhibit high short-time overload capacity. Additionally, they are compact, resistant to cracking, and promote environmental sustainability. Despite their initial cost being higher than oil-cooled transformers, they offer durability and safety across diverse settings. Whereas, 500-1000 KVA is expected to provide a lucrative growth rate in the future, owing to its increasing use in the industrial, commercial, and other applications in the global market.
The industrial segment has dominated the Cast Resin Transformers market. Thereby acquiring 40% in the year 2023. Owing to the rising demand for Cast Resin Transformers in various industries ranging from marine, chemical, power among others. Urban Power Grid happens to be the fastest-growing segment within the market. Owing to increasing collaborations, and other strategic initiatives by the private players in the global market.
| Attribute | Description |
|---|---|
| Market Size | Revenue (USD Billion) |
| Market size value in 2023 | USD 4.5 Billion |
| Market size value in 2033 | USD 8.45 Billion |
| CAGR (2024 to 2033) | 6.5% |
| Historical data | 2020-2022 |
| Base Year | 2023 |
| Forecast | 2024-2033 |
| Region | The regions analyzed for the market are Asia Pacific, Europe, South America, North America, and Middle East & Africa. Furthermore, the regions are further analyzed at the country level. |
| Segments | Type, Application |
As per The Brainy Insights, the size of the cast resin transformers market was valued at USD 4.5 billion in 2023 to USD 8.45 billion by 2033.
The global cast resin transformers market is growing at a CAGR of 6.5% during the forecast period 2024-2033.
The Asia Pacific region emerged as the largest market for the cast resin transformers.
The increased demand for energy efficiency will influence the market's growth.
1. Introduction
1.1. Objectives of the Study
1.2. Market Definition
1.3. Research Scope
1.4. Currency
1.5. Key Target Audience
2. Research Methodology and Assumptions
3. Executive Summary
4. Premium Insights
4.1. Porter’s Five Forces Analysis
4.2. Value Chain Analysis
4.3. Top Investment Pockets
4.3.1. Market Attractiveness Analysis by Type
4.3.2. Market Attractiveness Analysis by Application
4.3.3. Market Attractiveness Analysis by Region
4.4. Industry Trends
5. Market Dynamics
5.1. Market Evaluation
5.2. Drivers
5.2.1. Increased demand for energy efficiency
5.2.2. Increased electricity consumption in the market
5.3. Restraints
5.3.1. Increased installation and maintenance costs
5.4. Opportunities
5.4.1. Rapidly growing power grid infrastructure
5.4.2. Favorable government policies
5.5. Challenges
5.5.1. Lack of access to power ratings and preference of oil-filled transformers in the global market
6. Global Cast Resin Transformers Market Analysis and Forecast, By Type
6.1. Segment Overview
6.2. 0-500 KVA
6.3. 500-1000 KVA
6.4. 1000-2000 KVA
6.5. Above 2000 KVA
7. Global Cast Resin Transformers Market Analysis and Forecast, By Application
7.1. Segment Overview
7.2. Urban Power Grid
7.3. Transportation
7.4. Industry
7.5. Energy and Smelting
7.6. Others
8. Global Cast Resin Transformers Market Analysis and Forecast, By Regional Analysis
8.1. Segment Overview
8.2. North America
8.2.1. U.S.
8.2.2. Canada
8.2.3. Mexico
8.3. Europe
8.3.1. Germany
8.3.2. France
8.3.3. U.K.
8.3.4. Italy
8.3.5. Spain
8.4. Asia-Pacific
8.4.1. Japan
8.4.2. China
8.4.3. India
8.5. South America
8.5.1. Brazil
8.6. Middle East and Africa
8.6.1. UAE
8.6.2. South Africa
9. Global Cast Resin Transformers Market-Competitive Landscape
9.1. Overview
9.2. Market Share of Key Players in Global Cast Resin Transformers Market
9.2.1. Global Company Market Share
9.2.2. North America Company Market Share
9.2.3. Europe Company Market Share
9.2.4. APAC Company Market Share
9.3. Competitive Situations and Trends
9.3.1. Product Launches and Developments
9.3.2. Partnerships, Collaborations, and Agreements
9.3.3. Mergers & Acquisitions
9.3.4. Expansions
10. Company Profiles
10.1. JSHP Transformer
10.1.1. Business Overview
10.1.2. Company Snapshot
10.1.3. Company Market Share Analysis
10.1.4. Company Product Portfolio
10.1.5. Recent Developments
10.1.6. SWOT Analysis
10.2. TBEA
10.2.1. Business Overview
10.2.2. Company Snapshot
10.2.3. Company Market Share Analysis
10.2.4. Company Product Portfolio
10.2.5. Recent Developments
10.2.6. SWOT Analysis
10.3. Jinpan International
10.3.1. Business Overview
10.3.2. Company Snapshot
10.3.3. Company Market Share Analysis
10.3.4. Company Product Portfolio
10.3.5. Recent Developments
10.3.6. SWOT Analysis
10.4. Sunten Electric
10.4.1. Business Overview
10.4.2. Company Snapshot
10.4.3. Company Market Share Analysis
10.4.4. Company Product Portfolio
10.4.5. Recent Developments
10.4.6. SWOT Analysis
10.5. Jinshanmen
10.5.1. Business Overview
10.5.2. Company Snapshot
10.5.3. Company Market Share Analysis
10.5.4. Company Product Portfolio
10.5.5. Recent Developments
10.5.6. SWOT Analysis
10.6. Voltamp Transformers
10.6.1. Business Overview
10.6.2. Company Snapshot
10.6.3. Company Market Share Analysis
10.6.4. Company Product Portfolio
10.6.5. Recent Developments
10.6.6. SWOT Analysis
10.7. Toshiba
10.7.1. Business Overview
10.7.2. Company Snapshot
10.7.3. Company Market Share Analysis
10.7.4. Company Product Portfolio
10.7.5. Recent Developments
10.7.6. SWOT Analysis
10.8. Fuji Electric
10.8.1. Business Overview
10.8.2. Company Snapshot
10.8.3. Company Market Share Analysis
10.8.4. Company Product Portfolio
10.8.5. Recent Developments
10.8.6. SWOT Analysis
10.9. Hitachi
10.9.1. Business Overview
10.9.2. Company Snapshot
10.9.3. Company Market Share Analysis
10.9.4. Company Product Portfolio
10.9.5. Recent Developments
10.9.6. SWOT Analysis
10.10. Hyosung Heavy Industries
10.10.1. Business Overview
10.10.2. Company Snapshot
10.10.3. Company Market Share Analysis
10.10.4. Company Product Portfolio
10.10.5. Recent Developments
10.10.6. SWOT Analysis
List of Table
1. Global Cast Resin Transformers Market, By Type, 2020-2033 (USD Billion)
2. Global 0-500 KVA, Cast Resin Transformers Market, By Region, 2020-2033 (USD Billion)
3. Global 500-1000 KVA, Cast Resin Transformers Market, By Region, 2020-2033 (USD Billion)
4. Global 1000-2000 KVA, Cast Resin Transformers Market, By Region, 2020-2033 (USD Billion)
5. Global Above 2000 KVA, Cast Resin Transformers Market, By Region, 2020-2033 (USD Billion)
6. Global Cast Resin Transformers Market, By Application, 2020-2033 (USD Billion)
7. Global Urban Power Grid, Cast Resin Transformers Market, By Region, 2020-2033 (USD Billion)
8. Global Transportation, Cast Resin Transformers Market, By Region, 2020-2033 (USD Billion)
9. Global Industry, Cast Resin Transformers Market, By Region, 2020-2033 (USD Billion)
10. Global Energy and Smelting, Cast Resin Transformers Market, By Region, 2020-2033 (USD Billion)
11. Global Others, Cast Resin Transformers Market, By Region, 2020-2033 (USD Billion)
12. Global Cast Resin Transformers Market, By Region, 2020-2033 (USD Billion)
13. North America Cast Resin Transformers Market, By Type, 2020-2033 (USD Billion)
14. North America Cast Resin Transformers Market, By Application, 2020-2033 (USD Billion)
15. U.S. Cast Resin Transformers Market, By Type, 2020-2033 (USD Billion)
16. U.S. Cast Resin Transformers Market, By Application, 2020-2033 (USD Billion)
17. Canada Cast Resin Transformers Market, By Type, 2020-2033 (USD Billion)
18. Canada Cast Resin Transformers Market, By Application, 2020-2033 (USD Billion)
19. Mexico Cast Resin Transformers Market, By Type, 2020-2033 (USD Billion)
20. Mexico Cast Resin Transformers Market, By Application, 2020-2033 (USD Billion)
21. Europe Cast Resin Transformers Market, By Type, 2020-2033 (USD Billion)
22. Europe Cast Resin Transformers Market, By Application, 2020-2033 (USD Billion)
23. Germany Cast Resin Transformers Market, By Type, 2020-2033 (USD Billion)
24. Germany Cast Resin Transformers Market, By Application, 2020-2033 (USD Billion)
25. France Cast Resin Transformers Market, By Type, 2020-2033 (USD Billion)
26. France Cast Resin Transformers Market, By Application, 2020-2033 (USD Billion)
27. U.K. Cast Resin Transformers Market, By Type, 2020-2033 (USD Billion)
28. U.K. Cast Resin Transformers Market, By Application, 2020-2033 (USD Billion)
29. Italy Cast Resin Transformers Market, By Type, 2020-2033 (USD Billion)
30. Italy Cast Resin Transformers Market, By Application, 2020-2033 (USD Billion)
31. Spain Cast Resin Transformers Market, By Type, 2020-2033 (USD Billion)
32. Spain Cast Resin Transformers Market, By Application, 2020-2033 (USD Billion)
33. Asia Pacific Cast Resin Transformers Market, By Type, 2020-2033 (USD Billion)
34. Asia Pacific Cast Resin Transformers Market, By Application, 2020-2033 (USD Billion)
35. Japan Cast Resin Transformers Market, By Type, 2020-2033 (USD Billion)
36. Japan Cast Resin Transformers Market, By Application, 2020-2033 (USD Billion)
37. China Cast Resin Transformers Market, By Type, 2020-2033 (USD Billion)
38. China Cast Resin Transformers Market, By Application, 2020-2033 (USD Billion)
39. India Cast Resin Transformers Market, By Type, 2020-2033 (USD Billion)
40. India Cast Resin Transformers Market, By Application, 2020-2033 (USD Billion)
41. South America Cast Resin Transformers Market, By Type, 2020-2033 (USD Billion)
42. South America Cast Resin Transformers Market, By Application, 2020-2033 (USD Billion)
43. Brazil Cast Resin Transformers Market, By Type, 2020-2033 (USD Billion)
44. Brazil Cast Resin Transformers Market, By Application, 2020-2033 (USD Billion)
45. Middle East and Africa Cast Resin Transformers Market, By Type, 2020-2033 (USD Billion)
46. Middle East and Africa Cast Resin Transformers Market, By Application, 2020-2033 (USD Billion)
47. UAE Cast Resin Transformers Market, By Type, 2020-2033 (USD Billion)
48. UAE Cast Resin Transformers Market, By Application, 2020-2033 (USD Billion)
49. South Africa Cast Resin Transformers Market, By Type, 2020-2033 (USD Billion)
50. South Africa Cast Resin Transformers Market, By Application, 2020-2033 (USD Billion)
List of Figures
1. Global Cast Resin Transformers Market Segmentation
2. Global Cast Resin Transformers Market: Research Methodology
3. Market Size Estimation Methodology: Bottom-Up Approach
4. Market Size Estimation Methodology: Top-Down Approach
5. Data Triangulation
6. Porter’s Five Forces Analysis
7. Value Chain Analysis
8. Global Cast Resin Transformers Market Attractiveness Analysis by Type
9. Global Cast Resin Transformers Market Attractiveness Analysis by Application
10. Global Cast Resin Transformers Market Attractiveness Analysis by Region
11. Global Cast Resin Transformers Market: Dynamics
12. Global Cast Resin Transformers Market Share by Type (2023 & 2033)
13. Global Cast Resin Transformers Market Share by Application (2023 & 2033)
14. Global Cast Resin Transformers Market Share by Regions (2023 & 2033)
15. Global Cast Resin Transformers Market Share by Company (2023)
This study forecasts revenue at global, regional, and country levels from 2020 to 2033. The Brainy Insights has segmented the global cast resin transformers market based on below-mentioned segments:
Global Cast Resin Transformers Market by Type:
Global Cast Resin Transformers Market by Application:
Global Cast Resin Transformers Market by Region:
Research has its special purpose to undertake marketing efficiently. In this competitive scenario, businesses need information across all industry verticals; the information about customer wants, market demand, competition, industry trends, distribution channels etc. This information needs to be updated regularly because businesses operate in a dynamic environment. Our organization, The Brainy Insights incorporates scientific and systematic research procedures in order to get proper market insights and industry analysis for overall business success. The analysis consists of studying the market from a miniscule level wherein we implement statistical tools which helps us in examining the data with accuracy and precision.
Our research reports feature both; quantitative and qualitative aspects for any market. Qualitative information for any market research process are fundamental because they reveal the customer needs and wants, usage and consumption for any product/service related to a specific industry. This in turn aids the marketers/investors in knowing certain perceptions of the customers. Qualitative research can enlighten about the different product concepts and designs along with unique service offering that in turn, helps define marketing problems and generate opportunities. On the other hand, quantitative research engages with the data collection process through interviews, e-mail interactions, surveys and pilot studies. Quantitative aspects for the market research are useful to validate the hypotheses generated during qualitative research method, explore empirical patterns in the data with the help of statistical tools, and finally make the market estimations.
The Brainy Insights offers comprehensive research and analysis, based on a wide assortment of factual insights gained through interviews with CXOs and global experts and secondary data from reliable sources. Our analysts and industry specialist assume vital roles in building up statistical tools and analysis models, which are used to analyse the data and arrive at accurate insights with exceedingly informative research discoveries. The data provided by our organization have proven precious to a diverse range of companies, facilitating them to address issues such as determining which products/services are the most appealing, whether or not customers use the product in the manner anticipated, the purchasing intentions of the market and many others.
Our research methodology encompasses an idyllic combination of primary and secondary initiatives. Key phases involved in this process are listed below:

The phase involves the gathering and collecting of market data and its related information with the help of different sources & research procedures.

The data procurement stage involves in data gathering and collecting through various data sources.
This stage involves in extensive research. These data sources includes:
Purchased Database: Purchased databases play a crucial role in estimating the market sizes irrespective of the domain. Our purchased database includes:
Primary Research: The Brainy Insights interacts with leading companies and experts of the concerned domain to develop the analyst team’s market understanding and expertise. It improves and substantiates every single data presented in the market reports. Primary research mainly involves in telephonic interviews, E-mail interactions and face-to-face interviews with the raw material providers, manufacturers/producers, distributors, & independent consultants. The interviews that we conduct provides valuable data on market size and industry growth trends prevailing in the market. Our organization also conducts surveys with the various industry experts in order to gain overall insights of the industry/market. For instance, in healthcare industry we conduct surveys with the pharmacists, doctors, surgeons and nurses in order to gain insights and key information of a medical product/device/equipment which the customers are going to usage. Surveys are conducted in the form of questionnaire designed by our own analyst team. Surveys plays an important role in primary research because surveys helps us to identify the key target audiences of the market. Additionally, surveys helps to identify the key target audience engaged with the market. Our survey team conducts the survey by targeting the key audience, thus gaining insights from them. Based on the perspectives of the customers, this information is utilized to formulate market strategies. Moreover, market surveys helps us to understand the current competitive situation of the industry. To be precise, our survey process typically involve with the 360 analysis of the market. This analytical process begins by identifying the prospective customers for a product or service related to the market/industry to obtain data on how a product/service could fit into customers’ lives.

Secondary Research: The secondary data sources includes information published by the on-profit organizations such as World bank, WHO, company fillings, investor presentations, annual reports, national government documents, statistical databases, blogs, articles, white papers and others. From the annual report, we analyse a company’s revenue to understand the key segment and market share of that organization in a particular region. We analyse the company websites and adopt the product mapping technique which is important for deriving the segment revenue. In the product mapping method, we select and categorize the products offered by the companies catering to domain specific market, deduce the product revenue for each of the companies so as to get overall estimation of the market size. We also source data and analyses trends based on information received from supply side and demand side intermediaries in the value chain. The supply side denotes the data gathered from supplier, distributor, wholesaler and the demand side illustrates the data gathered from the end customers for respective market domain.

The supply side for a domain specific market is analysed by:
The demand side for the market is estimated through:
In-house Library: Apart from these third-party sources, we have our in-house library of qualitative and quantitative information. Our in-house database includes market data for various industry and domains. These data are updated on regular basis as per the changing market scenario. Our library includes, historic databases, internal audit reports and archives.
Sometimes there are instances where there is no metadata or raw data available for any domain specific market. For those cases, we use our expertise to forecast and estimate the market size in order to generate comprehensive data sets. Our analyst team adopt a robust research technique in order to produce the estimates:
Data Synthesis: This stage involves the analysis & mapping of all the information obtained from the previous step. It also involves in scrutinizing the data for any discrepancy observed while data gathering related to the market. The data is collected with consideration to the heterogeneity of sources. Robust scientific techniques are in place for synthesizing disparate data sets and provide the essential contextual information that can orient market strategies. The Brainy Insights has extensive experience in data synthesis where the data passes through various stages:


Market Deduction & Formulation: The final stage comprises of assigning data points at appropriate market spaces so as to deduce feasible conclusions. Analyst perspective & subject matter expert based holistic form of market sizing coupled with industry analysis also plays a crucial role in this stage.
This stage involves in finalization of the market size and numbers that we have collected from data integration step. With data interpolation, it is made sure that there is no gap in the market data. Successful trend analysis is done by our analysts using extrapolation techniques, which provide the best possible forecasts for the market.
Data Validation & Market Feedback: Validation is the most important step in the process. Validation & re-validation via an intricately designed process helps us finalize data-points to be used for final calculations.

The Brainy Insights interacts with leading companies and experts of the concerned domain to develop the analyst team’s market understanding and expertise. It improves and substantiates every single data presented in the market reports. The data validation interview and discussion panels are typically composed of the most experienced industry members. The participants include, however, are not limited to:
Moreover, we always validate our data and findings through primary respondents from all the major regions we are working on.


Free Customization
Fortune 500 Clients
Free Yearly Update On Purchase Of Multi/Corporate License
Companies Served Till Date