- +1-315-215-1633
- sales@thebrainyinsights.com

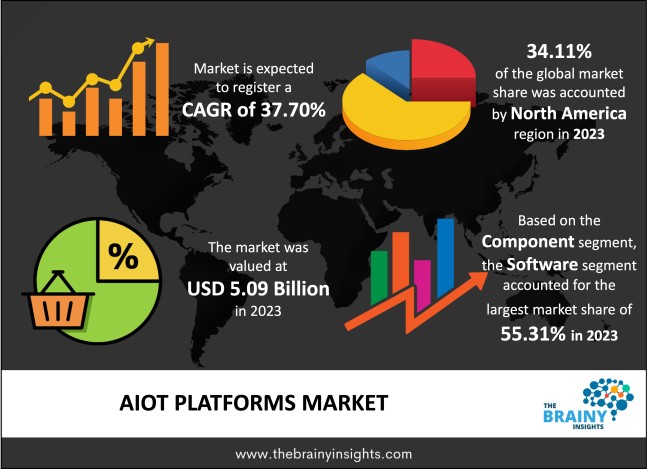
The global AIoT Platforms market was valued at USD 5.09 Billion in 2023 and growing at a CAGR of 37.7% from 2024 to 2033. The market is expected to reach USD 124.87 Billion by 2033. The surge in Artificial Intelligence has led to its use in several sectors. It is used to optimize resource utilization and improve decision-making. This technology becomes completely transformative when combined with the Internet of Things devices and can enable anything from automation of municipal infrastructure to ease the monitoring of patients in the hospital. Integrating AI with wearables, medical devices, and healthcare systems helps practitioners gain deeper insights into patient health. It helps improve the accuracy of diagnosis and supports personalized treatment. These factors are eventually driving the growth of the AIoT platform market.
The merging of AI and the Internet of Things (IoT) is called Artificial Intelligence of Things (IoT), and it is speeding up the digital transformation. This platform adds AI programming with IoT devices like smart TVs, sensors, security cameras, or thermostats. When installed on a large scale, it can manage many things, i.e., from managing the city traffic flow to improving the remote patient monitoring of the hospitals. AI algorithms help the devices collect and analyze large amounts of data, get valuable insights, and make intelligent decisions. It helps in improving the functionality and efficiency of the IoT devices. In smart homes, AIoT helps with seamless automation, improvement in energy efficiency, and enhanced security to bring the intelligence home. For Instance, smart thermostats automatically adjust based on the environment, and security cameras can identify unwanted intruders and unplanned guests, animals, and cars. Moreover, AIoT helps the computer to shunt part of its processing requirement to another computer in the same network. It decreases the latency and improves the security. It also helps in quick decision-making. AIoT can be helpful for smart cities, where the technology can empower municipalities to improve the utilization of resources. It helps streamline traffic management and improves public safety. For Instance, in Zurich, the sensor automates the street light and helps in the traffic flow, leading to around a 70% decrease in energy consumption. The smart cities use AIoT for better traffic management, energy consumption and waste management optimization. Hence, AIoT solutions have significantly grown in several sectors due to advancements in AI algorithms, IoT devices, and edge computing infrastructure. Moreover, AIoT helps in the fast detection of environmental hazards, thus taking care of sustainability and improving urban living standards. Similarly, AIoT helps in precision farming, livestock management, crop monitoring, and resource optimization in agriculture, thus strengthening food security and sustainability. Transportation has also transformed with the use of AIoT in autonomous vehicles. It helps in the predictive maintenance of the fleets, optimization of routes and smart logistics. Hence, all these factors drive the AIoT Platforms market.
Get an overview of this study by requesting a free sample
Growing use in several sectors – The use of AIoT is significantly growing in several sectors. For instance, in retail, AIoT helps with personalized marketing, customer engagement, inventory management, and seamless checkout experiences. It helps improve customer satisfaction, which increases revenue growth. Similarly, in the healthcare sector, AIoT helps with remote patient monitoring, predictive maintenance of medical equipment, and personalized treatment. Thus, it improves patient outcomes and decreases the cost of healthcare. All the organizations globally are adopting the AIoT for innovation, enhanced efficiency and competitiveness. AIoT uses AI algorithms to process data collected from IoT devices, wearables, sensors, and appliances. It helps enhance the capabilities of manufacturing, smart cities, healthcare, retail, agriculture, etc. All these factors are eventually driving the AIoT Platforms market.
Shortage of Skilled Professionals– The AIoT market is becoming restricted due to a shortage of skilled workforces and a lack of awareness about new technologies, especially in the remote areas of emerging economies and underdeveloped countries. Also, the surge in the complexities and constant change in the IT architecture limit growth. Moreover, there are security and privacy concerns as the interconnected devices raise the vulnerability to unauthorized accessibility and cyber threats. All these factors are acting as restraints for the market to grow.
Advancement in technology – There will be advancements in technology like 5G connectivity, edge computing and improvement in AI algorithms, which will increase the use of AIoT in various domains. The arrival of AIoT platforms and their ecosystems will help democratize the accessibility of their capabilities, which will help even small and medium enterprises use this advanced technology. Also, there is an integration of AIoT with other evolving technologies like virtual reality, augmented reality and blockchain, which opens new use cases and business models that could lead to innovation and disruptions. As the AIoT evolves, it increases human capabilities and revolutionizes intelligence and connectivity. All these factors would, in turn, drive the AIoT Platforms market in the forecasting period.
The regions analyzed for the market include North America, Europe, South America, Asia Pacific, the Middle East, and Africa. North America emerged as the largest market for the global AIoT Platforms market, with a 34.11% share of the market revenue in 2023. This market share is attributed to the surge in the adoption of AIoT by the automotive and manufacturing sectors and the availability of key solution providers in the region. The manufacturing sectors in the region are food & beverage and tobacco manufacturing, fabricated metal products and machinery, which are swiftly adopting the AIoT technology. There has also been growth in the adoption of IoT devices and AI technology advancements. The demand for automation and data analytics has also increased in many sectors. All these factors are driving the AIoT Platforms market in the region.
North America Region AIoT Platforms Market Share in 2023 - 34.11%
www.thebrainyinsights.com
Check the geographical analysis of this market by requesting a free sample
The component size segment is divided into software and services. The software segment dominated the market, with a market share of around 55.31% in 2023. This significant market share is attributed to the software's help streamlining device management by offering real-time insights into the device's performance, identifying issues, and predicting maintenance requirements. It also helps in running the application smoothly and securely and meets the requirements of the organizations.
The deployment type segment is divided into cloud and on-premise. Cloud segment dominated the market, with a market share of around 53.66% in 2023. This market share is attributed to the elimination of firewall restrictions by the cloud-based AIoS, which can restrict the accessibility of the on-premise solution. Moreover, the maintenance and overhead costs are also getting eliminated, and scale can be increased with the use of cloud-based platforms.
The end user segment is divided into manufacturing, healthcare, infrastructure, BFSI, retail and others. Manufacturing segment dominated the market, with a market share of around 35.87% in 2023. This market share is attributed to the growing use of AIoT in the manufacturing sector. AIoT is broadly used for quality control, predictive maintenance, autonomous production processes, and supply chain optimisation, leading to a surge in operational efficiency and decreased downtime.
| Attribute | Description |
|---|---|
| Market Size | Revenue (USD Billion) |
| Market size value in 2023 | USD 5.09 Billion |
| Market size value in 2033 | USD 124.87 Billion |
| CAGR (2024 to 2033) | 37.70% |
| Historical data | 2020-2022 |
| Base Year | 2023 |
| Forecast | 2024-2033 |
| Region | The regions analyzed for the market are Asia Pacific, Europe, South America, North America, and Middle East & Africa. Furthermore, the regions are further analyzed at the country level. |
| Segments | Component, Deployment Type and End User |
North America region emerged as the largest market for the AIoT Platforms.
The market's growth will be influenced by Growing use in several sectors.
Shortage of Skilled Professionals hamper the market growth.
Advancement in technology will provide huge opportunities to the market.
1. Introduction
1.1. Objectives of the Study
1.2. Market Definition
1.3. Research Scope
1.4. Currency
1.5. Key Target Audience
2. Research Methodology and Assumptions
3. Executive Summary
4. Premium Insights
4.1. Porter’s Five Forces Analysis
4.2. Value Chain Analysis
4.3. Top Investment Pockets
4.3.1. Market Attractiveness Analysis By Component
4.3.2. Market Attractiveness Analysis By Deployment Type
4.3.3. Market Attractiveness Analysis By End User
4.3.4. Market Attractiveness Analysis By Region
4.4. Industry Trends
5. Market Dynamics
5.1. Market Evaluation
5.2. Drivers
5.2.1. Growing use in several sectors
5.3. Restraints
5.3.1. Shortage of Skilled Professionals
5.4. Opportunities
5.4.1. Advancement in technology
5.5. Challenges
5.5.1. Economic slowdown
6. Global Reconstruction Solution Market Analysis and Forecast, By Component
6.1. Segment Overview
6.2. Software
6.3. Services
7. Global Reconstruction Solution Market Analysis and Forecast, By Deployment Type
7.1. Segment Overview
7.2. Cloud
7.3. On-Premise
8. Global Reconstruction Solution Market Analysis and Forecast, By End User
8.1. Segment Overview
8.2. Manufacturing
8.3. Healthcare
8.4. Infrastructure
8.5. BFSI
8.6. Retail
8.7. Others
9. Global Reconstruction Solution Market Analysis and Forecast, By Regional Analysis
9.1. Segment Overview
9.2. North America
9.2.1. U.S.
9.2.2. Canada
9.2.3. Mexico
9.3. Europe
9.3.1. Germany
9.3.2. France
9.3.3. U.K.
9.3.4. Italy
9.3.5. Spain
9.4. Asia-Pacific
9.4.1. Japan
9.4.2. China
9.4.3. India
9.5. South America
9.5.1. Brazil
9.6. Middle East and Africa
9.6.1. UAE
9.6.2. South Africa
10. Global Reconstruction Solution Market-Competitive Landscape
10.1. Overview
10.2. Market Share of Key Players in Global Reconstruction Solution Market
10.2.1. Global Company Market Share
10.2.2. North America Company Market Share
10.2.3. Europe Company Market Share
10.2.4. APAC Company Market Share
10.3. Competitive Situations and Trends
10.3.1. Component Launches and Developments
10.3.2. Partnerships, Collaborations, and Agreements
10.3.3. Mergers & Acquisitions
10.3.4. Expansions
11. Company Profiles
11.1. Amazon Web Services (AWS)
11.1.1. Business Overview
11.1.2. Company Snapshot
11.1.3. Company Market Share Analysis
11.1.4. Company Component Portfolio
11.1.5. Recent Developments
11.1.6. SWOT Analysis
11.2. Oracle Corporation
11.2.1. Business Overview
11.2.2. Company Snapshot
11.2.3. Company Market Share Analysis
11.2.4. Company Component Portfolio
11.2.5. Recent Developments
11.2.6. SWOT Analysis
11.3. Google LLC
11.3.1. Business Overview
11.3.2. Company Snapshot
11.3.3. Company Market Share Analysis
11.3.4. Company Component Portfolio
11.3.5. Recent Developments
11.3.6. SWOT Analysis
11.4. C3.AI, Inc.
11.4.1. Business Overview
11.4.2. Company Snapshot
11.4.3. Company Market Share Analysis
11.4.4. Company Component Portfolio
11.4.5. Recent Developments
11.4.6. SWOT Analysis
11.5. GE Electric
11.5.1. Business Overview
11.5.2. Company Snapshot
11.5.3. Company Market Share Analysis
11.5.4. Company Component Portfolio
11.5.5. Recent Developments
11.5.6. SWOT Analysis
11.6. IBM Corporation
11.6.1. Business Overview
11.6.2. Company Snapshot
11.6.3. Company Market Share Analysis
11.6.4. Company Component Portfolio
11.6.5. Recent Developments
11.6.6. SWOT Analysis
11.7. SAP SE
11.7.1. Business Overview
11.7.2. Company Snapshot
11.7.3. Company Market Share Analysis
11.7.4. Company Component Portfolio
11.7.5. Recent Developments
11.7.6. SWOT Analysis
11.8. SAS Institute Inc.
11.8.1. Business Overview
11.8.2. Company Snapshot
11.8.3. Company Market Share Analysis
11.8.4. Company Component Portfolio
11.8.5. Recent Developments
11.8.6. SWOT Analysis
11.9. Hitachi, Ltd
11.9.1. Business Overview
11.9.2. Company Snapshot
11.9.3. Company Market Share Analysis
11.9.4. Company Component Portfolio
11.9.5. Recent Developments
11.9.6. SWOT Analysis
11.10. Cisco Systems Inc.
11.10.1. Business Overview
11.10.2. Company Snapshot
11.10.3. Company Market Share Analysis
11.10.4. Company Component Portfolio
11.10.5. Recent Developments
11.10.6. SWOT Analysis
11.11. Microsoft Corporation
11.11.1. Business Overview
11.11.2. Company Snapshot
11.11.3. Company Market Share Analysis
11.11.4. Company Component Portfolio
11.11.5. Recent Developments
11.11.6. SWOT Analysis
11.12. PTC Inc.
11.12.1. Business Overview
11.12.2. Company Snapshot
11.12.3. Company Market Share Analysis
11.12.4. Company Component Portfolio
11.12.5. Recent Developments
11.12.6. SWOT Analysis
11.13. Autoplant System India Pvt. Ltd
11.13.1. Business Overview
11.13.2. Company Snapshot
11.13.3. Company Market Share Analysis
11.13.4. Company Component Portfolio
11.13.5. Recent Developments
11.13.6. SWOT Analysis
List of Table
1. Global Reconstruction Solution Market, By Component, 2020-2033 (USD Billion)
2. Global Software, Reconstruction Solution Market, By Region, 2020-2033 (USD Billion)
3. Global Services, Reconstruction Solution Market, By Region, 2020-2033 (USD Billion)
4. Global Reconstruction Solution Market, By Deployment Type, 2020-2033 (USD Billion)
5. Global Cloud, Reconstruction Solution Market, By Region, 2020-2033 (USD Billion)
6. Global On-Premise, Reconstruction Solution Market, By Region, 2020-2033 (USD Billion)
7. Global Reconstruction Solution Market, By End User, 2020-2033 (USD Billion)
8. Global Manufacturing, Reconstruction Solution Market, By Region, 2020-2033 (USD Billion)
9. Global Healthcare, Reconstruction Solution Market, By Region, 2020-2033 (USD Billion)
10. Global Infrastructure, Reconstruction Solution Market, By Region, 2020-2033 (USD Billion)
11. Global BFSI, Reconstruction Solution Market, By Region, 2020-2033 (USD Billion)
12. Global Retail, Reconstruction Solution Market, By Region, 2020-2033 (USD Billion)
13. Global Others, Reconstruction Solution Market, By Region, 2020-2033 (USD Billion)
14. North America Reconstruction Solution Market, By Component, 2020-2033 (USD Billion)
15. North America Reconstruction Solution Market, By Deployment Type, 2020-2033 (USD Billion)
16. North America Reconstruction Solution Market, By End User, 2020-2033 (USD Billion)
17. U.S. Reconstruction Solution Market, By Component, 2020-2033 (USD Billion)
18. U.S. Reconstruction Solution Market, By Deployment Type, 2020-2033 (USD Billion)
19. U.S. Reconstruction Solution Market, By End User, 2020-2033 (USD Billion)
20. Canada Reconstruction Solution Market, By Component, 2020-2033 (USD Billion)
21. Canada Reconstruction Solution Market, By Deployment Type, 2020-2033 (USD Billion)
22. Canada Reconstruction Solution Market, By End User, 2020-2033 (USD Billion)
23. Mexico Reconstruction Solution Market, By Component, 2020-2033 (USD Billion)
24. Mexico Reconstruction Solution Market, By Deployment Type, 2020-2033 (USD Billion)
25. Mexico Reconstruction Solution Market, By End User, 2020-2033 (USD Billion)
26. Europe Reconstruction Solution Market, By Component, 2020-2033 (USD Billion)
27. Europe Reconstruction Solution Market, By Deployment Type, 2020-2033 (USD Billion)
28. Europe Reconstruction Solution Market, By End User, 2020-2033 (USD Billion)
29. Germany Reconstruction Solution Market, By Component, 2020-2033 (USD Billion)
30. Germany Reconstruction Solution Market, By Deployment Type, 2020-2033 (USD Billion)
31. Germany Reconstruction Solution Market, By End User, 2020-2033 (USD Billion)
32. France Reconstruction Solution Market, By Component, 2020-2033 (USD Billion)
33. France Reconstruction Solution Market, By Deployment Type, 2020-2033 (USD Billion)
34. France Reconstruction Solution Market, By End User, 2020-2033 (USD Billion)
35. U.K. Reconstruction Solution Market, By Component, 2020-2033 (USD Billion)
36. U.K. Reconstruction Solution Market, By Deployment Type, 2020-2033 (USD Billion)
37. U.K. Reconstruction Solution Market, By End User, 2020-2033 (USD Billion)
38. Italy Reconstruction Solution Market, By Component, 2020-2033 (USD Billion)
39. Italy Reconstruction Solution Market, By Deployment Type, 2020-2033 (USD Billion)
40. Italy Reconstruction Solution Market, By End User, 2020-2033 (USD Billion)
41. Spain Reconstruction Solution Market, By Component, 2020-2033 (USD Billion)
42. Spain Reconstruction Solution Market, By Deployment Type, 2020-2033 (USD Billion)
43. Spain Reconstruction Solution Market, By End User, 2020-2033 (USD Billion)
44. Asia Pacific Reconstruction Solution Market, By Component, 2020-2033 (USD Billion)
45. Asia Pacific Reconstruction Solution Market, By Deployment Type, 2020-2033 (USD Billion)
46. Asia Pacific Reconstruction Solution Market, By End User, 2020-2033 (USD Billion)
47. Japan Reconstruction Solution Market, By Component, 2020-2033 (USD Billion)
48. Japan Reconstruction Solution Market, By Deployment Type, 2020-2033 (USD Billion)
49. Japan Reconstruction Solution Market, By End User, 2020-2033 (USD Billion)
50. China Reconstruction Solution Market, By Component, 2020-2033 (USD Billion)
51. China Reconstruction Solution Market, By Deployment Type, 2020-2033 (USD Billion)
52. China Reconstruction Solution Market, By End User, 2020-2033 (USD Billion)
53. India Reconstruction Solution Market, By Component, 2020-2033 (USD Billion)
54. India Reconstruction Solution Market, By Deployment Type, 2020-2033 (USD Billion)
55. India Reconstruction Solution Market, By End User, 2020-2033 (USD Billion)
56. South America Reconstruction Solution Market, By Component, 2020-2033 (USD Billion)
57. South America Reconstruction Solution Market, By Deployment Type, 2020-2033 (USD Billion)
58. South America Reconstruction Solution Market, By End User, 2020-2033 (USD Billion)
59. Brazil Reconstruction Solution Market, By Component, 2020-2033 (USD Billion)
60. Brazil Reconstruction Solution Market, By End User, 2020-2033 (USD Billion)
61. Brazil Reconstruction Solution Market, By Deployment Type, 2020-2033 (USD Billion)
62. Middle East and Africa Reconstruction Solution Market, By Component, 2020-2033 (USD Billion)
63. Middle East and Africa Reconstruction Solution Market, By Deployment Type, 2020-2033 (USD Billion)
64. Middle East and Africa Reconstruction Solution Market, By End User, 2020-2033 (USD Billion)
65. UAE Reconstruction Solution Market, By Component, 2020-2033 (USD Billion)
66. UAE Reconstruction Solution Market, By Deployment Type, 2020-2033 (USD Billion)
67. UAE Reconstruction Solution Market, By End User, 2020-2033 (USD Billion)
68. South Africa Reconstruction Solution Market, By Component, 2020-2033 (USD Billion)
69. South Africa Reconstruction Solution Market, By Deployment Type, 2020-2033 (USD Billion)
70. South Africa Reconstruction Solution Market, By End User, 2020-2033 (USD Billion)
List of Figures
1. Global Reconstruction Solution Market Segmentation
2. Global Reconstruction Solution Market: Research Methodology
3. Market Size Estimation Methodology: Bottom-Up Approach
4. Market Size Estimation Methodology: Top-Down Approach
5. Data Triangulation
6. Porter’s Five Forces Analysis
7. Value Chain Analysis
8. Global Reconstruction Solution Market Attractiveness Analysis By Component
9. Global Reconstruction Solution Market Attractiveness Analysis By Deployment Type
10. Global Reconstruction Solution Market Attractiveness Analysis By End User
11. Global Reconstruction Solution Market Attractiveness Analysis By Region
12. Global Reconstruction Solution Market: Dynamics
13. Global Reconstruction Solution Market Share By Component (2023 & 2033)
14. Global Reconstruction Solution Market Share By Deployment Type (2023 & 2033)
15. Global Reconstruction Solution Market Share By End User (2023 & 2033)
16. Global Reconstruction Solution Market Share By Regions (2023 & 2033)
17. Global Reconstruction Solution Market Share By Company (2023)
This study forecasts revenue at global, regional, and country levels from 2020 to 2033. The Brainy Insights has segmented the global AIoT Platforms market based on below mentioned segments:
Global AIoT Platforms Market by Component:
Global AIoT Platforms Market by Deployment Type:
Global AIoT Platforms Market by End User:
Global AIoT Platforms by Region:
Research has its special purpose to undertake marketing efficiently. In this competitive scenario, businesses need information across all industry verticals; the information about customer wants, market demand, competition, industry trends, distribution channels etc. This information needs to be updated regularly because businesses operate in a dynamic environment. Our organization, The Brainy Insights incorporates scientific and systematic research procedures in order to get proper market insights and industry analysis for overall business success. The analysis consists of studying the market from a miniscule level wherein we implement statistical tools which helps us in examining the data with accuracy and precision.
Our research reports feature both; quantitative and qualitative aspects for any market. Qualitative information for any market research process are fundamental because they reveal the customer needs and wants, usage and consumption for any product/service related to a specific industry. This in turn aids the marketers/investors in knowing certain perceptions of the customers. Qualitative research can enlighten about the different product concepts and designs along with unique service offering that in turn, helps define marketing problems and generate opportunities. On the other hand, quantitative research engages with the data collection process through interviews, e-mail interactions, surveys and pilot studies. Quantitative aspects for the market research are useful to validate the hypotheses generated during qualitative research method, explore empirical patterns in the data with the help of statistical tools, and finally make the market estimations.
The Brainy Insights offers comprehensive research and analysis, based on a wide assortment of factual insights gained through interviews with CXOs and global experts and secondary data from reliable sources. Our analysts and industry specialist assume vital roles in building up statistical tools and analysis models, which are used to analyse the data and arrive at accurate insights with exceedingly informative research discoveries. The data provided by our organization have proven precious to a diverse range of companies, facilitating them to address issues such as determining which products/services are the most appealing, whether or not customers use the product in the manner anticipated, the purchasing intentions of the market and many others.
Our research methodology encompasses an idyllic combination of primary and secondary initiatives. Key phases involved in this process are listed below:

The phase involves the gathering and collecting of market data and its related information with the help of different sources & research procedures.

The data procurement stage involves in data gathering and collecting through various data sources.
This stage involves in extensive research. These data sources includes:
Purchased Database: Purchased databases play a crucial role in estimating the market sizes irrespective of the domain. Our purchased database includes:
Primary Research: The Brainy Insights interacts with leading companies and experts of the concerned domain to develop the analyst team’s market understanding and expertise. It improves and substantiates every single data presented in the market reports. Primary research mainly involves in telephonic interviews, E-mail interactions and face-to-face interviews with the raw material providers, manufacturers/producers, distributors, & independent consultants. The interviews that we conduct provides valuable data on market size and industry growth trends prevailing in the market. Our organization also conducts surveys with the various industry experts in order to gain overall insights of the industry/market. For instance, in healthcare industry we conduct surveys with the pharmacists, doctors, surgeons and nurses in order to gain insights and key information of a medical product/device/equipment which the customers are going to usage. Surveys are conducted in the form of questionnaire designed by our own analyst team. Surveys plays an important role in primary research because surveys helps us to identify the key target audiences of the market. Additionally, surveys helps to identify the key target audience engaged with the market. Our survey team conducts the survey by targeting the key audience, thus gaining insights from them. Based on the perspectives of the customers, this information is utilized to formulate market strategies. Moreover, market surveys helps us to understand the current competitive situation of the industry. To be precise, our survey process typically involve with the 360 analysis of the market. This analytical process begins by identifying the prospective customers for a product or service related to the market/industry to obtain data on how a product/service could fit into customers’ lives.

Secondary Research: The secondary data sources includes information published by the on-profit organizations such as World bank, WHO, company fillings, investor presentations, annual reports, national government documents, statistical databases, blogs, articles, white papers and others. From the annual report, we analyse a company’s revenue to understand the key segment and market share of that organization in a particular region. We analyse the company websites and adopt the product mapping technique which is important for deriving the segment revenue. In the product mapping method, we select and categorize the products offered by the companies catering to domain specific market, deduce the product revenue for each of the companies so as to get overall estimation of the market size. We also source data and analyses trends based on information received from supply side and demand side intermediaries in the value chain. The supply side denotes the data gathered from supplier, distributor, wholesaler and the demand side illustrates the data gathered from the end customers for respective market domain.

The supply side for a domain specific market is analysed by:
The demand side for the market is estimated through:
In-house Library: Apart from these third-party sources, we have our in-house library of qualitative and quantitative information. Our in-house database includes market data for various industry and domains. These data are updated on regular basis as per the changing market scenario. Our library includes, historic databases, internal audit reports and archives.
Sometimes there are instances where there is no metadata or raw data available for any domain specific market. For those cases, we use our expertise to forecast and estimate the market size in order to generate comprehensive data sets. Our analyst team adopt a robust research technique in order to produce the estimates:
Data Synthesis: This stage involves the analysis & mapping of all the information obtained from the previous step. It also involves in scrutinizing the data for any discrepancy observed while data gathering related to the market. The data is collected with consideration to the heterogeneity of sources. Robust scientific techniques are in place for synthesizing disparate data sets and provide the essential contextual information that can orient market strategies. The Brainy Insights has extensive experience in data synthesis where the data passes through various stages:


Market Deduction & Formulation: The final stage comprises of assigning data points at appropriate market spaces so as to deduce feasible conclusions. Analyst perspective & subject matter expert based holistic form of market sizing coupled with industry analysis also plays a crucial role in this stage.
This stage involves in finalization of the market size and numbers that we have collected from data integration step. With data interpolation, it is made sure that there is no gap in the market data. Successful trend analysis is done by our analysts using extrapolation techniques, which provide the best possible forecasts for the market.
Data Validation & Market Feedback: Validation is the most important step in the process. Validation & re-validation via an intricately designed process helps us finalize data-points to be used for final calculations.

The Brainy Insights interacts with leading companies and experts of the concerned domain to develop the analyst team’s market understanding and expertise. It improves and substantiates every single data presented in the market reports. The data validation interview and discussion panels are typically composed of the most experienced industry members. The participants include, however, are not limited to:
Moreover, we always validate our data and findings through primary respondents from all the major regions we are working on.


Free Customization
Fortune 500 Clients
Free Yearly Update On Purchase Of Multi/Corporate License
Companies Served Till Date