- +1-315-215-1633
- sales@thebrainyinsights.com

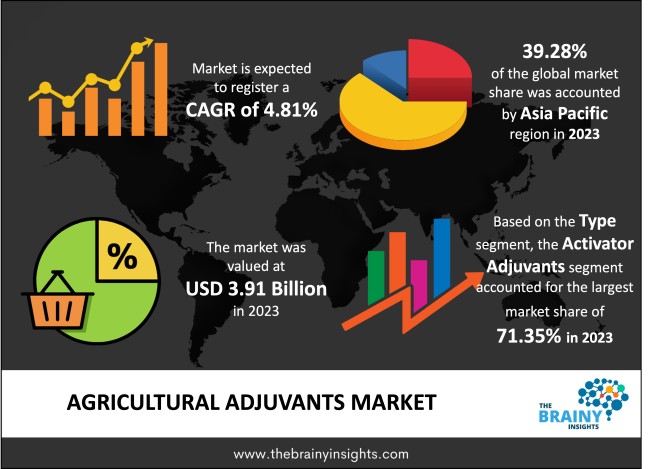
The global Agricultural Adjuvants market generated USD 3.91 Billion revenue in 2023 and is projected to grow at a CAGR of 4.81% from 2024 to 2033. The market is expected to reach USD 6.25 Billion by 2033. The rising population is one of the major factors driving the growth of the agriculture adjuvants market. Furthermore, the increasing necessity of pesticides in farming processes to improve crop production rates and yields is anticipated to boost the growth of the adjuvants industry.
Agricultural adjuvants are a classification of chemicals or substances applied with pesticides, fungicides or herbicides to improve their effectiveness, stability and compatibility with target crops or pests, respectively. These products do not become active ingredients in the formulations of the pesticides; they enhance the application and efficacy of the active ingredients in the pesticide formulations. They can serve many purposes, including enhancing the sticky of pesticides on some surfaces, aiding in the penetration of pesticides past plant cuticle, helping to get the pesticide applied in a more uniform pattern, reducing the loss of pesticide to drift, and increasing the stability of the pesticides. Agricultural adjuvants also have a significant function in contemporary agriculture by enhancing pesticide or herbicide application efficiency and effectiveness. Through them, the farmers become well-endowed in the fight against pests and weeds, increasing crop productivity and standards. Also, adjuvants help sustain agriculture as they reduce the amount of pesticide used for spraying, thus preventing wastage, reducing the amount of chemicals set free in the environment and making sure that the farmer uses the pesticide in the right manner and quantity. In sum, agricultural adjuvants are crucial for farmers, the excuse to secure the effectiveness of the pesticides and herbicides in addition to encouraging responsible use of chemicals in agriculture and providing demand and support for global food security.
Get an overview of this study by requesting a free sample
Growing Agrochemicals Demand and Population - The Census Bureau of the United States estimates that the world population is now at 6.95 billion, and this population has to be fed through better-producing farmland. Therefore, the necessity to improve agricultural productivity drives the demand for agrochemicals such as herbicides, insecticides, and fungicides. Agricultural adjuvants are sometimes added to these chemicals to enhance their efficacy.
Need for Improved Efficiency - Farmers are always looking for better means to boost the performance/efficiency of their operations. This study considers adjuvants as effective solutions that enhance agrochemicals' spreading, sticking, wetting, and dispersing.
Rising trend of Precision Farming - Precision farming gradually involves the employment of UAVs, sensors, and GPS among farmers. That way, there is an improvement in the efficiency of delivering the risk to the target pest while reducing the undesired abundance of chemicals.
Very Strict Climate Regulative Norms - The agriculture industry is constantly subjected to higher regulatory standards regarding the use of chemicals. Regulatory agencies promote adjuvant products through rigorous regulations and procedures for approval, which takes time to grant and increases compliance costs amongst manufacturers.
Resistance Management Challenges - Manipulating pests and pathogens through the application and frequent use of agrochemicals and adjuvants poses a challenge in developing resistance. This resistance eventually lowers the effectiveness of these products, making it compulsory to come up with a new one or approach. To overcome this challenge, adjuvant manufacturers must work extra hard to develop new strategies, products, and approaches to overcoming resistance, which can be costly and time-consuming.
Rising Awareness and Acceptance of Adjuvants (Biological) - Due to complications in applying traditional agrochemicals associated with environmental pollution, there is growing interest in biological adjuvants obtained from microorganisms and plant products. Biological adjuvants, a comparatively fresh agricultural concept that can overcome environmental issues, are another worthy prospect for producers to create novel formulations appealing to environmentally aware farmers.
Business into Emerging Markets - As one of the significant global markets for agricultural adjuvants, future growth can come from emerging markets, specifically LA, APAC, and Africa. These primary factors catalyzed the need to enhance the effectiveness of agrochemicals through the use of adjuvants in regions with increasing agricultural output, mechanization of farming, and dynamic/potentially strict regulations.
Fluctuations in the Raw Materials Prices - The fluctuation in the price of agricultural adjuvants is a major concern in the adjuvants industry. These adjuvants mainly depend on various raw materials, which are unpredictable in nature, which means their prices can vary from time to time. Fluctuations in demand, supply chain issues, and geopolitical pressure are reasons behind this price unpredictability. As a result, the profit margin on the final product may be affected.
Threat of Rapid Entry by Competitors - Since Porter's generic forces of competition exist in the agricultural adjuvants market, many substitutes are available. Other challenges include pricing pressure from generic adjuvants coupled with the possibility of substitute products, leading to reduced prices and, hence, the profits of manufacturers.
The regions analyzed for the market include North America, Europe, South America, Asia Pacific, the Middle East, and Africa. Asia Pacific emerged as the most prominent global Agricultural Adjuvants market, with a 39.28% market revenue share in 2023.
Hence, the Asia Pacific is the motherland of some of the biggest agricultural economies, such as China and India, Indonesia, and some Southeast Asian countries. The region has massive agricultural market leads to the varied use of adjuvants in cropping patterns and high crop yields. However, it is important to note that the population in Asia is ever-rising, and there is increased urbanization and, therefore, the need to produce food. Due to the need to increase yields and productivity, farmers are inclined to apply agrochemicals and adjuvants for the optimal functioning of crop protection products. Moreover, a change in scale in terms of intensive farming methods is being adopted in the Asia Pacific countries for the increased demand for food and agricultural products. Due to the intensive farming system that employs pesticides, herbicides, and fertilizers to enhance the production of food crops, adjuvants to enhance the efficacy of these chemicals have been anticipated in the market. However, numerous governments across the Asia Pacific region give preferential treatment or subsidies to support agricultural modernization and higher farm output. Such measures help farmers spend on the required agrochemical inputs, such as adjuvants, and contribute to market expansion.
Asia Pacific Region Agricultural Adjuvants Market Share in 2023 - 39.28%
www.thebrainyinsights.com
Check the geographical analysis of this market by requesting a free sample
The type segment is divided into activator adjuvants and utility adjuvants. The activator adjuvants segment dominated the market with a share of around 71.35% in 2023. Activator adjuvants are substances that assist in increasing the efficiency of pesticides and the ability to spread across affected areas. They can enhance the physical delivery of pesticides to various target tissues in the plant: control of pests and optimum yields would, therefore, be enhanced. This effectiveness has naturally placed them strategically in the market, dominating it. Furthermore, activator adjuvants are very flexible in their application to work well with different categories of pesticides, such as herbicides, insects, and fungi. These characteristics allow them to interact with various active ingredients and formulations and are essential for farmers and agronomists; they significantly influence the domination of these products in the market. In addition, control of weeds is a vital aspect of crop husbandry, and activator adjuvants facilitate the efficacy of the herbicides. Through increasing weed contact and uptake of herbicides, activator adjuvants enable farmers to gain better control of the weed populations, hence enhancing yields and higher returns on investment.
The application segment is classified into fungicides, herbicides, insecticides and others. The herbicides segment dominated the market with a share of around 47.51% in 2023. Weeds pose significant challenges to crop production since they compete for water, nutrients and light. The major approach to controlling weeds is the use of herbicides, and there are addenda known as adjuvants to make the herbicides more effective in terms of coverage. Lastly, it is used on different crops and cropping systems to suppress weeds effectively without harming other parts of the plant. They can be used before the weeds emerge (pre-emergence), after weeds have emerged (post-emergence), and sometimes, the herbicides may be selectively applied or non-selectively depending on the need of the farmer, making the herbicides a very useful tool in agriculture. However, in recent years, the use of herbicide-tolerant crops- the crops to which certain herbicides are applied without any harm but rather are weeds are affected has risen sharply. Weeds are usually managed in these crops through herbicides, and adjuvants enhance the efficiency of the herbicides in controlling the weeds.
The crop segment includes cereals & grains, fruits & vegetables, oilseeds & pulses, and others. The cereals & grains segment dominated the market with a share of around 48.16% in 2023. Despite being some of the most essential staples in the human food lifecycle, cereals and grains often need a lot of input, such as fertilizers, pesticides and water, to enable producers to get the best yields and qualities. It promotes the effectiveness of pesticide applications, reducing the frequency of reapplications and thus reducing input costs for cereal and grain production, which is important for economic output. Also, cereals and grains are among very vulnerable crops to weed competition, thus resulting in decreased yields and quality if the competition is not controlled. Adjuvants act as additives to the herbicides and are vital in directing or increasing the effectiveness of the herbicide application towards the weeds since they determine its coverage and uptake on the weeds, hence better control of weeds by these crops. Moreover, it is noteworthy that pest threats affecting cereals and grains are numerous and consist of insects, diseases, and weeds. These compounds are mixed with insecticides, fungicides, and herbicides to improve the efficacy of the control measures against pests and diseases and produce improved yields.
| Attribute | Description |
|---|---|
| Market Size | Revenue (USD Billion) |
| Market size value in 2023 | USD 3.91 Billion |
| Market size value in 2033 | USD 6.25 Billion |
| CAGR (2024 to 2033) | 4.81% |
| Historical data | 2020-2022 |
| Base Year | 2023 |
| Forecast | 2024-2033 |
| Region | The regions analyzed for the market are Asia Pacific, Europe, South America, North America, and Middle East & Africa. Furthermore, the regions are further analyzed at the country level. |
| Segments | Type, Application and Crop |
As per The Brainy Insights, the size of the agricultural adjuvants market was valued at USD 3.91 billion in 2023 to USD 6.25 billion by 2033.
The global agricultural adjuvants market is growing at a CAGR of 4.81% during the forecast period 2024-2033.
Asia Pacific became the largest market for agricultural adjuvants.
Growing demand for agrochemicals and adoption of precision farming drive the market's growth.
1. Introduction
1.1. Objectives of the Study
1.2. Market Definition
1.3. Research Scope
1.4. Currency
1.5. Key Target Audience
2. Research Methodology and Assumptions
3. Executive Summary
4. Premium Insights
4.1. Porter’s Five Forces Analysis
4.2. Value Chain Analysis
4.3. Top Investment Pockets
4.3.1. Market Attractiveness Analysis By Type
4.3.2. Market Attractiveness Analysis By Application
4.3.3. Market Attractiveness Analysis By Crop
4.3.4. Market Attractiveness Analysis By Region
4.4. Industry Trends
5. Market Dynamics
5.1. Market Evaluation
5.2. Drivers
5.2.1. Growing Demand for Agrochemicals
5.2.2. Adoption of Precision Farming
5.3. Restraints
5.3.1. Resistance Management Challenges
5.4. Opportunities
5.4.1. Rising Demand for Biological Adjuvants
5.5. Challenges
5.5.1. Price Volatility of Raw Materials
6. Global Agricultural Adjuvants Market Analysis and Forecast, By Type
6.1. Segment Overview
6.2. Activator Adjuvants
6.3. Utility Adjuvants
7. Global Agricultural Adjuvants Market Analysis and Forecast, By Application
7.1. Segment Overview
7.2. Fungicides
7.3. Herbicides
7.4. Insecticides
7.5. Others
8. Global Agricultural Adjuvants Market Analysis and Forecast, By Crop
8.1. Segment Overview
8.2. Cereals & Grains
8.3. Fruits & Vegetables
8.4. Oilseeds & Pulses
8.5. Others
9. Global Agricultural Adjuvants Market Analysis and Forecast, By Regional Analysis
9.1. Segment Overview
9.2. North America
9.2.1. U.S.
9.2.2. Canada
9.2.3. Mexico
9.3. Europe
9.3.1. Germany
9.3.2. France
9.3.3. U.K.
9.3.4. Italy
9.3.5. Spain
9.4. Asia-Pacific
9.4.1. Japan
9.4.2. China
9.4.3. India
9.5. South America
9.5.1. Brazil
9.6. Middle East and Africa
9.6.1. UAE
9.6.2. South Africa
10. Global Agricultural Adjuvants Market-Competitive Landscape
10.1. Overview
10.2. Market Share of Key Players in the Agricultural Adjuvants Market
10.2.1. Global Company Market Share
10.2.2. North America Company Market Share
10.2.3. Europe Company Market Share
10.2.4. APAC Company Market Share
10.3. Competitive Situations and Trends
10.3.1. Product Launches and Developments
10.3.2. Partnerships, Collaborations, and Agreements
10.3.3. Mergers & Acquisitions
10.3.4. Expansions
11. Company Profiles
11.1. BASF SE
11.1.1. Business Overview
11.1.2. Company Snapshot
11.1.3. Company Market Share Analysis
11.1.4. Company Product Portfolio
11.1.5. Recent Developments
11.1.6. SWOT Analysis
11.2. Bayer AG
11.2.1. Business Overview
11.2.2. Company Snapshot
11.2.3. Company Market Share Analysis
11.2.4. Company Product Portfolio
11.2.5. Recent Developments
11.2.6. SWOT Analysis
11.3. Corteva Agriscience
11.3.1. Business Overview
11.3.2. Company Snapshot
11.3.3. Company Market Share Analysis
11.3.4. Company Product Portfolio
11.3.5. Recent Developments
11.3.6. SWOT Analysis
11.4. Croda International PLC
11.4.1. Business Overview
11.4.2. Company Snapshot
11.4.3. Company Market Share Analysis
11.4.4. Company Product Portfolio
11.4.5. Recent Developments
11.4.6. SWOT Analysis
11.5. Clariant AG
11.5.1. Business Overview
11.5.2. Company Snapshot
11.5.3. Company Market Share Analysis
11.5.4. Company Product Portfolio
11.5.5. Recent Developments
11.5.6. SWOT Analysis
11.6. Evonik Industries AG
11.6.1. Business Overview
11.6.2. Company Snapshot
11.6.3. Company Market Share Analysis
11.6.4. Company Product Portfolio
11.6.5. Recent Developments
11.6.6. SWOT Analysis
11.7. FMC Corporation
11.7.1. Business Overview
11.7.2. Company Snapshot
11.7.3. Company Market Share Analysis
11.7.4. Company Product Portfolio
11.7.5. Recent Developments
11.7.6. SWOT Analysis
11.8. Huntsman International LLC
11.8.1. Business Overview
11.8.2. Company Snapshot
11.8.3. Company Market Share Analysis
11.8.4. Company Product Portfolio
11.8.5. Recent Developments
11.8.6. SWOT Analysis
11.9. Helena Chemical Company
11.9.1. Business Overview
11.9.2. Company Snapshot
11.9.3. Company Market Share Analysis
11.9.4. Company Product Portfolio
11.9.5. Recent Developments
11.9.6. SWOT Analysis
11.10. Ingevity
11.10.1. Business Overview
11.10.2. Company Snapshot
11.10.3. Company Market Share Analysis
11.10.4. Company Product Portfolio
11.10.5. Recent Developments
11.10.6. SWOT Analysis
11.11. Lamberti SPA
11.11.1. Business Overview
11.11.2. Company Snapshot
11.11.3. Company Market Share Analysis
11.11.4. Company Product Portfolio
11.11.5. Recent Developments
11.11.6. SWOT Analysis
11.12. Miller Chemical & Fertilizer, LLC.
11.12.1. Business Overview
11.12.2. Company Snapshot
11.12.3. Company Market Share Analysis
11.12.4. Company Product Portfolio
11.12.5. Recent Developments
11.12.6. SWOT Analysis
11.13. Nufarm Limited
11.13.1. Business Overview
11.13.2. Company Snapshot
11.13.3. Company Market Share Analysis
11.13.4. Company Product Portfolio
11.13.5. Recent Developments
11.13.6. SWOT Analysis
11.14. Stepan Company
11.14.1. Business Overview
11.14.2. Company Snapshot
11.14.3. Company Market Share Analysis
11.14.4. Company Product Portfolio
11.14.5. Recent Developments
11.14.6. SWOT Analysis
11.15. Solvay SA
11.15.1. Business Overview
11.15.2. Company Snapshot
11.15.3. Company Market Share Analysis
11.15.4. Company Product Portfolio
11.15.5. Recent Developments
11.15.6. SWOT Analysis
11.16. Syngenta Group
11.16.1. Business Overview
11.16.2. Company Snapshot
11.16.3. Company Market Share Analysis
11.16.4. Company Product Portfolio
11.16.5. Recent Developments
11.16.6. SWOT Analysis
11.17. The Dow Chemical Company
11.17.1. Business Overview
11.17.2. Company Snapshot
11.17.3. Company Market Share Analysis
11.17.4. Company Product Portfolio
11.17.5. Recent Developments
11.17.6. SWOT Analysis
11.18. Winfield United
11.18.1. Business Overview
11.18.2. Company Snapshot
11.18.3. Company Market Share Analysis
11.18.4. Company Product Portfolio
11.18.5. Recent Developments
11.18.6. SWOT Analysis
11.19. Wilbur-Ellis Holdings, Inc.
11.19.1. Business Overview
11.19.2. Company Snapshot
11.19.3. Company Market Share Analysis
11.19.4. Company Product Portfolio
11.19.5. Recent Developments
11.19.6. SWOT Analysis
List of Table
1. Global Agricultural Adjuvants Market, By Type, 2020-2033 (USD Billion) (Tons)
2. Global Activator Adjuvants, Agricultural Adjuvants Market, By Region, 2020-2033 (USD Billion) (Tons)
3. Global Utility Adjuvants, Agricultural Adjuvants Market, By Region, 2020-2033 (USD Billion) (Tons)
4. Global Agricultural Adjuvants Market, By Application, 2020-2033 (USD Billion) (Tons)
5. Global Fungicides, Agricultural Adjuvants Market, By Region, 2020-2033 (USD Billion) (Tons)
6. Global Herbicides, Agricultural Adjuvants Market, By Region, 2020-2033 (USD Billion) (Tons)
7. Global Insecticides, Agricultural Adjuvants Market, By Region, 2020-2033 (USD Billion) (Tons)
8. Global Others, Agricultural Adjuvants Market, By Region, 2020-2033 (USD Billion) (Tons)
9. Global Agricultural Adjuvants Market, By Crop, 2020-2033 (USD Billion) (Tons)
10. Global Cereals & Grains, Agricultural Adjuvants Market, By Region, 2020-2033 (USD Billion) (Tons)
11. Global Fruits & Vegetables, Agricultural Adjuvants Market, By Region, 2020-2033 (USD Billion) (Tons)
12. Global Oilseeds & Pulses, Agricultural Adjuvants Market, By Region, 2020-2033 (USD Billion) (Tons)
13. Global Others, Agricultural Adjuvants Market, By Region, 2020-2033 (USD Billion) (Tons)
14. Global Agricultural Adjuvants Market, By Region, 2020-2033 (USD Billion) (Tons)
15. North America Agricultural Adjuvants Market, By Type, 2020-2033 (USD Billion) (Tons)
16. North America Agricultural Adjuvants Market, By Application, 2020-2033 (USD Billion) (Tons)
17. North America Agricultural Adjuvants Market, By Crop, 2020-2033 (USD Billion) (Tons)
18. U.S. Agricultural Adjuvants Market, By Type, 2020-2033 (USD Billion) (Tons)
19. U.S. Agricultural Adjuvants Market, By Application, 2020-2033 (USD Billion) (Tons)
20. U.S. Agricultural Adjuvants Market, By Crop, 2020-2033 (USD Billion) (Tons)
21. Canada Agricultural Adjuvants Market, By Type, 2020-2033 (USD Billion) (Tons)
22. Canada Agricultural Adjuvants Market, By Application, 2020-2033 (USD Billion) (Tons)
23. Canada Agricultural Adjuvants Market, By Crop, 2020-2033 (USD Billion) (Tons)
24. Mexico Agricultural Adjuvants Market, By Type, 2020-2033 (USD Billion) (Tons)
25. Mexico Agricultural Adjuvants Market, By Application, 2020-2033 (USD Billion) (Tons)
26. Mexico Agricultural Adjuvants Market, By Crop, 2020-2033 (USD Billion) (Tons)
27. Europe Agricultural Adjuvants Market, By Type, 2020-2033 (USD Billion) (Tons)
28. Europe Agricultural Adjuvants Market, By Application, 2020-2033 (USD Billion) (Tons)
29. Europe Agricultural Adjuvants Market, By Crop, 2020-2033 (USD Billion) (Tons)
30. Germany Agricultural Adjuvants Market, By Type, 2020-2033 (USD Billion) (Tons)
31. Germany Agricultural Adjuvants Market, By Application, 2020-2033 (USD Billion) (Tons)
32. Germany Agricultural Adjuvants Market, By Crop, 2020-2033 (USD Billion) (Tons)
33. France Agricultural Adjuvants Market, By Type, 2020-2033 (USD Billion) (Tons)
34. France Agricultural Adjuvants Market, By Application, 2020-2033 (USD Billion) (Tons)
35. France Agricultural Adjuvants Market, By Crop, 2020-2033 (USD Billion) (Tons)
36. U.K. Agricultural Adjuvants Market, By Type, 2020-2033 (USD Billion) (Tons)
37. U.K. Agricultural Adjuvants Market, By Application, 2020-2033 (USD Billion) (Tons)
38. U.K. Agricultural Adjuvants Market, By Crop, 2020-2033 (USD Billion) (Tons)
39. Italy Agricultural Adjuvants Market, By Type, 2020-2033 (USD Billion) (Tons)
40. Italy Agricultural Adjuvants Market, By Application, 2020-2033 (USD Billion) (Tons)
41. Italy Agricultural Adjuvants Market, By Crop, 2020-2033 (USD Billion) (Tons)
42. Spain Agricultural Adjuvants Market, By Type, 2020-2033 (USD Billion) (Tons)
43. Spain Agricultural Adjuvants Market, By Application, 2020-2033 (USD Billion) (Tons)
44. Spain Agricultural Adjuvants Market, By Crop, 2020-2033 (USD Billion) (Tons)
45. Asia Pacific Agricultural Adjuvants Market, By Type, 2020-2033 (USD Billion) (Tons)
46. Asia Pacific Agricultural Adjuvants Market, By Application, 2020-2033 (USD Billion) (Tons)
47. Asia Pacific Agricultural Adjuvants Market, By Crop, 2020-2033 (USD Billion) (Tons)
48. Japan Agricultural Adjuvants Market, By Type, 2020-2033 (USD Billion) (Tons)
49. Japan Agricultural Adjuvants Market, By Application, 2020-2033 (USD Billion) (Tons)
50. Japan Agricultural Adjuvants Market, By Crop, 2020-2033 (USD Billion) (Tons)
51. China Agricultural Adjuvants Market, By Type, 2020-2033 (USD Billion) (Tons)
52. China Agricultural Adjuvants Market, By Application, 2020-2033 (USD Billion) (Tons)
53. China Agricultural Adjuvants Market, By Crop, 2020-2033 (USD Billion) (Tons)
54. India Agricultural Adjuvants Market, By Type, 2020-2033 (USD Billion) (Tons)
55. India Agricultural Adjuvants Market, By Application, 2020-2033 (USD Billion) (Tons)
56. India Agricultural Adjuvants Market, By Crop, 2020-2033 (USD Billion) (Tons)
57. South America Agricultural Adjuvants Market, By Type, 2020-2033 (USD Billion) (Tons)
58. South America Agricultural Adjuvants Market, By Application, 2020-2033 (USD Billion) (Tons)
59. South America Agricultural Adjuvants Market, By Crop, 2020-2033 (USD Billion) (Tons)
60. Brazil Agricultural Adjuvants Market, By Type, 2020-2033 (USD Billion) (Tons)
61. Brazil Agricultural Adjuvants Market, By Application, 2020-2033 (USD Billion) (Tons)
62. Brazil Agricultural Adjuvants Market, By Crop, 2020-2033 (USD Billion) (Tons)
63. Middle East and Africa Agricultural Adjuvants Market, By Type, 2020-2033 (USD Billion) (Tons)
64. Middle East and Africa Agricultural Adjuvants Market, By Application, 2020-2033 (USD Billion) (Tons)
65. Middle East and Africa Agricultural Adjuvants Market, By Crop, 2020-2033 (USD Billion) (Tons)
66. UAE Agricultural Adjuvants Market, By Type, 2020-2033 (USD Billion) (Tons)
67. UAE Agricultural Adjuvants Market, By Application, 2020-2033 (USD Billion) (Tons)
68. UAE Agricultural Adjuvants Market, By Crop, 2020-2033 (USD Billion) (Tons)
69. South Africa Agricultural Adjuvants Market, By Type, 2020-2033 (USD Billion) (Tons)
70. South Africa Agricultural Adjuvants Market, By Application, 2020-2033 (USD Billion) (Tons)
71. South Africa Agricultural Adjuvants Market, By Crop, 2020-2033 (USD Billion) (Tons)
List of Figures
1. Global Agricultural Adjuvants Market Segmentation
2. Agricultural Adjuvants Market: Research Methodology
3. Market Size Estimation Methodology: Bottom-Up Approach
4. Market Size Estimation Methodology: Top-Down Approach
5. Data Triangulation
6. Porter’s Five Forces Analysis
7. Value Chain Analysis
8. Global Agricultural Adjuvants Market Attractiveness Analysis By Type
9. Global Agricultural Adjuvants Market Attractiveness Analysis By Application
10. Global Agricultural Adjuvants Market Attractiveness Analysis By Crop
11. Global Agricultural Adjuvants Market Attractiveness Analysis by Region
12. Global Agricultural Adjuvants Market: Dynamics
13. Global Agricultural Adjuvants Market Share By Type (2024 & 2033)
14. Global Agricultural Adjuvants Market Share By Application (2024 & 2033)
15. Global Agricultural Adjuvants Market Share By Crop (2024 & 2033)
16. Global Agricultural Adjuvants Market Share by Regions (2024 & 2033)
17. Global Agricultural Adjuvants Market Share by Company (2023)
This study forecasts revenue at global, regional, and country levels from 2020 to 2033. The Brainy Insights has segmented the global Agricultural Adjuvants market based on below-mentioned segments:
Global Agricultural Adjuvants Market by Type:
Global Agricultural Adjuvants Market by Application:
Global Agricultural Adjuvants Market by Crop:
Global Agricultural Adjuvants Market by Region:
Research has its special purpose to undertake marketing efficiently. In this competitive scenario, businesses need information across all industry verticals; the information about customer wants, market demand, competition, industry trends, distribution channels etc. This information needs to be updated regularly because businesses operate in a dynamic environment. Our organization, The Brainy Insights incorporates scientific and systematic research procedures in order to get proper market insights and industry analysis for overall business success. The analysis consists of studying the market from a miniscule level wherein we implement statistical tools which helps us in examining the data with accuracy and precision.
Our research reports feature both; quantitative and qualitative aspects for any market. Qualitative information for any market research process are fundamental because they reveal the customer needs and wants, usage and consumption for any product/service related to a specific industry. This in turn aids the marketers/investors in knowing certain perceptions of the customers. Qualitative research can enlighten about the different product concepts and designs along with unique service offering that in turn, helps define marketing problems and generate opportunities. On the other hand, quantitative research engages with the data collection process through interviews, e-mail interactions, surveys and pilot studies. Quantitative aspects for the market research are useful to validate the hypotheses generated during qualitative research method, explore empirical patterns in the data with the help of statistical tools, and finally make the market estimations.
The Brainy Insights offers comprehensive research and analysis, based on a wide assortment of factual insights gained through interviews with CXOs and global experts and secondary data from reliable sources. Our analysts and industry specialist assume vital roles in building up statistical tools and analysis models, which are used to analyse the data and arrive at accurate insights with exceedingly informative research discoveries. The data provided by our organization have proven precious to a diverse range of companies, facilitating them to address issues such as determining which products/services are the most appealing, whether or not customers use the product in the manner anticipated, the purchasing intentions of the market and many others.
Our research methodology encompasses an idyllic combination of primary and secondary initiatives. Key phases involved in this process are listed below:

The phase involves the gathering and collecting of market data and its related information with the help of different sources & research procedures.

The data procurement stage involves in data gathering and collecting through various data sources.
This stage involves in extensive research. These data sources includes:
Purchased Database: Purchased databases play a crucial role in estimating the market sizes irrespective of the domain. Our purchased database includes:
Primary Research: The Brainy Insights interacts with leading companies and experts of the concerned domain to develop the analyst team’s market understanding and expertise. It improves and substantiates every single data presented in the market reports. Primary research mainly involves in telephonic interviews, E-mail interactions and face-to-face interviews with the raw material providers, manufacturers/producers, distributors, & independent consultants. The interviews that we conduct provides valuable data on market size and industry growth trends prevailing in the market. Our organization also conducts surveys with the various industry experts in order to gain overall insights of the industry/market. For instance, in healthcare industry we conduct surveys with the pharmacists, doctors, surgeons and nurses in order to gain insights and key information of a medical product/device/equipment which the customers are going to usage. Surveys are conducted in the form of questionnaire designed by our own analyst team. Surveys plays an important role in primary research because surveys helps us to identify the key target audiences of the market. Additionally, surveys helps to identify the key target audience engaged with the market. Our survey team conducts the survey by targeting the key audience, thus gaining insights from them. Based on the perspectives of the customers, this information is utilized to formulate market strategies. Moreover, market surveys helps us to understand the current competitive situation of the industry. To be precise, our survey process typically involve with the 360 analysis of the market. This analytical process begins by identifying the prospective customers for a product or service related to the market/industry to obtain data on how a product/service could fit into customers’ lives.

Secondary Research: The secondary data sources includes information published by the on-profit organizations such as World bank, WHO, company fillings, investor presentations, annual reports, national government documents, statistical databases, blogs, articles, white papers and others. From the annual report, we analyse a company’s revenue to understand the key segment and market share of that organization in a particular region. We analyse the company websites and adopt the product mapping technique which is important for deriving the segment revenue. In the product mapping method, we select and categorize the products offered by the companies catering to domain specific market, deduce the product revenue for each of the companies so as to get overall estimation of the market size. We also source data and analyses trends based on information received from supply side and demand side intermediaries in the value chain. The supply side denotes the data gathered from supplier, distributor, wholesaler and the demand side illustrates the data gathered from the end customers for respective market domain.

The supply side for a domain specific market is analysed by:
The demand side for the market is estimated through:
In-house Library: Apart from these third-party sources, we have our in-house library of qualitative and quantitative information. Our in-house database includes market data for various industry and domains. These data are updated on regular basis as per the changing market scenario. Our library includes, historic databases, internal audit reports and archives.
Sometimes there are instances where there is no metadata or raw data available for any domain specific market. For those cases, we use our expertise to forecast and estimate the market size in order to generate comprehensive data sets. Our analyst team adopt a robust research technique in order to produce the estimates:
Data Synthesis: This stage involves the analysis & mapping of all the information obtained from the previous step. It also involves in scrutinizing the data for any discrepancy observed while data gathering related to the market. The data is collected with consideration to the heterogeneity of sources. Robust scientific techniques are in place for synthesizing disparate data sets and provide the essential contextual information that can orient market strategies. The Brainy Insights has extensive experience in data synthesis where the data passes through various stages:


Market Deduction & Formulation: The final stage comprises of assigning data points at appropriate market spaces so as to deduce feasible conclusions. Analyst perspective & subject matter expert based holistic form of market sizing coupled with industry analysis also plays a crucial role in this stage.
This stage involves in finalization of the market size and numbers that we have collected from data integration step. With data interpolation, it is made sure that there is no gap in the market data. Successful trend analysis is done by our analysts using extrapolation techniques, which provide the best possible forecasts for the market.
Data Validation & Market Feedback: Validation is the most important step in the process. Validation & re-validation via an intricately designed process helps us finalize data-points to be used for final calculations.

The Brainy Insights interacts with leading companies and experts of the concerned domain to develop the analyst team’s market understanding and expertise. It improves and substantiates every single data presented in the market reports. The data validation interview and discussion panels are typically composed of the most experienced industry members. The participants include, however, are not limited to:
Moreover, we always validate our data and findings through primary respondents from all the major regions we are working on.


Free Customization
Fortune 500 Clients
Free Yearly Update On Purchase Of Multi/Corporate License
Companies Served Till Date