- +1-315-215-1633
- sales@thebrainyinsights.com

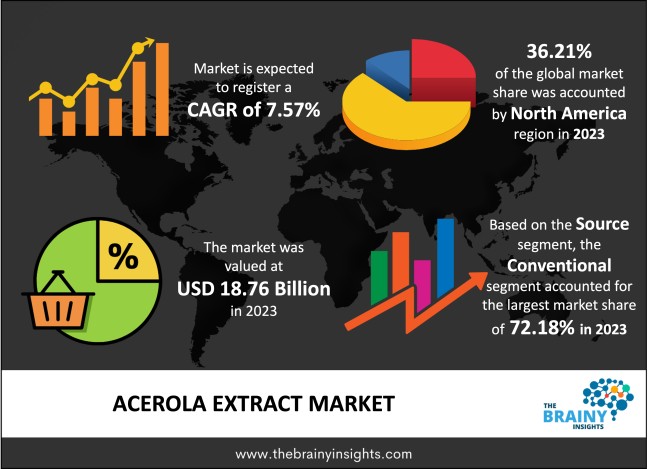
The global acerola extract market was valued at USD 18.76 Billion in 2023 and grew at a CAGR of 7.57% from 2024 to 2033. The market is expected to reach USD 38.91 Billion by 2033. Consumers are demanding organic and clean-label food products due to the health hazards related to synthetic additives.
Acerola is an excellent natural vitamin C source, making it a perfect ingredient for skincare products. Moreover, it contains mineral salt, giving the skin its moisture. The fruit extract from Acerola is higher in vitamin C, which makes it a favourable ingredient in skincare products. The salty form of minerals found in acerola fruit extract restores the depleted mineral content of the skin. Additionally, the salt draws moisture to the skin, which enhances the skin's ability to retain moisture. Acerola cherry is an astringent, much like witch hazel. This could make it beneficial for reducing acne, increasing skin suppleness, and helping with digestion problems. It's been used to treat various conditions, including the common cold, pressure sores, dental decay, retinal haemorrhages, gum infections, hay fever, and collagen diseases. Athletes use Acerola to increase their physical stamina.
Get an overview of this study by requesting a free sample
Increasing use of acerola extract in personal care products: Acerola cherry extract has become the realm of natural skincare and is used in many skincare products. This powerful extract is the first defence against stress and lifeless and dull skin. It is made from the acerola cherry, a tiny fruit renowned for having an enormous amount of Vitamin C. With a vast arsenal of antioxidant skincare chemicals, it swoops in to protect, revitalise, and change the skin's overall appearance. As it inhibits the synthesis of melanin, its anti-inflammatory qualities soothe skin irritations, help lighten dark spots and even out skin tone. Additionally, it fortifies the skin's defences against contaminants and promotes skin hydration.
Side-effects: Acerola's vitamin C may worsen gout by raising uric acid levels. Acerola may raise the risk of kidney stones when taken in high dosages. Kidney stone sufferers should see a physician before eating acerola cherries. Thus, these factors can restrain the market growth of acerola extract.
Increasing growth of the clean-label food industry: The growing consumer aversion to artificial additives has coincided with the rise of the clean-label movement. Freshness is deemed more significant by 1 in 3 worldwide consumers than natural components regarding healthy food and beverages. Customers look for items manufactured with genuine, unadulterated, and well-known substances because they might be unable to distinguish between artificial and unnatural elements. Many people believe clean labelling is a sign of high quality and health. Aside from medical concerns, consumers' interest in clean and healthy food has also caused them to avoid allergens and components linked to intolerances. Acerolas are considered clean-label food as they are incredibly nutrient-dense and provide several health advantages.
The regions analyzed for the market include North America, Europe, South America, Asia Pacific, the Middle East, and Africa. North America emerged as the most significant acerola extract market, with a 36.21% market revenue share in 2023.
North America region will account for the largest market share with revenue growth. In regional countries, the rising demand for acerola extract as an antioxidant in food and beverages, personal care and cosmetics, etc., drives the market's growth. Furthermore, consumers in the region are aware of the health benefits of the acerola extract. The increasing popularity of functional food products has led to the rising need for the preservation of meat products and confectionery products in the U.S. and Canada. Acerola extract acts as a natural preservative and is thus extensively used in food and beverage products.
North America region Acerola Extract Market Share in 2023 - 36.21%
www.thebrainyinsights.com
Check the geographical analysis of this market by requesting a free sample
The source segment is divided into organic and conventional. The conventional segment dominated the market, with a share of around 72.18% in 2023. Using customary farming methods, the fruit of the acerola plant is used to make conventional acerola extract. Acerola's high vitamin C content helps the body produce collagen and repair damaged tissue.
The product segment is divided into liquid and powder. The powder segment dominated the market, with a share of around 66.92% in 2023. The fruit of the acerola cherry, commonly referred to as the Barbados Cherry or West Indian Cherry, is used to make acerola extract powder. It is a well-known alternative for vitamin C supplements and natural antioxidants due to its remarkably high vitamin C concentration. The acerola cherries are dried and processed into a concentrated form to create acerola extract powder.
The application segment is divided into pharmaceuticals and healthcare, food and beverages, animal feed, beauty and personal care and others. The food and beverages segment dominated the market, with a share of around 32.07% in 2023. Acerola has a high concentration of antioxidants. Acerola is a common ingredient in purees, juices, and juice concentrates because of its high vitamin C concentration. It is added to food and drink items to improve nutritional content and satisfy consumers concerned about their health and looking for natural sources of antioxidants and vitamins.
| Attribute | Description |
|---|---|
| Market Size | Revenue (USD Billion) |
| Market size value in 2023 | USD 18.76 Billion |
| Market size value in 2033 | USD 38.91 Billion |
| CAGR (2024 to 2033) | 7.57% |
| Historical data | 2020-2022 |
| Base Year | 2023 |
| Forecast | 2024-2033 |
| Region | The regions analyzed for the market are Asia Pacific, Europe, South America, North America, and Middle East & Africa. Furthermore, the regions are further analyzed at the country level. |
| Segments | Source, Product and Application |
As per The Brainy Insights, the size of the acerola extract market was valued at USD 18.76 Billion in 2023 to USD 38.91 Billion by 2033.
Global acerola extract market is growing at a CAGR of 7.57% during the forecast period 2024-2033.
North America region emerged as the largest market for the acerola extract.
The market's growth will be influenced by the rising application of acerola extract in different applications
The side effects of the product can hamper the market growth.
The increasing growth of personal care industry is providing huge opportunities to the market.
1. Introduction
1.1. Objectives of the Study
1.2. Market Definition
1.3. Research Scope
1.4. Currency
1.5. Key Target Audience
2. Research Methodology and Assumptions
3. Executive Summary
4. Premium Insights
4.1. Porter’s Five Forces Analysis
4.2. Value Chain Analysis
4.3. Top Investment Pockets
4.3.1. Market Attractiveness Analysis by Source
4.3.2. Market Attractiveness Analysis by Product
4.3.3. Market Attractiveness Analysis by Application
4.3.4. Market Attractiveness Analysis by Region
4.4. Industry Trends
5. Market Dynamics
5.1. Market Evaluation
5.2. Drivers
5.2.1. Increasing demand for acerola extract in different applications
5.3. Restraints
5.3.1. Fluctuation cost of raw materials
5.4. Opportunities
5.4.1. Growth of functional food and beverages industry
5.5. Challenges
5.5.1. Government regulations
6. Global Acerola Extract Market Analysis and Forecast, By Source
6.1. Segment Overview
6.2. Conventional
6.3. Organic
7. Global Acerola Extract Market Analysis and Forecast, By Product
7.1. Segment Overview
7.2. Liquid
7.3. Powder
8. Global Acerola Extract Market Analysis and Forecast, By Application
8.1. Segment Overview
8.2. Pharmaceuticals and Healthcare
8.3. Food and Beverages
8.4. Animal Feed
8.5. Beauty and Personal Care
8.6. Others
9. Global Acerola Extract Market Analysis and Forecast, By Regional Analysis
9.1. Segment Overview
9.2. North America
9.2.1. U.S.
9.2.2. Canada
9.2.3. Mexico
9.3. Europe
9.3.1. Germany
9.3.2. France
9.3.3. U.K.
9.3.4. Italy
9.3.5. Spain
9.4. Asia-Pacific
9.4.1. Japan
9.4.2. China
9.4.3. India
9.5. South America
9.5.1. Brazil
9.6. Middle East and Africa
9.6.1. UAE
9.6.2. South Africa
10. Global Acerola Extract Market-Competitive Landscape
10.1. Overview
10.2. Market Share of Key Players in the Acerola Extract Market
10.2.1. Global Company Market Share
10.2.2. North America Company Market Share
10.2.3. Europe Company Market Share
10.2.4. APAC Company Market Share
10.3. Competitive Situations and Trends
10.3.1. Product Launches and Developments
10.3.2. Partnerships, Collaborations, and Agreements
10.3.3. Mergers & Acquisitions
10.3.4. Expansions
11. Company Profiles
11.1. Dohler GmbH
11.1.1. Business Overview
11.1.2. Company Snapshot
11.1.3. Company Market Share Analysis
11.1.4. Company Product Portfolio
11.1.5. Recent Developments
11.1.6. SWOT Analysis
11.2. The Green Labs LLC
11.2.1. Business Overview
11.2.2. Company Snapshot
11.2.3. Company Market Share Analysis
11.2.4. Company Product Portfolio
11.2.5. Recent Developments
11.3. Blue Macaw Flora
11.3.1. Business Overview
11.3.2. Company Snapshot
11.3.3. Company Market Share Analysis
11.3.4. Company Product Portfolio
11.3.5. Recent Developments
11.3.6. SWOT Analysis
11.4. NutriBotanica
11.4.1. Business Overview
11.4.2. Company Snapshot
11.4.3. Company Market Share Analysis
11.4.4. Company Product Portfolio
11.4.5. Recent Developments
11.4.6. SWOT Analysis
11.5. Diana Food S.A.S
11.5.1. Business Overview
11.5.2. Company Snapshot
11.5.3. Company Market Share Analysis
11.5.4. Company Product Portfolio
11.5.5. Recent Developments
11.5.6. SWOT Analysis
11.6. Florida Food Inc.
11.6.1. Business Overview
11.6.2. Company Snapshot
11.6.3. Company Market Share Analysis
11.6.4. Company Product Portfolio
11.6.5. Recent Developments
11.6.6. SWOT Analysis
11.7. Nutrilite
11.7.1. Business Overview
11.7.2. Company Snapshot
11.7.3. Company Market Share Analysis
11.7.4. Company Product Portfolio
11.7.5. Recent Developments
11.7.6. SWOT Analysis
11.8. Niagro
11.8.1. Business Overview
11.8.2. Company Snapshot
11.8.3. Company Market Share Analysis
11.8.4. Company Product Portfolio
11.8.5. Recent Developments
11.8.6. SWOT Analysis
11.9. Naturex
11.9.1. Business Overview
11.9.2. Company Snapshot
11.9.3. Company Market Share Analysis
11.9.4. Company Product Portfolio
11.9.5. Recent Developments
11.9.6. SWOT Analysis
11.10. Nichirei Corporation Inc.
11.10.1. Business Overview
11.10.2. Company Snapshot
11.10.3. Company Market Share Analysis
11.10.4. Company Product Portfolio
11.10.5. Recent Developments
11.10.6. SWOT Analysis
11.11. Kemin Industries, Inc.
11.11.1. Business Overview
11.11.2. Company Snapshot
11.11.3. Company Market Share Analysis
11.11.4. Company Product Portfolio
11.11.5. Recent Developments
11.11.6. SWOT Analysis
11.12. Advanced Biotech
11.12.1. Business Overview
11.12.2. Company Snapshot
11.12.3. Company Market Share Analysis
11.12.4. Company Product Portfolio
11.12.5. Recent Developments
11.12.6. SWOT Analysis
11.13. Bösch Boden Spies
11.13.1. Business Overview
11.13.2. Company Snapshot
11.13.3. Company Market Share Analysis
11.13.4. Company Product Portfolio
11.13.5. Recent Developments
11.13.6. SWOT Analysis
11.14. KINGHERBS
11.14.1. Business Overview
11.14.2. Company Snapshot
11.14.3. Company Market Share Analysis
11.14.4. Company Product Portfolio
11.14.5. Recent Developments
11.14.6. SWOT Analysis
11.15. Foodchem International Corporation
11.15.1. Business Overview
11.15.2. Company Snapshot
11.15.3. Company Market Share Analysis
11.15.4. Company Product Portfolio
11.15.5. Recent Developments
11.15.6. SWOT Analysis
11.16. Vita Forte Inc
11.16.1. Business Overview
11.16.2. Company Snapshot
11.16.3. Company Market Share Analysis
11.16.4. Company Product Portfolio
11.16.5. Recent Developments
11.16.6. SWOT Analysis
List of Table
1. Global Acerola Extract Market, By Source, 2020-2033 (USD Billion)
2. Global Conventional, Acerola Extract Market, By Region, 2020-2033 (USD Billion)
3. Global Organic, Acerola Extract Market, By Region, 2020-2033 (USD Billion)
4. Global Acerola Extract Market, By Product, 2020-2033 (USD Billion)
5. Global Liquid, Acerola Extract Market, By Region, 2020-2033 (USD Billion)
6. Global Powder, Acerola Extract Market, By Region, 2020-2033 (USD Billion)
7. Global Acerola Extract Market, By Application, 2020-2033 (USD Billion)
8. Global Pharmaceuticals and Healthcare, Acerola Extract Market, By Region, 2020-2033 (USD Billion)
9. Global Food and Beverages, Acerola Extract Market, By Region, 2020-2033 (USD Billion)
10. Global Animal Feed, Acerola Extract Market, By Region, 2020-2033 (USD Billion)
11. Global Beauty and Personal Care, Acerola Extract Market, By Region, 2020-2033 (USD Billion)
12. Global Others, Acerola Extract Market, By Region, 2020-2033 (USD Billion)
13. Global Acerola Extract Market, By Region, 2020-2033 (USD Billion)
14. North America Acerola Extract Market, By Source, 2020-2033 (USD Billion)
15. North America Acerola Extract Market, By Product, 2020-2033 (USD Billion)
16. North America Acerola Extract Market, By Application, 2020-2033 (USD Billion)
17. U.S. Acerola Extract Market, By Source, 2020-2033 (USD Billion)
18. U.S. Acerola Extract Market, By Product, 2020-2033 (USD Billion)
19. U.S. Acerola Extract Market, By Application, 2020-2033 (USD Billion)
20. Canada Acerola Extract Market, By Source, 2020-2033 (USD Billion)
21. Canada Acerola Extract Market, By Product, 2020-2033 (USD Billion)
22. Canada Acerola Extract Market, By Application, 2020-2033 (USD Billion)
23. Mexico Acerola Extract Market, By Source, 2020-2033 (USD Billion)
24. Mexico Acerola Extract Market, By Product, 2020-2033 (USD Billion)
25. Mexico Acerola Extract Market, By Application, 2020-2033 (USD Billion)
26. Europe Acerola Extract Market, By Source, 2020-2033 (USD Billion)
27. Europe Acerola Extract Market, By Product, 2020-2033 (USD Billion)
28. Europe Acerola Extract Market, By Application, 2020-2033 (USD Billion)
29. Germany Acerola Extract Market, By Source, 2020-2033 (USD Billion)
30. Germany Acerola Extract Market, By Product, 2020-2033 (USD Billion)
31. Germany Acerola Extract Market, By Application, 2020-2033 (USD Billion)
32. France Acerola Extract Market, By Source, 2020-2033 (USD Billion)
33. France Acerola Extract Market, By Product, 2020-2033 (USD Billion)
34. France Acerola Extract Market, By Application, 2020-2033 (USD Billion)
35. U.K. Acerola Extract Market, By Source, 2020-2033 (USD Billion)
36. U.K. Acerola Extract Market, By Product, 2020-2033 (USD Billion)
37. U.K. Acerola Extract Market, By Application, 2020-2033 (USD Billion)
38. Italy Acerola Extract Market, By Source, 2020-2033 (USD Billion)
39. Italy Acerola Extract Market, By Product, 2020-2033 (USD Billion)
40. Italy Acerola Extract Market, By Application, 2020-2033 (USD Billion)
41. Spain Acerola Extract Market, By Source, 2020-2033 (USD Billion)
42. Spain Acerola Extract Market, By Product, 2020-2033 (USD Billion)
43. Spain Acerola Extract Market, By Application, 2020-2033 (USD Billion)
44. Asia Pacific Acerola Extract Market, By Source, 2020-2033 (USD Billion)
45. Asia Pacific Acerola Extract Market, By Product, 2020-2033 (USD Billion)
46. Asia Pacific Acerola Extract Market, By Application, 2020-2033 (USD Billion)
47. Japan Acerola Extract Market, By Source, 2020-2033 (USD Billion)
48. Japan Acerola Extract Market, By Product, 2020-2033 (USD Billion)
49. Japan Acerola Extract Market, By Application, 2020-2033 (USD Billion)
50. China Acerola Extract Market, By Source, 2020-2033 (USD Billion)
51. China Acerola Extract Market, By Product, 2020-2033 (USD Billion)
52. China Acerola Extract Market, By Application, 2020-2033 (USD Billion)
53. India Acerola Extract Market, By Source, 2020-2033 (USD Billion)
54. India Acerola Extract Market, By Product, 2020-2033 (USD Billion)
55. India Acerola Extract Market, By Application, 2020-2033 (USD Billion)
56. South America Acerola Extract Market, By Source, 2020-2033 (USD Billion)
57. South America Acerola Extract Market, By Product, 2020-2033 (USD Billion)
58. South America Acerola Extract Market, By Application, 2020-2033 (USD Billion)
59. Brazil Acerola Extract Market, By Source, 2020-2033 (USD Billion)
60. Brazil Acerola Extract Market, By Product, 2020-2033 (USD Billion)
61. Brazil Acerola Extract Market, By Application, 2020-2033 (USD Billion)
62. Middle East and Africa Acerola Extract Market, By Source, 2020-2033 (USD Billion)
63. Middle East and Africa Acerola Extract Market, By Product, 2020-2033 (USD Billion)
64. Middle East and Africa Acerola Extract Market, By Application, 2020-2033 (USD Billion)
65. UAE Acerola Extract Market, By Source, 2020-2033 (USD Billion)
66. UAE Acerola Extract Market, By Product, 2020-2033 (USD Billion)
67. UAE Acerola Extract Market, By Application, 2020-2033 (USD Billion)
68. South Africa Acerola Extract Market, By Source, 2020-2033 (USD Billion)
69. South Africa Acerola Extract Market, By Product, 2020-2033 (USD Billion)
70. South Africa Acerola Extract Market, By Application, 2020-2033 (USD Billion)
List of Figures
1. Global Acerola Extract Market Segmentation
2. Acerola Extract Market: Research Methodology
3. Market Size Estimation Methodology: Bottom-Up Approach
4. Market Size Estimation Methodology: Top-Down Approach
5. Data Triangulation
6. Porter’s Five Forces Analysis
7. Value Chain Analysis
8. Global Acerola Extract Market Attractiveness Analysis by Source
9. Global Acerola Extract Market Attractiveness Analysis by Product
10. Global Acerola Extract Market Attractiveness Analysis by Application
11. Global Acerola Extract Market Attractiveness Analysis by Region
12. Global Acerola Extract Market: Dynamics
13. Global Acerola Extract Market Share by Source (2023 & 2033)
14. Global Acerola Extract Market Share by Product (2023 & 2033)
15. Global Acerola Extract Market Share by Application (2023 & 2033)
16. Global Acerola Extract Market Share by Regions (2023 & 2033)
17. Global Acerola Extract Market Share by Company (2023)
This study forecasts revenue at global, regional, and country levels from 2020 to 2033. The Brainy Insights has segmented the global acerola extract market based on below mentioned segments:
Global Acerola Extract Market by Source:
Global Acerola Extract Market by Product:
Global Acerola Extract Market by Application:
Global Acerola Extract Market by Region:
Research has its special purpose to undertake marketing efficiently. In this competitive scenario, businesses need information across all industry verticals; the information about customer wants, market demand, competition, industry trends, distribution channels etc. This information needs to be updated regularly because businesses operate in a dynamic environment. Our organization, The Brainy Insights incorporates scientific and systematic research procedures in order to get proper market insights and industry analysis for overall business success. The analysis consists of studying the market from a miniscule level wherein we implement statistical tools which helps us in examining the data with accuracy and precision.
Our research reports feature both; quantitative and qualitative aspects for any market. Qualitative information for any market research process are fundamental because they reveal the customer needs and wants, usage and consumption for any product/service related to a specific industry. This in turn aids the marketers/investors in knowing certain perceptions of the customers. Qualitative research can enlighten about the different product concepts and designs along with unique service offering that in turn, helps define marketing problems and generate opportunities. On the other hand, quantitative research engages with the data collection process through interviews, e-mail interactions, surveys and pilot studies. Quantitative aspects for the market research are useful to validate the hypotheses generated during qualitative research method, explore empirical patterns in the data with the help of statistical tools, and finally make the market estimations.
The Brainy Insights offers comprehensive research and analysis, based on a wide assortment of factual insights gained through interviews with CXOs and global experts and secondary data from reliable sources. Our analysts and industry specialist assume vital roles in building up statistical tools and analysis models, which are used to analyse the data and arrive at accurate insights with exceedingly informative research discoveries. The data provided by our organization have proven precious to a diverse range of companies, facilitating them to address issues such as determining which products/services are the most appealing, whether or not customers use the product in the manner anticipated, the purchasing intentions of the market and many others.
Our research methodology encompasses an idyllic combination of primary and secondary initiatives. Key phases involved in this process are listed below:

The phase involves the gathering and collecting of market data and its related information with the help of different sources & research procedures.

The data procurement stage involves in data gathering and collecting through various data sources.
This stage involves in extensive research. These data sources includes:
Purchased Database: Purchased databases play a crucial role in estimating the market sizes irrespective of the domain. Our purchased database includes:
Primary Research: The Brainy Insights interacts with leading companies and experts of the concerned domain to develop the analyst team’s market understanding and expertise. It improves and substantiates every single data presented in the market reports. Primary research mainly involves in telephonic interviews, E-mail interactions and face-to-face interviews with the raw material providers, manufacturers/producers, distributors, & independent consultants. The interviews that we conduct provides valuable data on market size and industry growth trends prevailing in the market. Our organization also conducts surveys with the various industry experts in order to gain overall insights of the industry/market. For instance, in healthcare industry we conduct surveys with the pharmacists, doctors, surgeons and nurses in order to gain insights and key information of a medical product/device/equipment which the customers are going to usage. Surveys are conducted in the form of questionnaire designed by our own analyst team. Surveys plays an important role in primary research because surveys helps us to identify the key target audiences of the market. Additionally, surveys helps to identify the key target audience engaged with the market. Our survey team conducts the survey by targeting the key audience, thus gaining insights from them. Based on the perspectives of the customers, this information is utilized to formulate market strategies. Moreover, market surveys helps us to understand the current competitive situation of the industry. To be precise, our survey process typically involve with the 360 analysis of the market. This analytical process begins by identifying the prospective customers for a product or service related to the market/industry to obtain data on how a product/service could fit into customers’ lives.

Secondary Research: The secondary data sources includes information published by the on-profit organizations such as World bank, WHO, company fillings, investor presentations, annual reports, national government documents, statistical databases, blogs, articles, white papers and others. From the annual report, we analyse a company’s revenue to understand the key segment and market share of that organization in a particular region. We analyse the company websites and adopt the product mapping technique which is important for deriving the segment revenue. In the product mapping method, we select and categorize the products offered by the companies catering to domain specific market, deduce the product revenue for each of the companies so as to get overall estimation of the market size. We also source data and analyses trends based on information received from supply side and demand side intermediaries in the value chain. The supply side denotes the data gathered from supplier, distributor, wholesaler and the demand side illustrates the data gathered from the end customers for respective market domain.

The supply side for a domain specific market is analysed by:
The demand side for the market is estimated through:
In-house Library: Apart from these third-party sources, we have our in-house library of qualitative and quantitative information. Our in-house database includes market data for various industry and domains. These data are updated on regular basis as per the changing market scenario. Our library includes, historic databases, internal audit reports and archives.
Sometimes there are instances where there is no metadata or raw data available for any domain specific market. For those cases, we use our expertise to forecast and estimate the market size in order to generate comprehensive data sets. Our analyst team adopt a robust research technique in order to produce the estimates:
Data Synthesis: This stage involves the analysis & mapping of all the information obtained from the previous step. It also involves in scrutinizing the data for any discrepancy observed while data gathering related to the market. The data is collected with consideration to the heterogeneity of sources. Robust scientific techniques are in place for synthesizing disparate data sets and provide the essential contextual information that can orient market strategies. The Brainy Insights has extensive experience in data synthesis where the data passes through various stages:


Market Deduction & Formulation: The final stage comprises of assigning data points at appropriate market spaces so as to deduce feasible conclusions. Analyst perspective & subject matter expert based holistic form of market sizing coupled with industry analysis also plays a crucial role in this stage.
This stage involves in finalization of the market size and numbers that we have collected from data integration step. With data interpolation, it is made sure that there is no gap in the market data. Successful trend analysis is done by our analysts using extrapolation techniques, which provide the best possible forecasts for the market.
Data Validation & Market Feedback: Validation is the most important step in the process. Validation & re-validation via an intricately designed process helps us finalize data-points to be used for final calculations.

The Brainy Insights interacts with leading companies and experts of the concerned domain to develop the analyst team’s market understanding and expertise. It improves and substantiates every single data presented in the market reports. The data validation interview and discussion panels are typically composed of the most experienced industry members. The participants include, however, are not limited to:
Moreover, we always validate our data and findings through primary respondents from all the major regions we are working on.


Free Customization
Fortune 500 Clients
Free Yearly Update On Purchase Of Multi/Corporate License
Companies Served Till Date