- +1-315-215-1633
- sales@thebrainyinsights.com

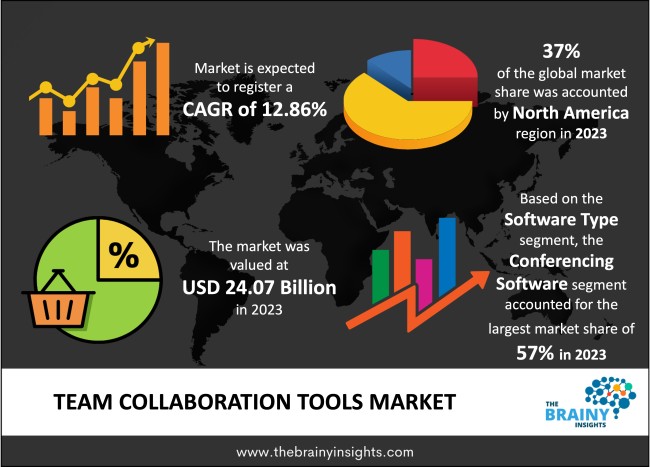
The global team collaboration tools market is expected to reach USD 80.71 billion by 2033, at a CAGR of 12.86% from 2024 to 2033. The increasing demand for smart workplaces to improve employee engagement and overall team efficiency will drive the team collaboration tools market. The pandemic induced lockdowns and social distancing norms established work from home and hybrid work models encouraging the market companies to adopt various team collaboration tools to improve employee work and project efficiency. The technological advancements in artificial intelligence and augmented reality have enabled the integration of team collaboration tools with these virtual spaces. The integration improves the voice, image, and navigation features of the team collaboration tools, thereby proving an impetus to the growth of the global market. In the upcoming years, team collaboration tools will see a huge demand from emerging countries. This is mainly because these developing countries are filled with Small and Medium Enterprises, and these companies always look to increase their productivity, which will increase their profit.
When two or more individuals come together to achieve a singular goal, we term it a team. The individuals in the team perform various tasks alone or together. The tasks performed by these individuals are interdependent and are directed towards achieving a common goal or objective. The action of performing the tasks in a coordinated manner to achieve a common goal is termed collaboration. However, it is not always feasible for the individuals to be present at a physical location together to work towards the goal/objective. A team may be dispersed across geographies or time zones. They might be spread in the same city but cannot meet due to unavoidable circumstances like pandemic-induced lockdowns. Team collaboration tools or software allow individuals to work on a common goal by enabling effective real-time communication and document sharing despite the different locations they are working from. Instant messaging, cloud storage, whiteboards, video conferencing, calendar sharing tools, file sharing tools, and document synchronization are some team collaboration tools available in the market. Team collaboration tools offer a cost-effective way to exchange information, ideas, and dialogue. Team collaboration tools encourage employee participation, efficiency, creativity, innovation, and productivity. It provides flexibility to employees, thereby increasing their work satisfaction. Team collaboration tools reduce operational costs for companies as well as personal expenses for employees. The vast number of benefits offered by team collaboration tools will augment the market's growth during the forecast period. Adopting and integrating AI-driven features will help increase organizations' productivity in the upcoming years. These features will also provide insights that will benefit the company. The adoption of machine learning will help evaluate team performance. Also, adding some features to ease hybrid workers will make it easy for employees to perform well.
Get an overview of this study by requesting a free sample
1. Introduction
1.1. Objectives of the Study
1.2. Market Definition
1.3. Research Scope
1.4. Currency
1.5. Key Target Audience
2. Research Methodology and Assumptions
3. Executive Summary
4. Premium Insights
4.1. Porter’s Five Forces Analysis
4.2. Value Chain Analysis
4.3. Top Investment Pockets
4.3.1. Market Attractiveness Analysis by Software Type
4.3.2. Market Attractiveness Analysis by Deployment Type
4.3.3. Market Attractiveness Analysis by Application
4.3.4. Market Attractiveness Analysis by Region
4.4. Industry Trends
5. Market Dynamics
5.1. Market Evaluation
5.2. Drivers
5.2.1. Growing adoption of team collaboration tools to increase work efficiency
5.3. Restraints
5.3.1. Data privacy and security concerns
5.4. Opportunities
5.4.1. Technological advancements in artificial intelligence and augmented reality
5.5. Challenges
5.5.1. Lack of IT infrastructure
6. Global Team Collaboration Tools Market Analysis and Forecast, By Software Type
6.1. Segment Overview
6.2. Conferencing Software
6.3. Communication & Coordination Software
7. Global Team Collaboration Tools Market Analysis and Forecast, By Deployment Type
7.1. Segment Overview
7.2. Cloud
7.3. On-Premises
8. Global Team Collaboration Tools Market Analysis and Forecast, By Application
8.1. Segment Overview
8.2. Retail & E-Commerce
8.3. Education
8.4. Manufacturing
8.5. IT & Telecom
8.6. Healthcare
8.7. BFSI
8.8. Logistics & Transportation
8.9. Government & Defense
8.10. Media & Entertainment
8.11. Others
9. Global Team Collaboration Tools Market Analysis and Forecast, By Regional Analysis
9.1. Segment Overview
9.2. North America
9.2.1. U.S.
9.2.2. Canada
9.2.3. Mexico
9.3. Europe
9.3.1. Germany
9.3.2. France
9.3.3. U.K.
9.3.4. Italy
9.3.5. Spain
9.4. Asia-Pacific
9.4.1. Japan
9.4.2. China
9.4.3. India
9.5. South America
9.5.1. Brazil
9.6. Middle East and Africa
9.6.1. UAE
9.6.2. South Africa
10. Global Team Collaboration Tools Market-Competitive Landscape
10.1. Overview
10.2. Market Share of Key Players in the Team Collaboration Tools Market
10.2.1. Global Company Market Share
10.2.2. North America Company Market Share
10.2.3. Europe Company Market Share
10.2.4. APAC Company Market Share
10.3. Competitive Situations and Trends
10.3.1. Product Launches and Developments
10.3.2. Partnerships, Collaborations, and Agreements
10.3.3. Mergers & Acquisitions
10.3.4. Expansions
11. Company Profiles
11.1. Adobe
11.1.1. Business Overview
11.1.2. Company Snapshot
11.1.3. Company Market Share Analysis
11.1.4. Company Product Portfolio
11.1.5. Recent Developments
11.1.6. SWOT Analysis
11.2. IBM Corporation
11.2.1. Business Overview
11.2.2. Company Snapshot
11.2.3. Company Market Share Analysis
11.2.4. Company Product Portfolio
11.2.5. Recent Developments
11.2.6. SWOT Analysis
11.3. Zoom Video Communication Inc.
11.3.1. Business Overview
11.3.2. Company Snapshot
11.3.3. Company Market Share Analysis
11.3.4. Company Product Portfolio
11.3.5. Recent Developments
11.3.6. SWOT Analysis
11.4. Microsoft
11.4.1. Business Overview
11.4.2. Company Snapshot
11.4.3. Company Market Share Analysis
11.4.4. Company Product Portfolio
11.4.5. Recent Developments
11.4.6. SWOT Analysis
11.5. Slack Technologies LLC
11.5.1. Business Overview
11.5.2. Company Snapshot
11.5.3. Company Market Share Analysis
11.5.4. Company Product Portfolio
11.5.5. Recent Developments
11.5.6. SWOT Analysis
11.6. Google LLC
11.6.1. Business Overview
11.6.2. Company Snapshot
11.6.3. Company Market Share Analysis
11.6.4. Company Product Portfolio
11.6.5. Recent Developments
11.6.6. SWOT Analysis
11.7. Asana Inc.
11.7.1. Business Overview
11.7.2. Company Snapshot
11.7.3. Company Market Share Analysis
11.7.4. Company Product Portfolio
11.7.5. Recent Developments
11.7.6. SWOT Analysis
11.8. Cisco Systems Inc.
11.8.1. Business Overview
11.8.2. Company Snapshot
11.8.3. Company Market Share Analysis
11.8.4. Company Product Portfolio
11.8.5. Recent Developments
11.8.6. SWOT Analysis
11.9. Citrix Systems Inc.
11.9.1. Business Overview
11.9.2. Company Snapshot
11.9.3. Company Market Share Analysis
11.9.4. Company Product Portfolio
11.9.5. Recent Developments
11.9.6. SWOT Analysis
11.10. Oracle Corporation
11.10.1. Business Overview
11.10.2. Company Snapshot
11.10.3. Company Market Share Analysis
11.10.4. Company Product Portfolio
11.10.5. Recent Developments
11.10.6. SWOT Analysis
List of Table
1. Global Team Collaboration Tools Market, By Software Type, 2020-2033 (USD Billion)
2. Global Conferencing Software Team Collaboration Tools Market, By Region, 2020-2033 (USD Billion)
3. Global Communication & Coordination Software Team Collaboration Tools Market, By Region, 2020-2033 (USD Billion)
4. Global Team Collaboration Tools Market, By Deployment Type, 2020-2033 (USD Billion)
5. Global Cloud Team Collaboration Tools Market, By Region, 2020-2033 (USD Billion)
6. Global On-Premises Team Collaboration Tools Market, By Region, 2020-2033 (USD Billion)
7. Global Team Collaboration Tools Market, By Application, 2020-2033 (USD Billion)
8. Global Retail & E-Commerce Team Collaboration Tools Market, By Region, 2020-2033 (USD Billion)
9. Global Education Team Collaboration Tools Market, By Region, 2020-2033 (USD Billion)
10. Global Manufacturing Team Collaboration Tools Market, By Region, 2020-2033 (USD Billion)
11. Global IT & Telecom Team Collaboration Tools Market, By Region, 2020-2033 (USD Billion)
12. Global Healthcare Team Collaboration Tools Market, By Region, 2020-2033 (USD Billion)
13. Global BFSI Team Collaboration Tools Market, By Region, 2020-2033 (USD Billion)
14. Global Logistics & Transportation Team Collaboration Tools Market, By Region, 2020-2033 (USD Billion)
15. Global Government & Defense Team Collaboration Tools Market, By Region, 2020-2033 (USD Billion)
16. Global Media & Entertainment Team Collaboration Tools Market, By Region, 2020-2033 (USD Billion)
17. Global Others Team Collaboration Tools Market, By Region, 2020-2033 (USD Billion)
18. Global Team Collaboration Tools Market, By Region, 2020-2033 (USD Billion)
19. North America Team Collaboration Tools Market, By Software Type, 2020-2033 (USD Billion)
20. North America Team Collaboration Tools Market, By Deployment Type, 2020-2033 (USD Billion)
21. North America Team Collaboration Tools Market, By Application, 2020-2033 (USD Billion)
22. U.S. Team Collaboration Tools Market, By Software Type, 2020-2033 (USD Billion)
23. U.S. Team Collaboration Tools Market, By Deployment Type, 2020-2033 (USD Billion)
24. U.S. Team Collaboration Tools Market, By Application, 2020-2033 (USD Billion)
25. Canada Team Collaboration Tools Market, By Software Type, 2020-2033 (USD Billion)
26. Canada Team Collaboration Tools Market, By Deployment Type, 2020-2033 (USD Billion)
27. Canada Team Collaboration Tools Market, By Application, 2020-2033 (USD Billion)
28. Mexico Team Collaboration Tools Market, By Software Type, 2020-2033 (USD Billion)
29. Mexico Team Collaboration Tools Market, By Deployment Type, 2020-2033 (USD Billion)
30. Mexico Team Collaboration Tools Market, By Application, 2020-2033 (USD Billion)
31. Europe Team Collaboration Tools Market, By Software Type, 2020-2033 (USD Billion)
32. Europe Team Collaboration Tools Market, By Deployment Type, 2020-2033 (USD Billion)
33. Europe Team Collaboration Tools Market, By Application, 2020-2033 (USD Billion)
34. Germany Team Collaboration Tools Market, By Software Type, 2020-2033 (USD Billion)
35. Germany Team Collaboration Tools Market, By Deployment Type, 2020-2033 (USD Billion)
36. Germany Team Collaboration Tools Market, By Application, 2020-2033 (USD Billion)
37. France Team Collaboration Tools Market, By Software Type, 2020-2033 (USD Billion)
38. France Team Collaboration Tools Market, By Deployment Type, 2020-2033 (USD Billion)
39. France Team Collaboration Tools Market, By Application, 2020-2033 (USD Billion)
40. U.K. Team Collaboration Tools Market, By Software Type, 2020-2033 (USD Billion)
41. U.K. Team Collaboration Tools Market, By Deployment Type, 2020-2033 (USD Billion)
42. U.K. Team Collaboration Tools Market, By Application, 2020-2033 (USD Billion)
43. Italy Team Collaboration Tools Market, By Software Type, 2020-2033 (USD Billion)
44. Italy Team Collaboration Tools Market, By Deployment Type, 2020-2033 (USD Billion)
45. Italy Team Collaboration Tools Market, By Application, 2020-2033 (USD Billion)
46. Spain Team Collaboration Tools Market, By Software Type, 2020-2033 (USD Billion)
47. Spain Team Collaboration Tools Market, By Deployment Type, 2020-2033 (USD Billion)
48. Spain Team Collaboration Tools Market, By Application, 2020-2033 (USD Billion)
49. Asia Pacific Team Collaboration Tools Market, By Software Type, 2020-2033 (USD Billion)
50. Asia Pacific Team Collaboration Tools Market, By Deployment Type, 2020-2033 (USD Billion)
51. Asia Pacific Team Collaboration Tools Market, By Application, 2020-2033 (USD Billion)
52. Japan Team Collaboration Tools Market, By Software Type, 2020-2033 (USD Billion)
53. Japan Team Collaboration Tools Market, By Deployment Type, 2020-2033 (USD Billion)
54. Japan Team Collaboration Tools Market, By Application, 2020-2033 (USD Billion)
55. China Team Collaboration Tools Market, By Software Type, 2020-2033 (USD Billion)
56. China Team Collaboration Tools Market, By Deployment Type, 2020-2033 (USD Billion)
57. China Team Collaboration Tools Market, By Application, 2020-2033 (USD Billion)
58. India Team Collaboration Tools Market, By Software Type, 2020-2033 (USD Billion)
59. India Team Collaboration Tools Market, By Deployment Type, 2020-2033 (USD Billion)
60. India Team Collaboration Tools Market, By Application, 2020-2033 (USD Billion)
61. South America Team Collaboration Tools Market, By Software Type, 2020-2033 (USD Billion)
62. South America Team Collaboration Tools Market, By Deployment Type, 2020-2033 (USD Billion)
63. South America Team Collaboration Tools Market, By Application, 2020-2033 (USD Billion)
64. Brazil Team Collaboration Tools Market, By Software Type, 2020-2033 (USD Billion)
65. Brazil Team Collaboration Tools Market, By Deployment Type, 2020-2033 (USD Billion)
66. Brazil Team Collaboration Tools Market, By Application, 2020-2033 (USD Billion)
67. Middle East and Africa Team Collaboration Tools Market, By Software Type, 2020-2033 (USD Billion)
68. Middle East and Africa Team Collaboration Tools Market, By Deployment Type, 2020-2033 (USD Billion)
69. Middle East and Africa Team Collaboration Tools Market, By Application, 2020-2033 (USD Billion)
70. UAE Team Collaboration Tools Market, By Software Type, 2020-2033 (USD Billion)
71. UAE Team Collaboration Tools Market, By Deployment Type, 2020-2033 (USD Billion)
72. UAE Team Collaboration Tools Market, By Application, 2020-2033 (USD Billion)
73. South Africa Team Collaboration Tools Market, By Software Type, 2020-2033 (USD Billion)
74. South Africa Team Collaboration Tools Market, By Deployment Type, 2020-2033 (USD Billion)
75. South Africa Team Collaboration Tools Market, By Application, 2020-2033 (USD Billion)
List of Figures
1. Global Team Collaboration Tools Market Segmentation
2. Team Collaboration Tools Market: Research Methodology
3. Market Size Estimation Methodology: Bottom-Up Approach
4. Market Size Estimation Methodology: Top-Down Approach
5. Data Triangulation
6. Porter’s Five Forces Analysis
7. Value Chain Analysis
8. Global Team Collaboration Tools Market Attractiveness Analysis by Software Type
9. Global Team Collaboration Tools Market Attractiveness Analysis by Deployment Type
10. Global Team Collaboration Tools Market Attractiveness Analysis by Application
11. Global Team Collaboration Tools Market Attractiveness Analysis by Region
12. Global Team Collaboration Tools Market: Dynamics
13. Global Team Collaboration Tools Market Share by Software Type (2023 & 2033)
14. Global Team Collaboration Tools Market Share by Deployment Type (2023 & 2033)
15. Global Team Collaboration Tools Market Share by Application (2023 & 2033)
16. Global Team Collaboration Tools Market Share by Regions (2023 & 2033)
17. Global Team Collaboration Tools Market Share by Company (2023)
This study forecasts revenue at global, regional, and country levels from 2019 to 2030. The Brainy Insights has segmented the global team collaboration tools market based on below mentioned segments:
Global Team Collaboration Tools Market by Software Type:
Global Team Collaboration Tools Market by Deployment Type:
Global Team Collaboration Tools Market by Application:
Global Team Collaboration Tools Market by Region:
Research has its special purpose to undertake marketing efficiently. In this competitive scenario, businesses need information across all industry verticals; the information about customer wants, market demand, competition, industry trends, distribution channels etc. This information needs to be updated regularly because businesses operate in a dynamic environment. Our organization, The Brainy Insights incorporates scientific and systematic research procedures in order to get proper market insights and industry analysis for overall business success. The analysis consists of studying the market from a miniscule level wherein we implement statistical tools which helps us in examining the data with accuracy and precision.
Our research reports feature both; quantitative and qualitative aspects for any market. Qualitative information for any market research process are fundamental because they reveal the customer needs and wants, usage and consumption for any product/service related to a specific industry. This in turn aids the marketers/investors in knowing certain perceptions of the customers. Qualitative research can enlighten about the different product concepts and designs along with unique service offering that in turn, helps define marketing problems and generate opportunities. On the other hand, quantitative research engages with the data collection process through interviews, e-mail interactions, surveys and pilot studies. Quantitative aspects for the market research are useful to validate the hypotheses generated during qualitative research method, explore empirical patterns in the data with the help of statistical tools, and finally make the market estimations.
The Brainy Insights offers comprehensive research and analysis, based on a wide assortment of factual insights gained through interviews with CXOs and global experts and secondary data from reliable sources. Our analysts and industry specialist assume vital roles in building up statistical tools and analysis models, which are used to analyse the data and arrive at accurate insights with exceedingly informative research discoveries. The data provided by our organization have proven precious to a diverse range of companies, facilitating them to address issues such as determining which products/services are the most appealing, whether or not customers use the product in the manner anticipated, the purchasing intentions of the market and many others.
Our research methodology encompasses an idyllic combination of primary and secondary initiatives. Key phases involved in this process are listed below:

The phase involves the gathering and collecting of market data and its related information with the help of different sources & research procedures.

The data procurement stage involves in data gathering and collecting through various data sources.
This stage involves in extensive research. These data sources includes:
Purchased Database: Purchased databases play a crucial role in estimating the market sizes irrespective of the domain. Our purchased database includes:
Primary Research: The Brainy Insights interacts with leading companies and experts of the concerned domain to develop the analyst team’s market understanding and expertise. It improves and substantiates every single data presented in the market reports. Primary research mainly involves in telephonic interviews, E-mail interactions and face-to-face interviews with the raw material providers, manufacturers/producers, distributors, & independent consultants. The interviews that we conduct provides valuable data on market size and industry growth trends prevailing in the market. Our organization also conducts surveys with the various industry experts in order to gain overall insights of the industry/market. For instance, in healthcare industry we conduct surveys with the pharmacists, doctors, surgeons and nurses in order to gain insights and key information of a medical product/device/equipment which the customers are going to usage. Surveys are conducted in the form of questionnaire designed by our own analyst team. Surveys plays an important role in primary research because surveys helps us to identify the key target audiences of the market. Additionally, surveys helps to identify the key target audience engaged with the market. Our survey team conducts the survey by targeting the key audience, thus gaining insights from them. Based on the perspectives of the customers, this information is utilized to formulate market strategies. Moreover, market surveys helps us to understand the current competitive situation of the industry. To be precise, our survey process typically involve with the 360 analysis of the market. This analytical process begins by identifying the prospective customers for a product or service related to the market/industry to obtain data on how a product/service could fit into customers’ lives.

Secondary Research: The secondary data sources includes information published by the on-profit organizations such as World bank, WHO, company fillings, investor presentations, annual reports, national government documents, statistical databases, blogs, articles, white papers and others. From the annual report, we analyse a company’s revenue to understand the key segment and market share of that organization in a particular region. We analyse the company websites and adopt the product mapping technique which is important for deriving the segment revenue. In the product mapping method, we select and categorize the products offered by the companies catering to domain specific market, deduce the product revenue for each of the companies so as to get overall estimation of the market size. We also source data and analyses trends based on information received from supply side and demand side intermediaries in the value chain. The supply side denotes the data gathered from supplier, distributor, wholesaler and the demand side illustrates the data gathered from the end customers for respective market domain.

The supply side for a domain specific market is analysed by:
The demand side for the market is estimated through:
In-house Library: Apart from these third-party sources, we have our in-house library of qualitative and quantitative information. Our in-house database includes market data for various industry and domains. These data are updated on regular basis as per the changing market scenario. Our library includes, historic databases, internal audit reports and archives.
Sometimes there are instances where there is no metadata or raw data available for any domain specific market. For those cases, we use our expertise to forecast and estimate the market size in order to generate comprehensive data sets. Our analyst team adopt a robust research technique in order to produce the estimates:
Data Synthesis: This stage involves the analysis & mapping of all the information obtained from the previous step. It also involves in scrutinizing the data for any discrepancy observed while data gathering related to the market. The data is collected with consideration to the heterogeneity of sources. Robust scientific techniques are in place for synthesizing disparate data sets and provide the essential contextual information that can orient market strategies. The Brainy Insights has extensive experience in data synthesis where the data passes through various stages:


Market Deduction & Formulation: The final stage comprises of assigning data points at appropriate market spaces so as to deduce feasible conclusions. Analyst perspective & subject matter expert based holistic form of market sizing coupled with industry analysis also plays a crucial role in this stage.
This stage involves in finalization of the market size and numbers that we have collected from data integration step. With data interpolation, it is made sure that there is no gap in the market data. Successful trend analysis is done by our analysts using extrapolation techniques, which provide the best possible forecasts for the market.
Data Validation & Market Feedback: Validation is the most important step in the process. Validation & re-validation via an intricately designed process helps us finalize data-points to be used for final calculations.

The Brainy Insights interacts with leading companies and experts of the concerned domain to develop the analyst team’s market understanding and expertise. It improves and substantiates every single data presented in the market reports. The data validation interview and discussion panels are typically composed of the most experienced industry members. The participants include, however, are not limited to:
Moreover, we always validate our data and findings through primary respondents from all the major regions we are working on.
Free Customization
Fortune 500 Clients
Free Yearly Update On Purchase Of Multi/Corporate License
Companies Served Till Date