- +1-315-215-1633
- sales@thebrainyinsights.com

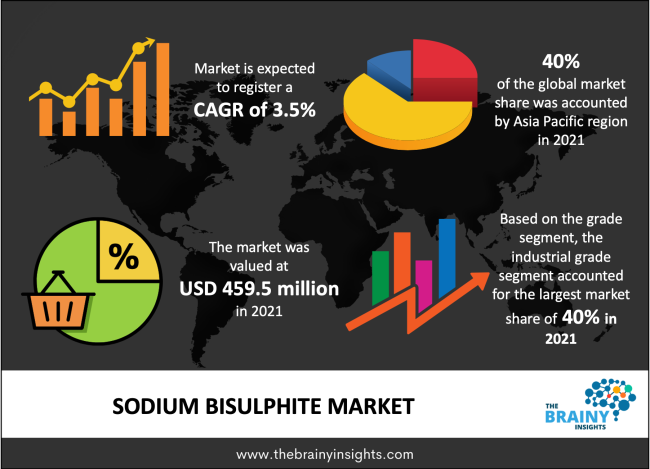
The sodium bisulphite market was estimated at around USD 459.5 million in 2021, growing at a CAGR of nearly 3.5% during 2022-2030. The market is projected to reach approximately USD 628 million by 2030.
A white, crystalline inorganic salt with the chemical formula NaHSO3 is sodium bisulfite, often known as sodium hydrogen sulfite. Sulfur dioxide is bubbled with sodium carbonate (Na2CO3) to create it. Uses for sodium bisulfite include reducing, anti-scaling, flame-retardant, and bleaching agents. Food preservation, corrosion prevention, the picture developing process, the production of wine, metal finishing, DNA sequencing, and wastewater treatment are all areas where sodium bisulfite is used. In order to reduce the amount of chlorine in drinking water, sodium bisulfite is primarily employed as a water treatment agent. It is also applied externally to treat parasitic skin conditions and as a gastrointestinal antiseptic. Major market participants are expanding their operations and offering water treatment due to the demand for safe water around the world. There will be more chances in the global sodium bisulphite market as a result of the demand for clean drinking water.
Get an overview of this study by requesting a free sample
The COVID-19 pandemic has now had an effect on the majority of worldwide businesses. Lockdowns that were issued in the majority of wealthy countries have impacted the supply networks of enterprises. Production of sodium bisulphite has been hindered by the erratic raw material supply and the rise in its off-premises sales. Additionally, as UV technologies and RO filters are employed more frequently, the need for sodium bisulphite from wastewater and sewage treatment plants declines. The demand for sodium bisulphite was most negatively impacted by Asia's slower economic growth, while the demand was most negatively impacted by project delays and cancellations.
1. Introduction
1.1. Objectives of the Study
1.2. Market Definition
1.3. Research Scope
2. Research Methodology and Assumptions
3. Executive Summary
4. Premium Insights
4.1. Porter’s Five Forces Analysis
4.2. Value Chain Analysis
4.3. Top Investment Pockets
4.3.1. Market Attractiveness Analysis By Grade
4.3.2. Market Attractiveness Analysis By Application
4.4. Industry Trends
5. Market Dynamics
5.1. Market Evaluation
5.2. Drivers
5.2.1. Increasing pulp and paper industry to accelerate the market’s growth
5.2.2. Expanding applications for treating wastewater
5.3. Restrains
5.3.1. Harmful impacts would hamper the market
5.4. Opportunities
5.4.1. Growing demand for packaged foods
6. Global Sodium Bisulphite Market Analysis and Forecast, By Grade
6.1. Segment Overview
6.2. Food Grade
6.3. Technical Grade
6.4. Industrial Grade
6.5. Others
7. Global Sodium Bisulphite Market Analysis and Forecast, By Application
7.1. Segment Overview
7.2. Food Additive
7.3. Bleaching Agent
7.4. Water Treatment
7.5. Antichlor
7.6. Reducing Agent
7.7. Others
8. Global Sodium Bisulphite Market Analysis and Forecast, By Regional Analysis
8.1. Segment Overview
8.2. North America
8.2.1. U.S.
8.2.2. Canada
8.2.3. Mexico
8.3. Europe
8.3.1. Germany
8.3.2. France
8.3.3. U.K.
8.3.4. Italy
8.3.5. Spain
8.3.6. Rest of Europe
8.4. Asia-Pacific
8.4.1. Japan
8.4.2. China
8.4.3. India
8.4.4. Australia
8.4.5. South Korea
8.4.6. Rest of Asia-Pacific
8.5. South America
8.5.1. Brazil
8.5.2. Argentina
8.5.3. Rest of South America
8.6. Middle East and Africa
8.6.1. UAE
8.6.2. South Africa
8.6.3. Egypt
8.6.4. Kuwait
8.6.5. Saudi Arabia
8.6.6. Rest of Middle East & Africa
9. Global Sodium Bisulphite Market-Competitive Landscape
9.1. Overview
9.2. Market Share of Key Players in the Sodium Bisulphite market
9.2.1. Global Company Market Share
9.2.2. North America Company Market Share
9.2.3. Europe Company Market Share
9.2.4. APAC Company Market Share
9.3. Competitive Situations and Trends
9.3.1. Grade Launches and Developments
9.3.2. Partnerships, Collaborations, and Agreements
9.3.3. Mergers & Acquisitions
9.3.4. Expansions
10. Company Profiles
10.1. Calabrian Corp., Port Neches, Tex.
10.1.1. Business Overview
10.1.2. Company Snapshot
10.1.3. Company Market Share Analysis
10.1.4. Company Application Portfolio
10.1.5. Recent Developments
10.1.6. SWOT Analysis
10.2. Aditya Birla Chemicals
10.2.1. Business Overview
10.2.2. Company Snapshot
10.2.3. Company Market Share Analysis
10.2.4. Company Application Portfolio
10.2.5. Recent Developments
10.2.6. SWOT Analysis
10.3. Solvay Minerals Inc
10.3.1. Business Overview
10.3.2. Company Snapshot
10.3.3. Company Market Share Analysis
10.3.4. Company Application Portfolio
10.3.5. Recent Developments
10.3.6. SWOT Analysis
10.4. Olympic Chemical Limited
10.4.1. Business Overview
10.4.2. Company Snapshot
10.4.3. Company Market Share Analysis
10.4.4. Company Application Portfolio
10.4.5. Recent Developments
10.4.6. SWOT Analysis
10.5. Southern Ionics
10.5.1. Business Overview
10.5.2. Company Snapshot
10.5.3. Company Market Share Analysis
10.5.4. Company Application Portfolio
10.5.5. Recent Developments
10.5.6. SWOT Analysis
10.6. General Chemicals
10.6.1. Business Overview
10.6.2. Company Snapshot
10.6.3. Company Market Share Analysis
10.6.4. Company Application Portfolio
10.6.5. Recent Developments
10.6.6. SWOT Analysis
10.7. Adisseo France S.A.S.
10.7.1. Business Overview
10.7.2. Company Snapshot
10.7.3. Company Market Share Analysis
10.7.4. Company Application Portfolio
10.7.5. Recent Developments
10.7.6. SWOT Analysis
10.8. Evonik
10.8.1. Business Overview
10.8.2. Company Snapshot
10.8.3. Company Market Share Analysis
10.8.4. Company Application Portfolio
10.8.5. Recent Developments
10.8.6. SWOT Analysis
10.9. Arkema
10.9.1. Business Overview
10.9.2. Company Snapshot
10.9.3. Company Market Share Analysis
10.9.4. Company Application Portfolio
10.9.5. Recent Developments
10.9.6. SWOT Analysis
10.10. Sulquisa
10.10.1. Business Overview
10.10.2. Company Snapshot
10.10.3. Company Market Share Analysis
10.10.4. Company Application Portfolio
10.10.5. Recent Developments
10.10.6. SWOT Analysis
List of Table
1. Global Sodium Bisulphite Market, By Grade, 2022-2030(USD Million)
2. Global Food Grade Sodium Bisulphite Market, By Region, 2022-2030(USD Million)
3. Global Technical Grade Sodium Bisulphite Market, By Region, 2022-2030(USD Million)
4. Global Industrial Grade Sodium Bisulphite Market, By Region, 2022-2030(USD Million)
5. Global Others Sodium Bisulphite Market, By Region, 2022-2030(USD Million)
6. Global Sodium Bisulphite Market, By Application, 2022-2030(USD Million)
7. Global Food Additive Sodium Bisulphite Market, By Region, 2022-2030(USD Million)
8. Global Bleaching Agent Sodium Bisulphite Market, By Region, 2022-2030(USD Million)
9. Global Water Treatment Sodium Bisulphite Market, By Region, 2022-2030(USD Million)
10. Global Antichlor Sodium Bisulphite Market, By Region, 2022-2030(USD Million)
11. Global Reducing Agent Sodium Bisulphite Market, By Region, 2022-2030(USD Million)
12. Global Others Sodium Bisulphite Market, By Region, 2022-2030(USD Million)
13. Global Sodium Bisulphite Market, By Region, 2022-2030(USD Million)
14. Global Sodium Bisulphite Market, By North America, 2022-2030(USD Million)
15. North America Sodium Bisulphite Market, By Grade, 2022-2030(USD Million)
16. North America Sodium Bisulphite Market, By Application, 2022-2030(USD Million)
17. U.S. Sodium Bisulphite Market, By Grade, 2022-2030(USD Million)
18. U.S. Sodium Bisulphite Market, By Application, 2022-2030(USD Million)
19. Canada Sodium Bisulphite Market, By Grade, 2022-2030(USD Million)
20. Canada Sodium Bisulphite Market, By Application, 2022-2030(USD Million)
21. Mexico Sodium Bisulphite Market, By Grade, 2022-2030(USD Million)
22. Mexico Sodium Bisulphite Market, By Application, 2022-2030(USD Million)
23. Europe Sodium Bisulphite Market, By Grade, 2022-2030(USD Million)
24. Europe Sodium Bisulphite Market, By Application, 2022-2030(USD Million)
25. Germany Sodium Bisulphite Market, By Grade, 2022-2030(USD Million)
26. Germany Sodium Bisulphite Market, By Application, 2022-2030(USD Million)
27. France Sodium Bisulphite Market, By Grade, 2022-2030(USD Million)
28. France Sodium Bisulphite Market, By Application, 2022-2030(USD Million)
29. U.K. Sodium Bisulphite Market, By Grade, 2022-2030(USD Million)
30. U.K. Sodium Bisulphite Market, By Application, 2022-2030(USD Million)
31. Italy Sodium Bisulphite Market, By Grade, 2022-2030(USD Million)
32. Italy Sodium Bisulphite Market, By Application, 2022-2030(USD Million)
33. Spain Sodium Bisulphite Market, By Grade, 2022-2030(USD Million)
34. Spain Sodium Bisulphite Market, By Application, 2022-2030(USD Million)
35. Rest of Europe Sodium Bisulphite Market, By Grade, 2022-2030(USD Million)
36. Rest of Europe Sodium Bisulphite Market, By Application, 2022-2030(USD Million)
37. Asia Pacific Sodium Bisulphite Market, By Grade, 2022-2030(USD Million)
38. Asia Pacific Sodium Bisulphite Market, By Application, 2022-2030(USD Million)
39. Japan Sodium Bisulphite Market, By Grade, 2022-2030(USD Million)
40. Japan Sodium Bisulphite Market, By Application, 2022-2030(USD Million)
41. China Sodium Bisulphite Market, By Grade, 2022-2030(USD Million)
42. China Sodium Bisulphite Market, By Application, 2022-2030(USD Million)
43. India Sodium Bisulphite Market, By Grade, 2022-2030(USD Million)
44. India Sodium Bisulphite Market, By Application, 2022-2030(USD Million)
45. Australia Sodium Bisulphite Market, By Grade, 2022-2030(USD Million)
46. Australia Sodium Bisulphite Market, By Application, 2022-2030(USD Million)
47. South Korea Sodium Bisulphite Market, By Grade, 2022-2030(USD Million)
48. South Korea Sodium Bisulphite Market, By Application, 2022-2030(USD Million)
49. Rest of Asia-Pacific Sodium Bisulphite Market, By Grade, 2022-2030(USD Million)
50. Rest of Asia-Pacific Sodium Bisulphite Market, By Application, 2022-2030(USD Million)
51. South America Sodium Bisulphite Market, By Grade, 2022-2030(USD Million)
52. South America Sodium Bisulphite Market, By Application, 2022-2030(USD Million)
53. Brazil Sodium Bisulphite Market, By Grade, 2022-2030(USD Million)
54. Brazil Sodium Bisulphite Market, By Application, 2022-2030(USD Million)
55. Argentina Sodium Bisulphite Market, By Grade, 2022-2030(USD Million)
56. Argentina Sodium Bisulphite Market, By Application, 2022-2030(USD Million)
57. Rest of Latin America Sodium Bisulphite Market, By Grade, 2022-2030(USD Million)
58. Rest of Latin America Sodium Bisulphite Market, By Application, 2022-2030(USD Million)
59. Middle East and Africa Sodium Bisulphite Market, By Grade, 2022-2030(USD Million)
60. Middle East and Africa Sodium Bisulphite Market, By Application, 2022-2030(USD Million)
61. UAE Sodium Bisulphite Market, By Grade, 2022-2030(USD Million)
62. UAE Sodium Bisulphite Market, By Application, 2022-2030(USD Million)
63. South Africa Sodium Bisulphite Market, By Grade, 2022-2030(USD Million)
64. South Africa Sodium Bisulphite Market, By Application, 2022-2030(USD Million)
65. Egypt Sodium Bisulphite Market, By Grade, 2022-2030(USD Million)
66. Egypt Sodium Bisulphite Market, By Application, 2022-2030(USD Million)
67. Kuwait Sodium Bisulphite Market, By Grade, 2022-2030(USD Million)
68. Kuwait Sodium Bisulphite Market, By Application, 2022-2030(USD Million)
69. Saudi Arabia Sodium Bisulphite Market, By Grade, 2022-2030(USD Million)
70. Saudi Arabia Sodium Bisulphite Market, By Application, 2022-2030(USD Million)
71. Rest of Middle East Sodium Bisulphite Market, By Grade, 2022-2030(USD Million)
72. Rest of Middle East Sodium Bisulphite Market, By Application, 2022-2030(USD Million)
List of Figures
1. Global Sodium Bisulphite Market Segmentation
2. Sodium Bisulphite Market: Research Methodology
3. Market Size Estimation Methodology: Bottom-Up Approach
4. Market Size Estimation Methodology: Top-Down Approach
5. Data Triangulation
6. Porter’s Five Forces Analysis
7. Value Chain Analysis
8. Global Sodium Bisulphite Market Attractiveness Analysis By Grade
9. Global Sodium Bisulphite Market Attractiveness Analysis By Application
10. Global Sodium Bisulphite Market Attractiveness Analysis By Region
11. Global Sodium Bisulphite Market: Dynamics
12. Global Sodium Bisulphite Market Share By Grade(2022 & 2030)
13. Global Sodium Bisulphite Market Share By Application(2022 & 2030)
14. Global Sodium Bisulphite Market Share by Regions (2022 & 2030)
15. Global Sodium Bisulphite Market Share by Company (2021)
By Grade
By Application
By Region/Geography
Research has its special purpose to undertake marketing efficiently. In this competitive scenario, businesses need information across all industry verticals; the information about customer wants, market demand, competition, industry trends, distribution channels etc. This information needs to be updated regularly because businesses operate in a dynamic environment. Our organization, The Brainy Insights incorporates scientific and systematic research procedures in order to get proper market insights and industry analysis for overall business success. The analysis consists of studying the market from a miniscule level wherein we implement statistical tools which helps us in examining the data with accuracy and precision.
Our research reports feature both; quantitative and qualitative aspects for any market. Qualitative information for any market research process are fundamental because they reveal the customer needs and wants, usage and consumption for any product/service related to a specific industry. This in turn aids the marketers/investors in knowing certain perceptions of the customers. Qualitative research can enlighten about the different product concepts and designs along with unique service offering that in turn, helps define marketing problems and generate opportunities. On the other hand, quantitative research engages with the data collection process through interviews, e-mail interactions, surveys and pilot studies. Quantitative aspects for the market research are useful to validate the hypotheses generated during qualitative research method, explore empirical patterns in the data with the help of statistical tools, and finally make the market estimations.
The Brainy Insights offers comprehensive research and analysis, based on a wide assortment of factual insights gained through interviews with CXOs and global experts and secondary data from reliable sources. Our analysts and industry specialist assume vital roles in building up statistical tools and analysis models, which are used to analyse the data and arrive at accurate insights with exceedingly informative research discoveries. The data provided by our organization have proven precious to a diverse range of companies, facilitating them to address issues such as determining which products/services are the most appealing, whether or not customers use the product in the manner anticipated, the purchasing intentions of the market and many others.
Our research methodology encompasses an idyllic combination of primary and secondary initiatives. Key phases involved in this process are listed below:

The phase involves the gathering and collecting of market data and its related information with the help of different sources & research procedures.

The data procurement stage involves in data gathering and collecting through various data sources.
This stage involves in extensive research. These data sources includes:
Purchased Database: Purchased databases play a crucial role in estimating the market sizes irrespective of the domain. Our purchased database includes:
Primary Research: The Brainy Insights interacts with leading companies and experts of the concerned domain to develop the analyst team’s market understanding and expertise. It improves and substantiates every single data presented in the market reports. Primary research mainly involves in telephonic interviews, E-mail interactions and face-to-face interviews with the raw material providers, manufacturers/producers, distributors, & independent consultants. The interviews that we conduct provides valuable data on market size and industry growth trends prevailing in the market. Our organization also conducts surveys with the various industry experts in order to gain overall insights of the industry/market. For instance, in healthcare industry we conduct surveys with the pharmacists, doctors, surgeons and nurses in order to gain insights and key information of a medical product/device/equipment which the customers are going to usage. Surveys are conducted in the form of questionnaire designed by our own analyst team. Surveys plays an important role in primary research because surveys helps us to identify the key target audiences of the market. Additionally, surveys helps to identify the key target audience engaged with the market. Our survey team conducts the survey by targeting the key audience, thus gaining insights from them. Based on the perspectives of the customers, this information is utilized to formulate market strategies. Moreover, market surveys helps us to understand the current competitive situation of the industry. To be precise, our survey process typically involve with the 360 analysis of the market. This analytical process begins by identifying the prospective customers for a product or service related to the market/industry to obtain data on how a product/service could fit into customers’ lives.

Secondary Research: The secondary data sources includes information published by the on-profit organizations such as World bank, WHO, company fillings, investor presentations, annual reports, national government documents, statistical databases, blogs, articles, white papers and others. From the annual report, we analyse a company’s revenue to understand the key segment and market share of that organization in a particular region. We analyse the company websites and adopt the product mapping technique which is important for deriving the segment revenue. In the product mapping method, we select and categorize the products offered by the companies catering to domain specific market, deduce the product revenue for each of the companies so as to get overall estimation of the market size. We also source data and analyses trends based on information received from supply side and demand side intermediaries in the value chain. The supply side denotes the data gathered from supplier, distributor, wholesaler and the demand side illustrates the data gathered from the end customers for respective market domain.

The supply side for a domain specific market is analysed by:
The demand side for the market is estimated through:
In-house Library: Apart from these third-party sources, we have our in-house library of qualitative and quantitative information. Our in-house database includes market data for various industry and domains. These data are updated on regular basis as per the changing market scenario. Our library includes, historic databases, internal audit reports and archives.
Sometimes there are instances where there is no metadata or raw data available for any domain specific market. For those cases, we use our expertise to forecast and estimate the market size in order to generate comprehensive data sets. Our analyst team adopt a robust research technique in order to produce the estimates:
Data Synthesis: This stage involves the analysis & mapping of all the information obtained from the previous step. It also involves in scrutinizing the data for any discrepancy observed while data gathering related to the market. The data is collected with consideration to the heterogeneity of sources. Robust scientific techniques are in place for synthesizing disparate data sets and provide the essential contextual information that can orient market strategies. The Brainy Insights has extensive experience in data synthesis where the data passes through various stages:


Market Deduction & Formulation: The final stage comprises of assigning data points at appropriate market spaces so as to deduce feasible conclusions. Analyst perspective & subject matter expert based holistic form of market sizing coupled with industry analysis also plays a crucial role in this stage.
This stage involves in finalization of the market size and numbers that we have collected from data integration step. With data interpolation, it is made sure that there is no gap in the market data. Successful trend analysis is done by our analysts using extrapolation techniques, which provide the best possible forecasts for the market.
Data Validation & Market Feedback: Validation is the most important step in the process. Validation & re-validation via an intricately designed process helps us finalize data-points to be used for final calculations.

The Brainy Insights interacts with leading companies and experts of the concerned domain to develop the analyst team’s market understanding and expertise. It improves and substantiates every single data presented in the market reports. The data validation interview and discussion panels are typically composed of the most experienced industry members. The participants include, however, are not limited to:
Moreover, we always validate our data and findings through primary respondents from all the major regions we are working on.
Free Customization
Fortune 500 Clients
Free Yearly Update On Purchase Of Multi/Corporate License
Companies Served Till Date