- +1-315-215-1633
- sales@thebrainyinsights.com

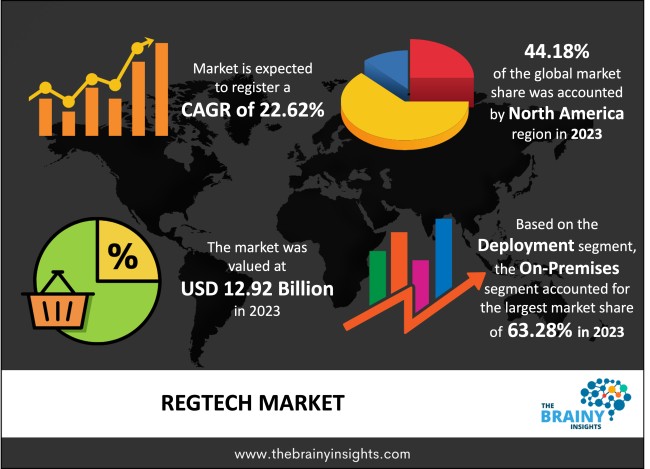
The global Regtech market generated USD 12.92 Billion revenue in 2023 and is projected to grow at a CAGR of 22.62% from 2024 to 2033. The market is expected to reach USD 99.28 Billion by 2033. The growth in the overall market segment of Banking, Financial Services, and Insurance (BFSI) coincides with a growing trend of embracing more digital solutions worldwide, which is in the market's favour. Also, the increase in the number of cases of fraud through the internet platform has caused a loss of money and leakage of private information belonging to business entities, spurring the market's growth trend.
Regtech can be explained as an application of technology to meet different regulatory requirements that firms and financial organizations experience. It encompasses an array of unique services intended to assist an organization in conforming to compliance needs, addressing risk concerns, or optimizing regulations management. Regtech uses innovative technologies like AI, Machine Learning, big data analysis, and blockchain to enable high-quality development in the regulatory compliance discipline. These technologies, in turn, help organizations to continuously monitor the data and draw and report compliance violations more efficiently and accurately, thus minimizing compliance overhead. Some of the regtech areas of specialities include AML, know your customer (KYC), verification, fraud, risks, reports, get, data, and compliance regulations. Here, regtech solutions provide much-needed help in analyzing and mitigating compliance risks: ‘‘By performing repetitive analytical tasks, substantiating identity of customers, and detecting suspicious activities in real-time, regtech solutions in business can minimize risks in compliance.’’ Regulatory technology effectively satisfies the increasing demand for change because it applies regulatory expectations flexibly. Technology is constantly evolving, and so are the rules that regulate it, thus making it difficult for organizations to keep up. Regtech enables organizations to quickly adapt to new regulatory requirements and make services more agile and adaptable by integrating compliance quickly and simply into the systems. The main advantage of regtech is its focus on the innovation of the regulation through collaboration with market participants and IT specialists. Regtech solutions focus on strengthening the existing supervisory competence of the regulators, identifying new threats, and making robust regulatory decisions using the help of new technologies and big data. As a result, regtech has emerged as an essential tool in shaping the future of compliance and risk exposure throughout various industries. Organizations engage well in compliance operations in more intricate jurisdictions, reduce compliance expenses, and enhance their governance and transparency profiles.
Get an overview of this study by requesting a free sample
1. Introduction
1.1. Objectives of the Study
1.2. Market Definition
1.3. Research Scope
1.4. Currency
1.5. Key Target Audience
2. Research Methodology and Assumptions
3. Executive Summary
4. Premium Insights
4.1. Porter’s Five Forces Analysis
4.2. Value Chain Analysis
4.3. Top Investment Pockets
4.3.1. Market Attractiveness Analysis By Component
4.3.2. Market Attractiveness Analysis By Deployment
4.3.3. Market Attractiveness Analysis By Application
4.3.4. Market Attractiveness Analysis By Enterprise Size
4.3.5. Market Attractiveness Analysis By End User
4.3.6. Market Attractiveness Analysis By Region
4.4. Industry Trends
5. Market Dynamics
5.1. Market Evaluation
5.2. Drivers
5.2.1. Increasing Regulatory Difficulty
5.2.2. Inventory Reduction, Time Management, and Recycle Costs Saving
5.3. Restraints
5.3.1. Resistance to Change
5.4. Opportunities
5.4.1. Industry Expansion
5.5. Challenges
5.5.1. Regulatory Complexity
6. Global Regtech Market Analysis and Forecast, By Component
6.1. Segment Overview
6.2. Solution
6.3. Services
7. Global Regtech Market Analysis and Forecast, By Deployment
7.1. Segment Overview
7.2. On-Premises
7.3. Cloud
8. Global Regtech Market Analysis and Forecast, By Application
8.1. Segment Overview
8.2. Anti-Money Laundering & Fraud Management
8.3. Identity Management
8.4. Risk & Compliance Management
8.5. Regulatory Reporting
8.6. Regulatory Intelligence
9. Global Regtech Market Analysis and Forecast, By Enterprise Size
9.1. Segment Overview
9.2. Large Enterprises
9.3. Small & Medium Enterprises (SMEs)
10. Global Regtech Market Analysis and Forecast, By End User
10.1. Segment Overview
10.2. Banks
10.3. Energy and Utilities
10.4. FinTech Firms
10.5. Insurance Companies
10.6. IT and Telecom
10.7. Public Sector
10.8. Others
11. Global Regtech Market Analysis and Forecast, By Regional Analysis
11.1. Segment Overview
11.2. North America
11.2.1. U.S.
11.2.2. Canada
11.2.3. Mexico
11.3. Europe
11.3.1. Germany
11.3.2. France
11.3.3. U.K.
11.3.4. Italy
11.3.5. Spain
11.4. Asia-Pacific
11.4.1. Japan
11.4.2. China
11.4.3. India
11.5. South America
11.5.1. Brazil
11.6. Middle East and Africa
11.6.1. UAE
11.6.2. South Africa
12. Global Regtech Market-Competitive Landscape
12.1. Overview
12.2. Market Share of Key Players in the Regtech Market
12.2.1. Global Company Market Share
12.2.2. North America Company Market Share
12.2.3. Europe Company Market Share
12.2.4. APAC Company Market Share
12.3. Competitive Situations and Trends
12.3.1. Product Launches and Developments
12.3.2. Partnerships, Collaborations, and Agreements
12.3.3. Mergers & Acquisitions
12.3.4. Expansions
13. Company Profiles
13.1. Actico GmbH
13.1.1. Business Overview
13.1.2. Company Snapshot
13.1.3. Company Market Share Analysis
13.1.4. Company Product Portfolio
13.1.5. Recent Developments
13.1.6. SWOT Analysis
13.2. Acuant, Inc.
13.2.1. Business Overview
13.2.2. Company Snapshot
13.2.3. Company Market Share Analysis
13.2.4. Company Product Portfolio
13.2.5. Recent Developments
13.2.6. SWOT Analysis
13.3. Ascent
13.3.1. Business Overview
13.3.2. Company Snapshot
13.3.3. Company Market Share Analysis
13.3.4. Company Product Portfolio
13.3.5. Recent Developments
13.3.6. SWOT Analysis
13.4. Ayasdi AI LLC
13.4.1. Business Overview
13.4.2. Company Snapshot
13.4.3. Company Market Share Analysis
13.4.4. Company Product Portfolio
13.4.5. Recent Developments
13.4.6. SWOT Analysis
13.5. Broadridge Financial Solutions, Inc.
13.5.1. Business Overview
13.5.2. Company Snapshot
13.5.3. Company Market Share Analysis
13.5.4. Company Product Portfolio
13.5.5. Recent Developments
13.5.6. SWOT Analysis
13.6. ComplyAdvantage
13.6.1. Business Overview
13.6.2. Company Snapshot
13.6.3. Company Market Share Analysis
13.6.4. Company Product Portfolio
13.6.5. Recent Developments
13.6.6. SWOT Analysis
13.7. Chainalysis Inc.
13.7.1. Business Overview
13.7.2. Company Snapshot
13.7.3. Company Market Share Analysis
13.7.4. Company Product Portfolio
13.7.5. Recent Developments
13.7.6. SWOT Analysis
13.8. Deloitte
13.8.1. Business Overview
13.8.2. Company Snapshot
13.8.3. Company Market Share Analysis
13.8.4. Company Product Portfolio
13.8.5. Recent Developments
13.8.6. SWOT Analysis
13.9. FundApps
13.9.1. Business Overview
13.9.2. Company Snapshot
13.9.3. Company Market Share Analysis
13.9.4. Company Product Portfolio
13.9.5. Recent Developments
13.9.6. SWOT Analysis
13.10. Fenergo
13.10.1. Business Overview
13.10.2. Company Snapshot
13.10.3. Company Market Share Analysis
13.10.4. Company Product Portfolio
13.10.5. Recent Developments
13.10.6. SWOT Analysis
13.11. IBM
13.11.1. Business Overview
13.11.2. Company Snapshot
13.11.3. Company Market Share Analysis
13.11.4. Company Product Portfolio
13.11.5. Recent Developments
13.11.6. SWOT Analysis
13.12. IdentityMind
13.12.1. Business Overview
13.12.2. Company Snapshot
13.12.3. Company Market Share Analysis
13.12.4. Company Product Portfolio
13.12.5. Recent Developments
13.12.6. SWOT Analysis
13.13. Jumio Corporation
13.13.1. Business Overview
13.13.2. Company Snapshot
13.13.3. Company Market Share Analysis
13.13.4. Company Product Portfolio
13.13.5. Recent Developments
13.13.6. SWOT Analysis
13.14. London Stock Exchange Group plc
13.14.1. Business Overview
13.14.2. Company Snapshot
13.14.3. Company Market Share Analysis
13.14.4. Company Product Portfolio
13.14.5. Recent Developments
13.14.6. SWOT Analysis
13.15. MetricStream Inc.
13.15.1. Business Overview
13.15.2. Company Snapshot
13.15.3. Company Market Share Analysis
13.15.4. Company Product Portfolio
13.15.5. Recent Developments
13.15.6. SWOT Analysis
13.16. Nice Ltd.
13.16.1. Business Overview
13.16.2. Company Snapshot
13.16.3. Company Market Share Analysis
13.16.4. Company Product Portfolio
13.16.5. Recent Developments
13.16.6. SWOT Analysis
13.17. PwC
13.17.1. Business Overview
13.17.2. Company Snapshot
13.17.3. Company Market Share Analysis
13.17.4. Company Product Portfolio
13.17.5. Recent Developments
13.17.6. SWOT Analysis
13.18. Thomson Reuters
13.18.1. Business Overview
13.18.2. Company Snapshot
13.18.3. Company Market Share Analysis
13.18.4. Company Product Portfolio
13.18.5. Recent Developments
13.18.6. SWOT Analysis
13.19. Wolters Kluwer N.V.
13.19.1. Business Overview
13.19.2. Company Snapshot
13.19.3. Company Market Share Analysis
13.19.4. Company Product Portfolio
13.19.5. Recent Developments
13.19.6. SWOT Analysis
List of Table
1. Global Regtech Market, By Component, 2020-2033 (USD Billion)
2. Global Solution, Regtech Market, By Region, 2020-2033 (USD Billion)
3. Global Services, Regtech Market, By Region, 2020-2033 (USD Billion)
4. Global Regtech Market, By Deployment, 2020-2033 (USD Billion)
5. Global On-Premises, Regtech Market, By Region, 2020-2033 (USD Billion)
6. Global Cloud, Regtech Market, By Region, 2020-2033 (USD Billion)
7. Global Regtech Market, By Application, 2020-2033 (USD Billion)
8. Global Anti-Money Laundering & Fraud Management, Regtech Market, By Region, 2020-2033 (USD Billion)
9. Global Identity Management, Regtech Market, By Region, 2020-2033 (USD Billion)
10. Global Risk & Compliance Management, Regtech Market, By Region, 2020-2033 (USD Billion)
11. Global Regulatory Reporting, Regtech Market, By Region, 2020-2033 (USD Billion)
12. Global Regulatory Intelligence, Regtech Market, By Region, 2020-2033 (USD Billion)
13. Global Regtech Market, By Enterprise Size, 2020-2033 (USD Billion)
14. Global Large Enterprises, Regtech Market, By Region, 2020-2033 (USD Billion)
15. Global Small & Medium Enterprises (SMEs), Regtech Market, By Region, 2020-2033 (USD Billion)
16. Global Regtech Market, By End User, 2020-2033 (USD Billion)
17. Global Banks, Regtech Market, By Region, 2020-2033 (USD Billion)
18. Global Energy and Utilities, Regtech Market, By Region, 2020-2033 (USD Billion)
19. Global FinTech Firms, Regtech Market, By Region, 2020-2033 (USD Billion)
20. Global Insurance Companies, Regtech Market, By Region, 2020-2033 (USD Billion)
21. Global IT and Telecom, Regtech Market, By Region, 2020-2033 (USD Billion)
22. Global Public Sector, Regtech Market, By Region, 2020-2033 (USD Billion)
23. Global Others Regtech Market, By Region, 2020-2033 (USD Billion)
24. Global Regtech Market, By Region, 2020-2033 (USD Billion)
25. North America Regtech Market, By Component, 2020-2033 (USD Billion)
26. North America Regtech Market, By Deployment, 2020-2033 (USD Billion)
27. North America Regtech Market, By Application, 2020-2033 (USD Billion)
28. North America Regtech Market, By Enterprise Size, 2020-2033 (USD Billion)
29. North America Regtech Market, By End User, 2020-2033 (USD Billion)
30. U.S. Regtech Market, By Component, 2020-2033 (USD Billion)
31. U.S. Regtech Market, By Deployment, 2020-2033 (USD Billion)
32. U.S. Regtech Market, By Application, 2020-2033 (USD Billion)
33. U.S. Regtech Market, By Enterprise Size, 2020-2033 (USD Billion)
34. U.S. Regtech Market, By End User, 2020-2033 (USD Billion)
35. Canada Regtech Market, By Component, 2020-2033 (USD Billion)
36. Canada Regtech Market, By Deployment, 2020-2033 (USD Billion)
37. Canada Regtech Market, By Application, 2020-2033 (USD Billion)
38. Canada Regtech Market, By Enterprise Size, 2020-2033 (USD Billion)
39. Canada Regtech Market, By End User, 2020-2033 (USD Billion)
40. Mexico Regtech Market, By Component, 2020-2033 (USD Billion)
41. Mexico Regtech Market, By Deployment, 2020-2033 (USD Billion)
42. Mexico Regtech Market, By Application, 2020-2033 (USD Billion)
43. Mexico Regtech Market, By Enterprise Size, 2020-2033 (USD Billion)
44. Mexico Regtech Market, By End User, 2020-2033 (USD Billion)
45. Europe Regtech Market, By Component, 2020-2033 (USD Billion)
46. Europe Regtech Market, By Deployment, 2020-2033 (USD Billion)
47. Europe Regtech Market, By Application, 2020-2033 (USD Billion)
48. Europe Regtech Market, By Enterprise Size, 2020-2033 (USD Billion)
49. Europe Regtech Market, By End User, 2020-2033 (USD Billion)
50. Germany Regtech Market, By Component, 2020-2033 (USD Billion)
51. Germany Regtech Market, By Deployment, 2020-2033 (USD Billion)
52. Germany Regtech Market, By Application, 2020-2033 (USD Billion)
53. Germany Regtech Market, By Enterprise Size, 2020-2033 (USD Billion)
54. Germany Regtech Market, By End User, 2020-2033 (USD Billion)
55. France Regtech Market, By Component, 2020-2033 (USD Billion)
56. France Regtech Market, By Deployment, 2020-2033 (USD Billion)
57. France Regtech Market, By Application, 2020-2033 (USD Billion)
58. France Regtech Market, By Enterprise Size, 2020-2033 (USD Billion)
59. France Regtech Market, By End User, 2020-2033 (USD Billion)
60. U.K. Regtech Market, By Component, 2020-2033 (USD Billion)
61. U.K. Regtech Market, By Deployment, 2020-2033 (USD Billion)
62. U.K. Regtech Market, By Application, 2020-2033 (USD Billion)
63. U.K. Regtech Market, By Enterprise Size, 2020-2033 (USD Billion)
64. U.K. Regtech Market, By End User, 2020-2033 (USD Billion)
65. Italy Regtech Market, By Component, 2020-2033 (USD Billion)
66. Italy Regtech Market, By Deployment, 2020-2033 (USD Billion)
67. Italy Regtech Market, By Application, 2020-2033 (USD Billion)
68. Italy Regtech Market, By Enterprise Size, 2020-2033 (USD Billion)
69. Italy Regtech Market, By End User, 2020-2033 (USD Billion)
70. Spain Regtech Market, By Component, 2020-2033 (USD Billion)
71. Spain Regtech Market, By Deployment, 2020-2033 (USD Billion)
72. Spain Regtech Market, By Application, 2020-2033 (USD Billion)
73. Spain Regtech Market, By Enterprise Size, 2020-2033 (USD Billion)
74. Spain Regtech Market, By End User, 2020-2033 (USD Billion)
75. Asia Pacific Regtech Market, By Component, 2020-2033 (USD Billion)
76. Asia Pacific Regtech Market, By Deployment, 2020-2033 (USD Billion)
77. Asia Pacific Regtech Market, By Application, 2020-2033 (USD Billion)
78. Asia Pacific Regtech Market, By Enterprise Size, 2020-2033 (USD Billion)
79. Asia Pacific Regtech Market, By End User, 2020-2033 (USD Billion)
80. Japan Regtech Market, By Component, 2020-2033 (USD Billion)
81. Japan Regtech Market, By Deployment, 2020-2033 (USD Billion)
82. Japan Regtech Market, By Application, 2020-2033 (USD Billion)
83. Japan Regtech Market, By Enterprise Size, 2020-2033 (USD Billion)
84. Japan Regtech Market, By End User, 2020-2033 (USD Billion)
85. China Regtech Market, By Component, 2020-2033 (USD Billion)
86. China Regtech Market, By Deployment, 2020-2033 (USD Billion)
87. China Regtech Market, By Application, 2020-2033 (USD Billion)
88. China Regtech Market, By Enterprise Size, 2020-2033 (USD Billion)
89. China Regtech Market, By End User, 2020-2033 (USD Billion)
90. India Regtech Market, By Component, 2020-2033 (USD Billion)
91. India Regtech Market, By Deployment, 2020-2033 (USD Billion)
92. India Regtech Market, By Application, 2020-2033 (USD Billion)
93. India Regtech Market, By Enterprise Size, 2020-2033 (USD Billion)
94. India Regtech Market, By End User, 2020-2033 (USD Billion)
95. South America Regtech Market, By Component, 2020-2033 (USD Billion)
96. South America Regtech Market, By Deployment, 2020-2033 (USD Billion)
97. South America Regtech Market, By Application, 2020-2033 (USD Billion)
98. South America Regtech Market, By Enterprise Size, 2020-2033 (USD Billion)
99. South America Regtech Market, By End User, 2020-2033 (USD Billion)
100. Brazil Regtech Market, By Component, 2020-2033 (USD Billion)
101. Brazil Regtech Market, By Deployment, 2020-2033 (USD Billion)
102. Brazil Regtech Market, By Application, 2020-2033 (USD Billion)
103. Brazil Regtech Market, By Enterprise Size, 2020-2033 (USD Billion)
104. Brazil Regtech Market, By End User, 2020-2033 (USD Billion)
105. Middle East and Africa Regtech Market, By Component, 2020-2033 (USD Billion)
106. Middle East and Africa Regtech Market, By Deployment, 2020-2033 (USD Billion)
107. Middle East and Africa Regtech Market, By Application, 2020-2033 (USD Billion)
108. Middle East and Africa Regtech Market, By Enterprise Size, 2020-2033 (USD Billion)
109. Middle East and Africa Regtech Market, By End User, 2020-2033 (USD Billion)
110. UAE Regtech Market, By Component, 2020-2033 (USD Billion)
111. UAE Regtech Market, By Deployment, 2020-2033 (USD Billion)
112. UAE Regtech Market, By Application, 2020-2033 (USD Billion)
113. UAE Regtech Market, By Enterprise Size, 2020-2033 (USD Billion)
114. UAE Regtech Market, By End User, 2020-2033 (USD Billion)
115. South Africa Regtech Market, By Component, 2020-2033 (USD Billion)
116. South Africa Regtech Market, By Deployment, 2020-2033 (USD Billion)
117. South Africa Regtech Market, By Application, 2020-2033 (USD Billion)
118. South Africa Regtech Market, By Enterprise Size, 2020-2033 (USD Billion)
119. South Africa Regtech Market, By End User, 2020-2033 (USD Billion)
List of Figures
1. Global Regtech Market Segmentation
2. Regtech Market: Research Methodology
3. Market Size Estimation Methodology: Bottom-Up Approach
4. Market Size Estimation Methodology: Top-Down Approach
5. Data Triangulation
6. Porter’s Five Forces Analysis
7. Value Chain Analysis
8. Global Regtech Market Attractiveness Analysis By Component
9. Global Regtech Market Attractiveness Analysis By Deployment
10. Global Regtech Market Attractiveness Analysis By Application
11. Global Regtech Market Attractiveness Analysis By Enterprise Size
12. Global Regtech Market Attractiveness Analysis By End User
13. Global Regtech Market Attractiveness Analysis By Region
14. Global Regtech Market: Dynamics
15. Global Regtech Market Share By Component (2024 & 2033)
16. Global Regtech Market Share By Deployment (2024 & 2033)
17. Global Regtech Market Share By Application (2024 & 2033)
18. Global Regtech Market Share By Enterprise Size (2024 & 2033)
19. Global Regtech Market Share By End User (2024 & 2033)
20. Global Regtech Market Share By Regions (2024 & 2033)
21. Global Regtech Market Share By Company (2023)
This study forecasts revenue at global, regional, and country levels from 2020 to 2033. The Brainy Insights has segmented the global Regtech market based on below-mentioned segments:
Global Regtech Market by Component:
Global Regtech Market by Deployment:
Global Regtech Market by Application:
Global Regtech Market by Enterprise Size:
Global Regtech Market by End User:
Global Regtech Market by Region:
Research has its special purpose to undertake marketing efficiently. In this competitive scenario, businesses need information across all industry verticals; the information about customer wants, market demand, competition, industry trends, distribution channels etc. This information needs to be updated regularly because businesses operate in a dynamic environment. Our organization, The Brainy Insights incorporates scientific and systematic research procedures in order to get proper market insights and industry analysis for overall business success. The analysis consists of studying the market from a miniscule level wherein we implement statistical tools which helps us in examining the data with accuracy and precision.
Our research reports feature both; quantitative and qualitative aspects for any market. Qualitative information for any market research process are fundamental because they reveal the customer needs and wants, usage and consumption for any product/service related to a specific industry. This in turn aids the marketers/investors in knowing certain perceptions of the customers. Qualitative research can enlighten about the different product concepts and designs along with unique service offering that in turn, helps define marketing problems and generate opportunities. On the other hand, quantitative research engages with the data collection process through interviews, e-mail interactions, surveys and pilot studies. Quantitative aspects for the market research are useful to validate the hypotheses generated during qualitative research method, explore empirical patterns in the data with the help of statistical tools, and finally make the market estimations.
The Brainy Insights offers comprehensive research and analysis, based on a wide assortment of factual insights gained through interviews with CXOs and global experts and secondary data from reliable sources. Our analysts and industry specialist assume vital roles in building up statistical tools and analysis models, which are used to analyse the data and arrive at accurate insights with exceedingly informative research discoveries. The data provided by our organization have proven precious to a diverse range of companies, facilitating them to address issues such as determining which products/services are the most appealing, whether or not customers use the product in the manner anticipated, the purchasing intentions of the market and many others.
Our research methodology encompasses an idyllic combination of primary and secondary initiatives. Key phases involved in this process are listed below:

The phase involves the gathering and collecting of market data and its related information with the help of different sources & research procedures.

The data procurement stage involves in data gathering and collecting through various data sources.
This stage involves in extensive research. These data sources includes:
Purchased Database: Purchased databases play a crucial role in estimating the market sizes irrespective of the domain. Our purchased database includes:
Primary Research: The Brainy Insights interacts with leading companies and experts of the concerned domain to develop the analyst team’s market understanding and expertise. It improves and substantiates every single data presented in the market reports. Primary research mainly involves in telephonic interviews, E-mail interactions and face-to-face interviews with the raw material providers, manufacturers/producers, distributors, & independent consultants. The interviews that we conduct provides valuable data on market size and industry growth trends prevailing in the market. Our organization also conducts surveys with the various industry experts in order to gain overall insights of the industry/market. For instance, in healthcare industry we conduct surveys with the pharmacists, doctors, surgeons and nurses in order to gain insights and key information of a medical product/device/equipment which the customers are going to usage. Surveys are conducted in the form of questionnaire designed by our own analyst team. Surveys plays an important role in primary research because surveys helps us to identify the key target audiences of the market. Additionally, surveys helps to identify the key target audience engaged with the market. Our survey team conducts the survey by targeting the key audience, thus gaining insights from them. Based on the perspectives of the customers, this information is utilized to formulate market strategies. Moreover, market surveys helps us to understand the current competitive situation of the industry. To be precise, our survey process typically involve with the 360 analysis of the market. This analytical process begins by identifying the prospective customers for a product or service related to the market/industry to obtain data on how a product/service could fit into customers’ lives.

Secondary Research: The secondary data sources includes information published by the on-profit organizations such as World bank, WHO, company fillings, investor presentations, annual reports, national government documents, statistical databases, blogs, articles, white papers and others. From the annual report, we analyse a company’s revenue to understand the key segment and market share of that organization in a particular region. We analyse the company websites and adopt the product mapping technique which is important for deriving the segment revenue. In the product mapping method, we select and categorize the products offered by the companies catering to domain specific market, deduce the product revenue for each of the companies so as to get overall estimation of the market size. We also source data and analyses trends based on information received from supply side and demand side intermediaries in the value chain. The supply side denotes the data gathered from supplier, distributor, wholesaler and the demand side illustrates the data gathered from the end customers for respective market domain.

The supply side for a domain specific market is analysed by:
The demand side for the market is estimated through:
In-house Library: Apart from these third-party sources, we have our in-house library of qualitative and quantitative information. Our in-house database includes market data for various industry and domains. These data are updated on regular basis as per the changing market scenario. Our library includes, historic databases, internal audit reports and archives.
Sometimes there are instances where there is no metadata or raw data available for any domain specific market. For those cases, we use our expertise to forecast and estimate the market size in order to generate comprehensive data sets. Our analyst team adopt a robust research technique in order to produce the estimates:
Data Synthesis: This stage involves the analysis & mapping of all the information obtained from the previous step. It also involves in scrutinizing the data for any discrepancy observed while data gathering related to the market. The data is collected with consideration to the heterogeneity of sources. Robust scientific techniques are in place for synthesizing disparate data sets and provide the essential contextual information that can orient market strategies. The Brainy Insights has extensive experience in data synthesis where the data passes through various stages:


Market Deduction & Formulation: The final stage comprises of assigning data points at appropriate market spaces so as to deduce feasible conclusions. Analyst perspective & subject matter expert based holistic form of market sizing coupled with industry analysis also plays a crucial role in this stage.
This stage involves in finalization of the market size and numbers that we have collected from data integration step. With data interpolation, it is made sure that there is no gap in the market data. Successful trend analysis is done by our analysts using extrapolation techniques, which provide the best possible forecasts for the market.
Data Validation & Market Feedback: Validation is the most important step in the process. Validation & re-validation via an intricately designed process helps us finalize data-points to be used for final calculations.

The Brainy Insights interacts with leading companies and experts of the concerned domain to develop the analyst team’s market understanding and expertise. It improves and substantiates every single data presented in the market reports. The data validation interview and discussion panels are typically composed of the most experienced industry members. The participants include, however, are not limited to:
Moreover, we always validate our data and findings through primary respondents from all the major regions we are working on.
Free Customization
Fortune 500 Clients
Free Yearly Update On Purchase Of Multi/Corporate License
Companies Served Till Date