- +1-315-215-1633
- sales@thebrainyinsights.com

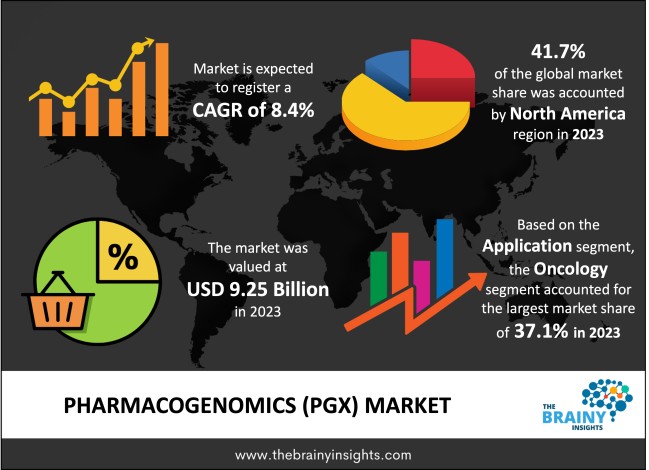
Global pharmacogenomics (PGx) market is expected to reach USD 20.71 billion by 2033, at a CAGR of 8.4% from 2024 to 2033. Global pharmacogenomics (PGx) market is witnessing a considerable growth owing to increasing incidences of chronic conditions. The pharmacogenomics (PGx) market has experienced significant popularity, leading to advancements in precision medicine. PGx aids in distinguishing between drug responders and non-responders, prevents adverse reactions, and determines the optimal therapeutic dosage. It is widely incorporated into various government initiatives, elevating its industry standing. The FDA mandates pharmacogenomic data labelling on medication packages for safety assurance and efficacy of approved drugs; hence, incorporating market-related information further reinforces growth prospects within the U.S. pharmaceutical sector.
Pharmacogenomics (PGx), is the study of how people respond differently to drug therapy based upon their genetic makeup. The pharmacogenomics is part of the field of precision medicine, which aims to treat each patient individually. It uses genomic information to study individual responses to drugs and helps healthcare provider to choose the right drug for each individual patient. Tailoring a patient’s medication to their unique genetic characteristics can replace one-size-fits-all approach to dosing and drug selection that is commonly used today. The Food and Drug Administration (FDA) monitor drug safety in the United States. Currently, over 250 prescription medications contain pharmacogenetic information in their FDA approved labels. The label's information contains the identification of biomarkers – the primary measurable indicators associated with a patient’s specific condition, which helps to identify targeted drug therapy specific for that genetic variations as well as list the genetic abnormality which may influence how a drug is broken down or metabolized in the body. This information can help doctors tailor drug prescriptions for individual patients by providing guidance on possible side effects, dose, or differences in effectiveness for people with certain gene variants.
Drug companies are also using pharmacogenomics to develop and market personalized medicines for people with specific genetic profiles. By studying a drug only in people likely to benefit from it, drug companies might be able to speed up the drug’s development and maximize its therapeutic benefit. The field of pharmacogenomics is still in its infancy phase and its use is currently quite limited, but new approaches are under study in clinical trials. In the future, pharmacogenomics will allow the development of tailored drugs to treat a wide range of health problems, including cancer, cardiovascular disease, Alzheimer disease, HIV/AIDS, and asthma.
Get an overview of this study by requesting a free sample
1. Introduction
1.1. Objectives of the Study
1.2. Market Definition
1.3. Research Scope
1.4. Currency
1.5. Key Target Audience
2. Research Methodology and Assumptions
3. Executive Summary
4. Premium Insights
4.1. Porter’s Five Forces Analysis
4.2. Value Chain Analysis
4.3. Top Investment Pockets
4.3.1. Market Attractiveness Analysis By Technology
4.3.2. Market Attractiveness Analysis By Application
4.3.3. Market Attractiveness Analysis By End User
4.3.4. Market Attractiveness Analysis By Region
4.4. Industry Trends
5. Market Dynamics
5.1. Market Evaluation
5.2. Drivers
5.2.1. Increasing demand for personalized medicines
5.2.2. Rising prevalence of chronic diseases
5.3. Restrains
5.3.1. Ethical issues
5.4. Opportunities
5.4.1. Increasing research and development activities for the development of new therapies
5.5. Challenges
5.5.1. Lack of skilled personnel could hamper the market growth
6. Global Pharmacogenomics (PGx) Market Analysis and Forecast, By Technology
6.1. Segment Overview
6.2. Polymerase Chain Reaction (PCR)
6.3. DNA Sequencing/Next Generation Sequencing (NGS)
6.4. Nucleic Acid Amplification Tests (NAATs)
6.5. Mass Spectrometry
6.6. Gel Electrophoresis
6.7. Hybridization
6.8. Microarray
6.9. Others
7. Global Pharmacogenomics (PGx) Market Analysis and Forecast, By Application
7.1. Segment Overview
7.2. Pain Management
7.3. Oncology
7.4. Infectious Diseases
7.5. Neurology/Psychiatry
7.6. Cardiovascular
7.7. Others
8. Global Pharmacogenomics (PGx) Market Analysis and Forecast, By End User
8.1. Segment Overview
8.2. Research Organization
8.3. Hospitals
8.4. Diagnostic Centers
8.5. Academic Institutes
8.6. Others
9. Global Pharmacogenomics (PGx) Market Analysis and Forecast, By Regional Analysis
9.1. Segment Overview
9.2. North America
9.2.1. U.S.
9.2.2. Canada
9.2.3. Mexico
9.3. Europe
9.3.1. Germany
9.3.2. France
9.3.3. U.K.
9.3.4. Italy
9.3.5. Spain
9.4. Asia-Pacific
9.4.1. Japan
9.4.2. China
9.4.3. India
9.5. South America
9.5.1. Brazil
9.6. Middle East and Africa
9.6.1. UAE
9.6.2. South Africa
10. Global Pharmacogenomics (PGx) Market-Competitive Landscape
10.1. Overview
10.2. Market Share of Key Players in the Pharmacogenomics (PGx) Market
10.2.1. Global Company Market Share
10.2.2. North America Company Market Share
10.2.3. Europe Company Market Share
10.2.4. APAC Company Market Share
10.3. Competitive Situations and Trends
10.3.1. Product Launches and Developments
10.3.2. Partnerships, Collaborations, and Agreements
10.3.3. Mergers & Acquisitions
10.3.4. Expansions
11. Company Profiles
11.1. Abbott Laboratories
11.1.1. Business Overview
11.1.2. Company Snapshot
11.1.3. Company Market Share Analysis
11.1.4. Company Product Portfolio
11.1.5. Recent Developments
11.1.6. SWOT Analysis
11.2. AstraZeneca PLC
11.2.1. Business Overview
11.2.2. Company Snapshot
11.2.3. Company Market Share Analysis
11.2.4. Company Product Portfolio
11.2.5. Recent Developments
11.2.6. SWOT Analysis
11.3. Admera Health, LLC
11.3.1. Business Overview
11.3.2. Company Snapshot
11.3.3. Company Market Share Analysis
11.3.4. Company Product Portfolio
11.3.5. Recent Developments
11.3.6. SWOT Analysis
11.4. Agena Biosciences, Inc.
11.4.1. Business Overview
11.4.2. Company Snapshot
11.4.3. Company Market Share Analysis
11.4.4. Company Product Portfolio
11.4.5. Recent Developments
11.4.6. SWOT Analysis
11.5. Biomerieux
11.5.1. Business Overview
11.5.2. Company Snapshot
11.5.3. Company Market Share Analysis
11.5.4. Company Product Portfolio
11.5.5. Recent Developments
11.5.6. SWOT Analysis
11.6. Bayer AG
11.6.1. Business Overview
11.6.2. Company Snapshot
11.6.3. Company Market Share Analysis
11.6.4. Company Product Portfolio
11.6.5. Recent Developments
11.6.6. SWOT Analysis
11.7. Cancer Genetics, Inc.
11.7.1. Business Overview
11.7.2. Company Snapshot
11.7.3. Company Market Share Analysis
11.7.4. Company Product Portfolio
11.7.5. Recent Developments
11.7.6. SWOT Analysis
11.8. Dynamic DNA Laboratories
11.8.1. Business Overview
11.8.2. Company Snapshot
11.8.3. Company Market Share Analysis
11.8.4. Company Product Portfolio
11.8.5. Recent Developments
11.8.6. SWOT Analysis
11.9. F. Hoffmann-La Roche Ltd
11.9.1. Business Overview
11.9.2. Company Snapshot
11.9.3. Company Market Share Analysis
11.9.4. Company Product Portfolio
11.9.5. Recent Developments
11.9.6. SWOT Analysis
11.10. geneOmbio Technologies Pvt Ltd.
11.10.1. Business Overview
11.10.2. Company Snapshot
11.10.3. Company Market Share Analysis
11.10.4. Company Product Portfolio
11.10.5. Recent Developments
11.10.6. SWOT Analysis
11.11. Qiagen
11.11.1. Business Overview
11.11.2. Company Snapshot
11.11.3. Company Market Share Analysis
11.11.4. Company Product Portfolio
11.11.5. Recent Developments
11.11.6. SWOT Analysis
11.12. Genomic Health, Inc.
11.12.1. Business Overview
11.12.2. Company Snapshot
11.12.3. Company Market Share Analysis
11.12.4. Company Product Portfolio
11.12.5. Recent Developments
11.12.6. SWOT Analysis
11.13. Illumina, Inc.
11.13.1. Business Overview
11.13.2. Company Snapshot
11.13.3. Company Market Share Analysis
11.13.4. Company Product Portfolio
11.13.5. Recent Developments
11.13.6. SWOT Analysis
11.14. Laboratory Corporation of America Holdings
11.14.1. Business Overview
11.14.2. Company Snapshot
11.14.3. Company Market Share Analysis
11.14.4. Company Product Portfolio
11.14.5. Recent Developments
11.14.6. SWOT Analysis
11.15. Bio-Rad Laboratories Inc.
11.15.1. Business Overview
11.15.2. Company Snapshot
11.15.3. Company Market Share Analysis
11.15.4. Company Product Portfolio
11.15.5. Recent Developments
11.15.6. SWOT Analysis
List of Table
1. Global Pharmacogenomics (PGx) Market, By Technology, 2020–2033 (USD Billion)
2. Global Polymerase Chain Reaction (PCR) Pharmacogenomics (PGx) Market, By Region, 2020–2033 (USD Billion)
3. Global DNA Sequencing/Next Generation Sequencing (NGS) Pharmacogenomics (PGx) Market, By Region, 2020–2033 (USD Billion)
4. Global Nucleic Acid Amplification Tests (NAATs) Pharmacogenomics (PGx) Market, By Region, 2020–2033 (USD Billion)
5. Global Mass Spectrometry Pharmacogenomics (PGx) Market, By Region, 2020–2033 (USD Billion)
6. Global Gel Electrophoresis Pharmacogenomics (PGx) Market, By Region, 2020–2033 (USD Billion)
7. Global Hybridization Pharmacogenomics (PGx) Market, By Region, 2020–2033 (USD Billion)
8. Global Microarray Pharmacogenomics (PGx) Market, By Region, 2020–2033 (USD Billion)
9. Global Others Pharmacogenomics (PGx) Market, By Region, 2020–2033 (USD Billion)
10. Global Pharmacogenomics (PGx) Market, By Application, 2020–2033 (USD Billion)
11. Global Pain Management Pharmacogenomics (PGx) Market, By Region, 2020–2033 (USD Billion)
12. Global Oncology Pharmacogenomics (PGx) Market, By Region, 2020–2033 (USD Billion)
13. Global Infectious Diseases Pharmacogenomics (PGx) Market, By Region, 2020–2033 (USD Billion)
14. Global Neurology/Psychiatry Pharmacogenomics (PGx) Market, By Region, 2020–2033 (USD Billion)
15. Global Cardiovascular Pharmacogenomics (PGx) Market, By Region, 2020–2033 (USD Billion)
16. Global Others Pharmacogenomics (PGx) Market, By Region, 2020–2033 (USD Billion)
17. Global Pharmacogenomics (PGx) Market, By End User, 2020–2033 (USD Billion)
18. Global Research Organization Pharmacogenomics (PGx) Market, By Region, 2020–2033 (USD Billion)
19. Global Hospitals Pharmacogenomics (PGx) Market, By Region, 2020–2033 (USD Billion)
20. Global Diagnostic Centers Pharmacogenomics (PGx) Market, By Region, 2020–2033 (USD Billion)
21. Global Academic Institutes Pharmacogenomics (PGx) Market, By Region, 2020–2033 (USD Billion)
22. Global Others Pharmacogenomics (PGx) Market, By Region, 2020–2033 (USD Billion)
23. Global Pharmacogenomics (PGx) Market, By Region, 2020–2033 (USD Billion)
24. Global Pharmacogenomics (PGx) Market, By North America, 2020–2033 (USD Billion)
25. North America Pharmacogenomics (PGx) Market, By Technology, 2020–2033 (USD Billion)
26. North America Pharmacogenomics (PGx) Market, By Application, 2020–2033 (USD Billion)
27. North America Pharmacogenomics (PGx) Market, By End User, 2020–2033 (USD Billion)
28. U.S. Pharmacogenomics (PGx) Market, By Technology, 2020–2033 (USD Billion)
29. U.S. Pharmacogenomics (PGx) Market, By Application, 2020–2033 (USD Billion)
30. U.S. Pharmacogenomics (PGx) Market, By End User, 2020–2033 (USD Billion)
31. Canada Pharmacogenomics (PGx) Market, By Technology, 2020–2033 (USD Billion)
32. Canada Pharmacogenomics (PGx) Market, By Application, 2020–2033 (USD Billion)
33. Canada Pharmacogenomics (PGx) Market, By End User, 2020–2033 (USD Billion)
34. Mexico Pharmacogenomics (PGx) Market, By Technology, 2020–2033 (USD Billion)
35. Mexico Pharmacogenomics (PGx) Market, By Application, 2020–2033 (USD Billion)
36. Mexico Pharmacogenomics (PGx) Market, By End User, 2020–2033 (USD Billion)
37. Europe Pharmacogenomics (PGx) Market, By Technology, 2020–2033 (USD Billion)
38. Europe Pharmacogenomics (PGx) Market, By Application, 2020–2033 (USD Billion)
39. Europe Pharmacogenomics (PGx) Market, By End User, 2020–2033 (USD Billion)
40. Germany Pharmacogenomics (PGx) Market, By Technology, 2020–2033 (USD Billion)
41. Germany Pharmacogenomics (PGx) Market, By Application, 2020–2033 (USD Billion)
42. Germany Pharmacogenomics (PGx) Market, By End User, 2020–2033 (USD Billion)
43. France Pharmacogenomics (PGx) Market, By Technology, 2020–2033 (USD Billion)
44. France Pharmacogenomics (PGx) Market, By Application, 2020–2033 (USD Billion)
45. France Pharmacogenomics (PGx) Market, By End User, 2020–2033 (USD Billion)
46. U.K. Pharmacogenomics (PGx) Market, By Technology, 2020–2033 (USD Billion)
47. U.K. Pharmacogenomics (PGx) Market, By Application, 2020–2033 (USD Billion)
48. U.K. Pharmacogenomics (PGx) Market, By End User, 2020–2033 (USD Billion)
49. Italy Pharmacogenomics (PGx) Market, By Technology, 2020–2033 (USD Billion)
50. Italy Pharmacogenomics (PGx) Market, By Application, 2020–2033 (USD Billion)
51. Italy Pharmacogenomics (PGx) Market, By End User, 2020–2033 (USD Billion)
52. Spain Pharmacogenomics (PGx) Market, By Technology, 2020–2033 (USD Billion)
53. Spain Pharmacogenomics (PGx) Market, By Application, 2020–2033 (USD Billion)
54. Spain Pharmacogenomics (PGx) Market, By End User, 2020–2033 (USD Billion)
55. Asia Pacific Pharmacogenomics (PGx) Market, By Technology, 2020–2033 (USD Billion)
56. Asia Pacific Pharmacogenomics (PGx) Market, By Application, 2020–2033 (USD Billion)
57. Asia Pacific Pharmacogenomics (PGx) Market, By End User, 2020–2033 (USD Billion)
58. Japan Pharmacogenomics (PGx) Market, By Technology, 2020–2033 (USD Billion)
59. Japan Pharmacogenomics (PGx) Market, By Application, 2020–2033 (USD Billion)
60. Japan Pharmacogenomics (PGx) Market, By End User, 2020–2033 (USD Billion)
61. China Pharmacogenomics (PGx) Market, By Technology, 2020–2033 (USD Billion)
62. China Pharmacogenomics (PGx) Market, By Application, 2020–2033 (USD Billion)
63. China Pharmacogenomics (PGx) Market, By End User, 2020–2033 (USD Billion)
64. India Pharmacogenomics (PGx) Market, By Technology, 2020–2033 (USD Billion)
65. India Pharmacogenomics (PGx) Market, By Application, 2020–2033 (USD Billion)
66. India Pharmacogenomics (PGx) Market, By End User, 2020–2033 (USD Billion)
67. South America Pharmacogenomics (PGx) Market, By Technology, 2020–2033 (USD Billion)
68. South America Pharmacogenomics (PGx) Market, By Application, 2020–2033 (USD Billion)
69. South America Pharmacogenomics (PGx) Market, By End User, 2020–2033 (USD Billion)
70. Brazil Pharmacogenomics (PGx) Market, By Technology, 2020–2033 (USD Billion)
71. Brazil Pharmacogenomics (PGx) Market, By Application, 2020–2033 (USD Billion)
72. Brazil Pharmacogenomics (PGx) Market, By End User, 2020–2033 (USD Billion)
73. Middle East and Africa Pharmacogenomics (PGx) Market, By Technology, 2020–2033 (USD Billion)
74. Middle East and Africa Pharmacogenomics (PGx) Market, By Application, 2020–2033 (USD Billion)
75. Middle East and Africa Pharmacogenomics (PGx) Market, By End User, 2020–2033 (USD Billion)
76. UAE Pharmacogenomics (PGx) Market, By Technology, 2020–2033 (USD Billion)
77. UAE Pharmacogenomics (PGx) Market, By Application, 2020–2033 (USD Billion)
78. UAE Pharmacogenomics (PGx) Market, By End User, 2020–2033 (USD Billion)
79. South Africa Pharmacogenomics (PGx) Market, By Technology, 2020–2033 (USD Billion)
80. South Africa Pharmacogenomics (PGx) Market, By Application, 2020–2033 (USD Billion)
81. South Africa Pharmacogenomics (PGx) Market, By End User, 2020–2033 (USD Billion)
List of Figures
1. Global Pharmacogenomics (PGx) Market Segmentation
2. Pharmacogenomics (PGx) Market: Research Methodology
3. Market Size Estimation Methodology: Bottom-Up Approach
4. Market Size Estimation Methodology: Top-Down Approach
5. Data Triangulation
6. Porter’s Five Forces Analysis
7. Value Chain Analysis
8. Global Pharmacogenomics (PGx) Market Attractiveness Analysis By Technology
9. Global Pharmacogenomics (PGx) Market Attractiveness Analysis By Application
10. Global Pharmacogenomics (PGx) Market Attractiveness Analysis By End User
11. Global Pharmacogenomics (PGx) Market Attractiveness Analysis By Region
12. Global Pharmacogenomics (PGx) Market: Dynamics
13. Global Pharmacogenomics (PGx) Market Share By Technology (2023 & 2033)
14. Global Pharmacogenomics (PGx) Market Share By Application (2023 & 2033)
15. Global Pharmacogenomics (PGx) Market Share By End User (2023 & 2033)
16. Global Pharmacogenomics (PGx) Market Share by Regions (2023 & 2033)
17. Global Pharmacogenomics (PGx) Market Share by Company (2023)
This study forecasts revenue at global, regional, and country levels from 2020 to 2033. The Brainy Insights has segmented the global pharmacogenomics (PGx) market on the basis of below mentioned segments:
Global Pharmacogenomics (PGx) Market by Technology:
Global Pharmacogenomics (PGx) Market by Application:
Global Pharmacogenomics (PGx) Market by End User:
Global Pharmacogenomics (PGx) Market by Region:
Research has its special purpose to undertake marketing efficiently. In this competitive scenario, businesses need information across all industry verticals; the information about customer wants, market demand, competition, industry trends, distribution channels etc. This information needs to be updated regularly because businesses operate in a dynamic environment. Our organization, The Brainy Insights incorporates scientific and systematic research procedures in order to get proper market insights and industry analysis for overall business success. The analysis consists of studying the market from a miniscule level wherein we implement statistical tools which helps us in examining the data with accuracy and precision.
Our research reports feature both; quantitative and qualitative aspects for any market. Qualitative information for any market research process are fundamental because they reveal the customer needs and wants, usage and consumption for any product/service related to a specific industry. This in turn aids the marketers/investors in knowing certain perceptions of the customers. Qualitative research can enlighten about the different product concepts and designs along with unique service offering that in turn, helps define marketing problems and generate opportunities. On the other hand, quantitative research engages with the data collection process through interviews, e-mail interactions, surveys and pilot studies. Quantitative aspects for the market research are useful to validate the hypotheses generated during qualitative research method, explore empirical patterns in the data with the help of statistical tools, and finally make the market estimations.
The Brainy Insights offers comprehensive research and analysis, based on a wide assortment of factual insights gained through interviews with CXOs and global experts and secondary data from reliable sources. Our analysts and industry specialist assume vital roles in building up statistical tools and analysis models, which are used to analyse the data and arrive at accurate insights with exceedingly informative research discoveries. The data provided by our organization have proven precious to a diverse range of companies, facilitating them to address issues such as determining which products/services are the most appealing, whether or not customers use the product in the manner anticipated, the purchasing intentions of the market and many others.
Our research methodology encompasses an idyllic combination of primary and secondary initiatives. Key phases involved in this process are listed below:

The phase involves the gathering and collecting of market data and its related information with the help of different sources & research procedures.

The data procurement stage involves in data gathering and collecting through various data sources.
This stage involves in extensive research. These data sources includes:
Purchased Database: Purchased databases play a crucial role in estimating the market sizes irrespective of the domain. Our purchased database includes:
Primary Research: The Brainy Insights interacts with leading companies and experts of the concerned domain to develop the analyst team’s market understanding and expertise. It improves and substantiates every single data presented in the market reports. Primary research mainly involves in telephonic interviews, E-mail interactions and face-to-face interviews with the raw material providers, manufacturers/producers, distributors, & independent consultants. The interviews that we conduct provides valuable data on market size and industry growth trends prevailing in the market. Our organization also conducts surveys with the various industry experts in order to gain overall insights of the industry/market. For instance, in healthcare industry we conduct surveys with the pharmacists, doctors, surgeons and nurses in order to gain insights and key information of a medical product/device/equipment which the customers are going to usage. Surveys are conducted in the form of questionnaire designed by our own analyst team. Surveys plays an important role in primary research because surveys helps us to identify the key target audiences of the market. Additionally, surveys helps to identify the key target audience engaged with the market. Our survey team conducts the survey by targeting the key audience, thus gaining insights from them. Based on the perspectives of the customers, this information is utilized to formulate market strategies. Moreover, market surveys helps us to understand the current competitive situation of the industry. To be precise, our survey process typically involve with the 360 analysis of the market. This analytical process begins by identifying the prospective customers for a product or service related to the market/industry to obtain data on how a product/service could fit into customers’ lives.

Secondary Research: The secondary data sources includes information published by the on-profit organizations such as World bank, WHO, company fillings, investor presentations, annual reports, national government documents, statistical databases, blogs, articles, white papers and others. From the annual report, we analyse a company’s revenue to understand the key segment and market share of that organization in a particular region. We analyse the company websites and adopt the product mapping technique which is important for deriving the segment revenue. In the product mapping method, we select and categorize the products offered by the companies catering to domain specific market, deduce the product revenue for each of the companies so as to get overall estimation of the market size. We also source data and analyses trends based on information received from supply side and demand side intermediaries in the value chain. The supply side denotes the data gathered from supplier, distributor, wholesaler and the demand side illustrates the data gathered from the end customers for respective market domain.

The supply side for a domain specific market is analysed by:
The demand side for the market is estimated through:
In-house Library: Apart from these third-party sources, we have our in-house library of qualitative and quantitative information. Our in-house database includes market data for various industry and domains. These data are updated on regular basis as per the changing market scenario. Our library includes, historic databases, internal audit reports and archives.
Sometimes there are instances where there is no metadata or raw data available for any domain specific market. For those cases, we use our expertise to forecast and estimate the market size in order to generate comprehensive data sets. Our analyst team adopt a robust research technique in order to produce the estimates:
Data Synthesis: This stage involves the analysis & mapping of all the information obtained from the previous step. It also involves in scrutinizing the data for any discrepancy observed while data gathering related to the market. The data is collected with consideration to the heterogeneity of sources. Robust scientific techniques are in place for synthesizing disparate data sets and provide the essential contextual information that can orient market strategies. The Brainy Insights has extensive experience in data synthesis where the data passes through various stages:


Market Deduction & Formulation: The final stage comprises of assigning data points at appropriate market spaces so as to deduce feasible conclusions. Analyst perspective & subject matter expert based holistic form of market sizing coupled with industry analysis also plays a crucial role in this stage.
This stage involves in finalization of the market size and numbers that we have collected from data integration step. With data interpolation, it is made sure that there is no gap in the market data. Successful trend analysis is done by our analysts using extrapolation techniques, which provide the best possible forecasts for the market.
Data Validation & Market Feedback: Validation is the most important step in the process. Validation & re-validation via an intricately designed process helps us finalize data-points to be used for final calculations.

The Brainy Insights interacts with leading companies and experts of the concerned domain to develop the analyst team’s market understanding and expertise. It improves and substantiates every single data presented in the market reports. The data validation interview and discussion panels are typically composed of the most experienced industry members. The participants include, however, are not limited to:
Moreover, we always validate our data and findings through primary respondents from all the major regions we are working on.
Free Customization
Fortune 500 Clients
Free Yearly Update On Purchase Of Multi/Corporate License
Companies Served Till Date