- +1-315-215-1633
- sales@thebrainyinsights.com

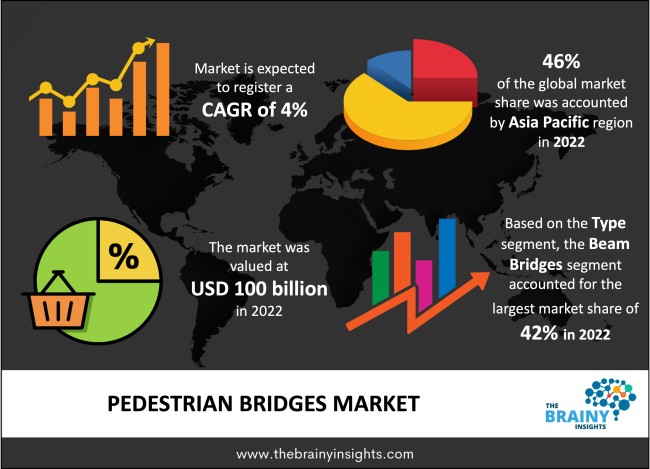
The global pedestrian bridges market is expected to grow from USD 100 billion in 2022 to USD 148.02 billion by 2032, at a CAGR of 4% from 2023-2032. The increasing building and construction activities will augment the growth of the global pedestrian bridges market.
When one place is connected to another place through an overhead structure is called a bridge. It is usually constructed to circumvent an obstruction to ensure a safer, faster and optimal travel solution. For instance, bridges can be built over rivers to facilitate river crossing through an alternate mode of transportation which is safer, faster and more reliable than boats. Bridges can also be built over busy roads to reduce traffic congestion and make travel faster for users. The bridges which are constructed exclusively for the use of pedestrians are called pedestrian bridges. No vehicles are allowed on these bridges, and only people can access them. These can be constructed for a variety of purposes. For instance, they can be built over busy highways, railway tracks, and train stations to facilitate the population's easy, fast and safe movement without obstructing the vehicular traffic on the roads or trains. They are also built over natural topographic structures or rivers, making it challenging to construct a road on them to access places on the banks of these structures. There are different types of pedestrian bridges, namely, beam, boardwalk, clapper and moon bridge, among many others. The bridges are also constructed over picturesque landscapes, allowing individuals to enjoy the views from a high point. Cyclists also use these bridges; they are accessible to persons with disabilities, given the special ramps constructed for them, and pet owners use them as safer. Furthermore, these bridges can be networked or connected to make access to several points easier and safer without impeding vehicular traffic or other activities under the bridges.
Get an overview of this study by requesting a free sample
March 2023 – According to the 2022-23 Economic report, Delhi, India, has swiftly increased the number of its pedestrian bridges, adding 27 in the last two years. By 2021–2022, 113 footbridges had been constructed, four more had been added between April and December, and six more would be operational by the following month. According to the survey conducted in 2022–2033, pedestrians and bicycles must be taken into consideration when designing and building roads in Delhi. According to the Delhi vehicle Crash Report 2021, three people have died on average daily in vehicle accidents in the city during the last two years. With 504 fatalities (or 40%) and 1,536 injuries, pedestrians comprised most victims in 2017. These numbers prompted the government to ramp up the construction of pedestrian bridges in the capital to ensure citizens' safety.
1. Introduction
1.1. Objectives of the Study
1.2. Market Definition
1.3. Research Scope
1.4. Currency
1.5. Key Target Audience
2. Research Methodology and Assumptions
3. Executive Summary
4. Premium Insights
4.1. Porter’s Five Forces Analysis
4.2. Value Chain Analysis
4.3. Top Investment Pockets
4.3.1. Market Attractiveness Analysis by Type
4.3.2. Market Attractiveness Analysis by Construction Type
4.3.3. Market Attractiveness Analysis by Material Type
4.3.4. Market Attractiveness Analysis by Region
4.4. Industry Trends
5. Market Dynamics
5.1. Market Evaluation
5.2. Drivers
5.2.1. The rapid worldwide urbanization
5.3. Restraints
5.3.1. The high initial cost of investment
5.4. Opportunities
5.4.1. The development of advanced technologies and building materials
5.5. Challenges
5.5.1. The lack of proper maintenance
6. Global Pedestrian Bridges Market Analysis and Forecast, By Type
6.1. Segment Overview
6.2. Truss Bridges
6.3. Suspension Bridges
6.4. Arch Bridges
6.5. Beam Bridges
6.6. Others
7. Global Pedestrian Bridges Market Analysis and Forecast, By Construction Type
7.1. Segment Overview
7.2. New Construction
7.3. Reconstruction and Repair
8. Global Pedestrian Bridges Market Analysis and Forecast, By Material Type
8.1. Segment Overview
8.2. Concrete
8.3. Steel
8.4. Others
9. Global Pedestrian Bridges Market Analysis and Forecast, By Regional Analysis
9.1. Segment Overview
9.2. North America
9.2.1. U.S.
9.2.2. Canada
9.2.3. Mexico
9.3. Europe
9.3.1. Germany
9.3.2. France
9.3.3. U.K.
9.3.4. Italy
9.3.5. Spain
9.4. Asia-Pacific
9.4.1. Japan
9.4.2. China
9.4.3. India
9.5. South America
9.5.1. Brazil
9.6. Middle East and Africa
9.6.1. UAE
9.6.2. South Africa
10. Global Pedestrian Bridges Market-Competitive Landscape
10.1. Overview
10.2. Market Share of Key Players in the Pedestrian Bridges Market
10.2.1. Global Company Market Share
10.2.2. North America Company Market Share
10.2.3. Europe Company Market Share
10.2.4. APAC Company Market Share
10.3. Competitive Situations and Trends
10.3.1. Product Launches and Developments
10.3.2. Partnerships, Collaborations, and Agreements
10.3.3. Mergers & Acquisitions
10.3.4. Expansions
11. Company Profiles
11.1. Backwoods Bridges LLC
11.1.1. Business Overview
11.1.2. Company Snapshot
11.1.3. Company Market Share Analysis
11.1.4. Company Product Portfolio
11.1.5. Recent Developments
11.1.6. SWOT Analysis
11.2. Contech Engineered Solutions LLC
11.2.1. Business Overview
11.2.2. Company Snapshot
11.2.3. Company Market Share Analysis
11.2.4. Company Product Portfolio
11.2.5. Recent Developments
11.2.6. SWOT Analysis
11.3. Denton Corker Marshall
11.3.1. Business Overview
11.3.2. Company Snapshot
11.3.3. Company Market Share Analysis
11.3.4. Company Product Portfolio
11.3.5. Recent Developments
11.3.6. SWOT Analysis
11.4. IJP Corporation Ltd
11.4.1. Business Overview
11.4.2. Company Snapshot
11.4.3. Company Market Share Analysis
11.4.4. Company Product Portfolio
11.4.5. Recent Developments
11.4.6. SWOT Analysis
11.5. Landmark Products Pty Ltd
11.5.1. Business Overview
11.5.2. Company Snapshot
11.5.3. Company Market Share Analysis
11.5.4. Company Product Portfolio
11.5.5. Recent Developments
11.5.6. SWOT Analysis
11.6. Mace Group
11.6.1. Business Overview
11.6.2. Company Snapshot
11.6.3. Company Market Share Analysis
11.6.4. Company Product Portfolio
11.6.5. Recent Developments
11.6.6. SWOT Analysis
11.7. Nature Bridges
11.7.1. Business Overview
11.7.2. Company Snapshot
11.7.3. Company Market Share Analysis
11.7.4. Company Product Portfolio
11.7.5. Recent Developments
11.7.6. SWOT Analysis
11.8. Owings & Merrill (SOM)
11.8.1. Business Overview
11.8.2. Company Snapshot
11.8.3. Company Market Share Analysis
11.8.4. Company Product Portfolio
11.8.5. Recent Developments
11.8.6. SWOT Analysis
11.9. Skidmore
11.9.1. Business Overview
11.9.2. Company Snapshot
11.9.3. Company Market Share Analysis
11.9.4. Company Product Portfolio
11.9.5. Recent Developments
11.9.6. SWOT Analysis
11.10. The Walsh Group
11.10.1. Business Overview
11.10.2. Company Snapshot
11.10.3. Company Market Share Analysis
11.10.4. Company Product Portfolio
11.10.5. Recent Developments
11.10.6. SWOT Analysis
List of Table
1. Global Pedestrian Bridges Market, By Type, 2019-2032 (USD Million)
2. Global Truss Bridges Pedestrian Bridges Market, By Region, 2019-2032 (USD Million)
3. Global Suspension Bridges Pedestrian Bridges Market, By Region, 2019-2032 (USD Million)
4. Global Arch Bridges Pedestrian Bridges Market, By Region, 2019-2032 (USD Million)
5. Global Beam Bridges Pedestrian Bridges Market, By Region, 2019-2032 (USD Million)
6. Global Others Pedestrian Bridges Market, By Region, 2019-2032 (USD Million)
7. Global Pedestrian Bridges Market, By Construction Type, 2019-2032 (USD Million)
8. Global New Construction Pedestrian Bridges Market, By Region, 2019-2032 (USD Million)
9. Global Reconstruction and Repair Pedestrian Bridges Market, By Region, 2019-2032 (USD Million)
10. Global Pedestrian Bridges Market, By Material Type, 2019-2032 (USD Million)
11. Global Concrete Pedestrian Bridges Market, By Region, 2019-2032 (USD Million)
12. Global Steel Pedestrian Bridges Market, By Region, 2019-2032 (USD Million)
13. Global Others Pedestrian Bridges Market, By Region, 2019-2032 (USD Million)
14. Global Pedestrian Bridges Market, By Region, 2019-2032 (USD Million)
15. North America Pedestrian Bridges Market, By Type, 2019-2032 (USD Million)
16. North America Pedestrian Bridges Market, By Construction Type, 2019-2032 (USD Million)
17. North America Pedestrian Bridges Market, By Material Type, 2019-2032 (USD Million)
18. U.S. Pedestrian Bridges Market, By Type, 2019-2032 (USD Million)
19. U.S. Pedestrian Bridges Market, By Construction Type, 2019-2032 (USD Million)
20. U.S. Pedestrian Bridges Market, By Material Type, 2019-2032 (USD Million)
21. Canada Pedestrian Bridges Market, By Type, 2019-2032 (USD Million)
22. Canada Pedestrian Bridges Market, By Construction Type, 2019-2032 (USD Million)
23. Canada Pedestrian Bridges Market, By Material Type, 2019-2032 (USD Million)
24. Mexico Pedestrian Bridges Market, By Type, 2019-2032 (USD Million)
25. Mexico Pedestrian Bridges Market, By Construction Type, 2019-2032 (USD Million)
26. Mexico Pedestrian Bridges Market, By Material Type, 2019-2032 (USD Million)
27. Europe Pedestrian Bridges Market, By Type, 2019-2032 (USD Million)
28. Europe Pedestrian Bridges Market, By Construction Type, 2019-2032 (USD Million)
29. Europe Pedestrian Bridges Market, By Material Type, 2019-2032 (USD Million)
30. Germany Pedestrian Bridges Market, By Type, 2019-2032 (USD Million)
31. Germany Pedestrian Bridges Market, By Construction Type, 2019-2032 (USD Million)
32. Germany Pedestrian Bridges Market, By Material Type, 2019-2032 (USD Million)
33. France Pedestrian Bridges Market, By Type, 2019-2032 (USD Million)
34. France Pedestrian Bridges Market, By Construction Type, 2019-2032 (USD Million)
35. France Pedestrian Bridges Market, By Material Type, 2019-2032 (USD Million)
36. U.K. Pedestrian Bridges Market, By Type, 2019-2032 (USD Million)
37. U.K. Pedestrian Bridges Market, By Construction Type, 2019-2032 (USD Million)
38. U.K. Pedestrian Bridges Market, By Material Type, 2019-2032 (USD Million)
39. Italy Pedestrian Bridges Market, By Type, 2019-2032 (USD Million)
40. Italy Pedestrian Bridges Market, By Construction Type, 2019-2032 (USD Million)
41. Italy Pedestrian Bridges Market, By Material Type, 2019-2032 (USD Million)
42. Spain Pedestrian Bridges Market, By Type, 2019-2032 (USD Million)
43. Spain Pedestrian Bridges Market, By Construction Type, 2019-2032 (USD Million)
44. Spain Pedestrian Bridges Market, By Material Type, 2019-2032 (USD Million)
45. Asia Pacific Pedestrian Bridges Market, By Type, 2019-2032 (USD Million)
46. Asia Pacific Pedestrian Bridges Market, By Construction Type, 2019-2032 (USD Million)
47. Asia Pacific Pedestrian Bridges Market, By Material Type, 2019-2032 (USD Million)
48. Japan Pedestrian Bridges Market, By Type, 2019-2032 (USD Million)
49. Japan Pedestrian Bridges Market, By Construction Type, 2019-2032 (USD Million)
50. Japan Pedestrian Bridges Market, By Material Type, 2019-2032 (USD Million)
51. China Pedestrian Bridges Market, By Type, 2019-2032 (USD Million)
52. China Pedestrian Bridges Market, By Construction Type, 2019-2032 (USD Million)
53. China Pedestrian Bridges Market, By Material Type, 2019-2032 (USD Million)
54. India Pedestrian Bridges Market, By Type, 2019-2032 (USD Million)
55. India Pedestrian Bridges Market, By Construction Type, 2019-2032 (USD Million)
56. India Pedestrian Bridges Market, By Material Type, 2019-2032 (USD Million)
57. South America Pedestrian Bridges Market, By Type, 2019-2032 (USD Million)
58. South America Pedestrian Bridges Market, By Construction Type, 2019-2032 (USD Million)
59. South America Pedestrian Bridges Market, By Material Type, 2019-2032 (USD Million)
60. Brazil Pedestrian Bridges Market, By Type, 2019-2032 (USD Million)
61. Brazil Pedestrian Bridges Market, By Construction Type, 2019-2032 (USD Million)
62. Brazil Pedestrian Bridges Market, By Material Type, 2019-2032 (USD Million)
63. Middle East and Africa Pedestrian Bridges Market, By Type, 2019-2032 (USD Million)
64. Middle East and Africa Pedestrian Bridges Market, By Construction Type, 2019-2032 (USD Million)
65. Middle East and Africa Pedestrian Bridges Market, By Material Type, 2019-2032 (USD Million)
66. UAE Pedestrian Bridges Market, By Type, 2019-2032 (USD Million)
67. UAE Pedestrian Bridges Market, By Construction Type, 2019-2032 (USD Million)
68. UAE Pedestrian Bridges Market, By Material Type, 2019-2032 (USD Million)
69. South Africa Pedestrian Bridges Market, By Type, 2019-2032 (USD Million)
70. South Africa Pedestrian Bridges Market, By Construction Type, 2019-2032 (USD Million)
71. South Africa Pedestrian Bridges Market, By Material Type, 2019-2032 (USD Million)
List of Figures
1. Global Pedestrian Bridges Market Segmentation
2. Pedestrian Bridges Market: Research Methodology
3. Market Size Estimation Methodology: Bottom-Up Approach
4. Market Size Estimation Methodology: Top-Down Approach
5. Data Triangulation
6. Porter’s Five Forces Analysis
7. Value Chain Analysis
8. Global Pedestrian Bridges Market Attractiveness Analysis by Type
9. Global Pedestrian Bridges Market Attractiveness Analysis by Construction Type
10. Global Pedestrian Bridges Market Attractiveness Analysis by Material Type
11. Global Pedestrian Bridges Market Attractiveness Analysis by Region
12. Global Pedestrian Bridges Market: Dynamics
13. Global Pedestrian Bridges Market Share by Type (2022 & 2032)
14. Global Pedestrian Bridges Market Share by Construction Type (2022 & 2032)
15. Global Pedestrian Bridges Market Share by Material Type (2022 & 2032)
16. Global Pedestrian Bridges Market Share by Regions (2022 & 2032)
17. Global Pedestrian Bridges Market Share by Company (2022)
This study forecasts revenue at global, regional, and country levels from 2019 to 2032. The Brainy Insights has segmented the global pedestrian bridges market based on below mentioned segments:
Global Pedestrian Bridges Market by Type:
Global Pedestrian Bridges Market by Construction Type:
Global Pedestrian Bridges Market by Material Type:
Global Pedestrian Bridges Market by Region:
Research has its special purpose to undertake marketing efficiently. In this competitive scenario, businesses need information across all industry verticals; the information about customer wants, market demand, competition, industry trends, distribution channels etc. This information needs to be updated regularly because businesses operate in a dynamic environment. Our organization, The Brainy Insights incorporates scientific and systematic research procedures in order to get proper market insights and industry analysis for overall business success. The analysis consists of studying the market from a miniscule level wherein we implement statistical tools which helps us in examining the data with accuracy and precision.
Our research reports feature both; quantitative and qualitative aspects for any market. Qualitative information for any market research process are fundamental because they reveal the customer needs and wants, usage and consumption for any product/service related to a specific industry. This in turn aids the marketers/investors in knowing certain perceptions of the customers. Qualitative research can enlighten about the different product concepts and designs along with unique service offering that in turn, helps define marketing problems and generate opportunities. On the other hand, quantitative research engages with the data collection process through interviews, e-mail interactions, surveys and pilot studies. Quantitative aspects for the market research are useful to validate the hypotheses generated during qualitative research method, explore empirical patterns in the data with the help of statistical tools, and finally make the market estimations.
The Brainy Insights offers comprehensive research and analysis, based on a wide assortment of factual insights gained through interviews with CXOs and global experts and secondary data from reliable sources. Our analysts and industry specialist assume vital roles in building up statistical tools and analysis models, which are used to analyse the data and arrive at accurate insights with exceedingly informative research discoveries. The data provided by our organization have proven precious to a diverse range of companies, facilitating them to address issues such as determining which products/services are the most appealing, whether or not customers use the product in the manner anticipated, the purchasing intentions of the market and many others.
Our research methodology encompasses an idyllic combination of primary and secondary initiatives. Key phases involved in this process are listed below:

The phase involves the gathering and collecting of market data and its related information with the help of different sources & research procedures.

The data procurement stage involves in data gathering and collecting through various data sources.
This stage involves in extensive research. These data sources includes:
Purchased Database: Purchased databases play a crucial role in estimating the market sizes irrespective of the domain. Our purchased database includes:
Primary Research: The Brainy Insights interacts with leading companies and experts of the concerned domain to develop the analyst team’s market understanding and expertise. It improves and substantiates every single data presented in the market reports. Primary research mainly involves in telephonic interviews, E-mail interactions and face-to-face interviews with the raw material providers, manufacturers/producers, distributors, & independent consultants. The interviews that we conduct provides valuable data on market size and industry growth trends prevailing in the market. Our organization also conducts surveys with the various industry experts in order to gain overall insights of the industry/market. For instance, in healthcare industry we conduct surveys with the pharmacists, doctors, surgeons and nurses in order to gain insights and key information of a medical product/device/equipment which the customers are going to usage. Surveys are conducted in the form of questionnaire designed by our own analyst team. Surveys plays an important role in primary research because surveys helps us to identify the key target audiences of the market. Additionally, surveys helps to identify the key target audience engaged with the market. Our survey team conducts the survey by targeting the key audience, thus gaining insights from them. Based on the perspectives of the customers, this information is utilized to formulate market strategies. Moreover, market surveys helps us to understand the current competitive situation of the industry. To be precise, our survey process typically involve with the 360 analysis of the market. This analytical process begins by identifying the prospective customers for a product or service related to the market/industry to obtain data on how a product/service could fit into customers’ lives.

Secondary Research: The secondary data sources includes information published by the on-profit organizations such as World bank, WHO, company fillings, investor presentations, annual reports, national government documents, statistical databases, blogs, articles, white papers and others. From the annual report, we analyse a company’s revenue to understand the key segment and market share of that organization in a particular region. We analyse the company websites and adopt the product mapping technique which is important for deriving the segment revenue. In the product mapping method, we select and categorize the products offered by the companies catering to domain specific market, deduce the product revenue for each of the companies so as to get overall estimation of the market size. We also source data and analyses trends based on information received from supply side and demand side intermediaries in the value chain. The supply side denotes the data gathered from supplier, distributor, wholesaler and the demand side illustrates the data gathered from the end customers for respective market domain.

The supply side for a domain specific market is analysed by:
The demand side for the market is estimated through:
In-house Library: Apart from these third-party sources, we have our in-house library of qualitative and quantitative information. Our in-house database includes market data for various industry and domains. These data are updated on regular basis as per the changing market scenario. Our library includes, historic databases, internal audit reports and archives.
Sometimes there are instances where there is no metadata or raw data available for any domain specific market. For those cases, we use our expertise to forecast and estimate the market size in order to generate comprehensive data sets. Our analyst team adopt a robust research technique in order to produce the estimates:
Data Synthesis: This stage involves the analysis & mapping of all the information obtained from the previous step. It also involves in scrutinizing the data for any discrepancy observed while data gathering related to the market. The data is collected with consideration to the heterogeneity of sources. Robust scientific techniques are in place for synthesizing disparate data sets and provide the essential contextual information that can orient market strategies. The Brainy Insights has extensive experience in data synthesis where the data passes through various stages:


Market Deduction & Formulation: The final stage comprises of assigning data points at appropriate market spaces so as to deduce feasible conclusions. Analyst perspective & subject matter expert based holistic form of market sizing coupled with industry analysis also plays a crucial role in this stage.
This stage involves in finalization of the market size and numbers that we have collected from data integration step. With data interpolation, it is made sure that there is no gap in the market data. Successful trend analysis is done by our analysts using extrapolation techniques, which provide the best possible forecasts for the market.
Data Validation & Market Feedback: Validation is the most important step in the process. Validation & re-validation via an intricately designed process helps us finalize data-points to be used for final calculations.

The Brainy Insights interacts with leading companies and experts of the concerned domain to develop the analyst team’s market understanding and expertise. It improves and substantiates every single data presented in the market reports. The data validation interview and discussion panels are typically composed of the most experienced industry members. The participants include, however, are not limited to:
Moreover, we always validate our data and findings through primary respondents from all the major regions we are working on.
Free Customization
Fortune 500 Clients
Free Yearly Update On Purchase Of Multi/Corporate License
Companies Served Till Date