- +1-315-215-1633
- sales@thebrainyinsights.com

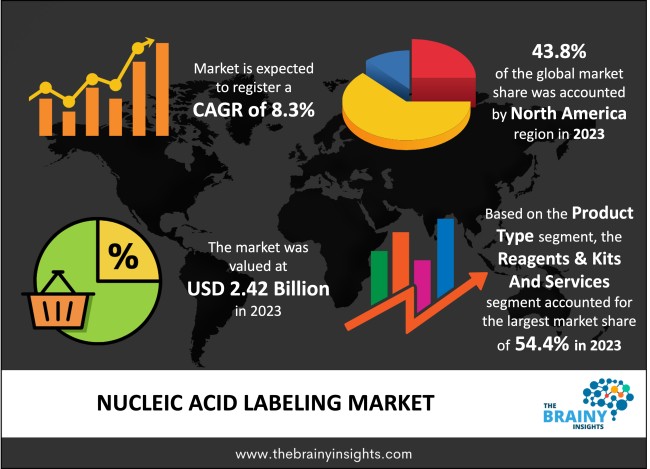
Global nucleic acid labeling market is expected to reach USD 5.36 billion by 2033, at a CAGR of 8.3% from 2024 to 2033. Global Nucleic Acid Labeling market is witnessing a considerable growth owing to rising genomic and enzymology research. Nucleic acid molecules are the most vital type of macromolecules present in cells and viruses. They play a crucial role in storing genetic information, making it easily accessible for expression. DNA and RNA are the two primary types of nucleic acids; while DNA transmits data to create proteins, RNA helps with protein synthesis. Nucleic acids possess remarkable stability, making them highly reliable during experiments involving radioactive phosphates or P-32 labelling on DNA and proteins that aim to treat ailments like polycythemia vera & leukemia. Moreover, fluorescent properties can also be attributed to these acids by appending fluorophores/quenchers directly onto their structure, thereby allowing tagging lines separately as biotin using various kits related to this process when required for different assay purposes.
Nucleic acids are complex and large molecules accountable for transmission of genetic information from one generation to the next. The two main types of nucleic acids are deoxyribonucleic acid (DNA) and ribonucleic acid (RNA). DNA carries out the task of transmission of hereditary characters, while RNA is accountable for protein synthesis. Generally, nucleic acids are labelled with tags which facilitate the detection and purification processes. There are numerous chemical and enzymatic methods available for labeling nucleic acids, such as integration of fluorescent tags, radioactive phosphates, and modifications with biotin, which are chiefly utilized in biotechnology applications. DNA and RNA fragments of irregular length are referred as probes. These nucleic acid probes can be labelled with tags throughout the process of synthesis. Depending on application, nucleic acids may be labeled at their 3’ end, 5’ end, or throughout (overall) molecule. Moreover, the creation of a single double-stranded molecule with complementary base pairing of two single-stranded nucleic acids (DNA or RNA) is referred as hybridization of probe. This hybridization of probes can assist for the detection of a defined target sequence of nucleic acids. However, based on the modification and if costly purification services are required for purchasing of custom oligonucleotide probes (mostly RNA) can be expensive. Before, radioisotope labels were used for hybridization probes. However, requirement for non-radioactive labels is increasing. The nucleic acid labeling market is driven by rising genomic and enzymology research, increasing health care expenditure, improvements in disease diagnostics, and growing government initiatives and investments in R&D in molecular biology. However, high competition in the market and lack of skilled professionals can negatively impact market growth in the long term. Moreover, the developing economies may provide new growth opportunities for the players operating in the nucleic acid labeling market. Also, procedures such as purification and modification of oligonucleotides, essential in most hybridization reactions, can generate additional costs. These factors are expected to hinder the market during the forecast period.
Get an overview of this study by requesting a free sample
1. Introduction
1.1. Objectives of the Study
1.2. Market Definition
1.3. Research Scope
1.4. Currency
1.5. Key Target Audience
2. Research Methodology and Assumptions
3. Executive Summary
4. Premium Insights
4.1. Porter’s Five Forces Analysis
4.2. Value Chain Analysis
4.3. Top Investment Pockets
4.3.1. Market Attractiveness Analysis By Product Type
4.3.2. Market Attractiveness Analysis By Application
4.3.3. Market Attractiveness Analysis By End User
4.3.4. Market Attractiveness Analysis By Region
4.4. Industry Trends
5. Market Dynamics
5.1. Market Evaluation
5.2. Drivers
5.2.1. Rising genomic and enzymology research
5.2.2. Increasing health care expenditure & improvements in disease diagnostics
5.3. Restraints
5.3.1. Lack of skilled professionals
5.4. Opportunities
5.4.1. The developing economies may provide new growth opportunities
6. Global Nucleic Acid Labeling Market Analysis and Forecast, By Product Type
6.1. Segment Overview
6.2. Reagents & Kits
6.3. Services
7. Global Nucleic Acid Labeling Market Analysis and Forecast, By Application
7.1. Segment Overview
7.2. Microarray
7.3. Blotting
7.4. Fish
7.5. In Situ Hybridization
7.6. DNA Sequencing
7.7. Pcr
7.8. Others
8. Global Nucleic Acid Labeling Market Analysis and Forecast, By End User
8.1. Segment Overview
8.2. Diagnostic Centers
8.3. Research Centers
8.4. Hospitals
9. Global Nucleic Acid Labeling Market Analysis and Forecast, By Regional Analysis
9.1. Segment Overview
9.2. North America
9.2.1. U.S.
9.2.2. Canada
9.2.3. Mexico
9.3. Europe
9.3.1. Germany
9.3.2. France
9.3.3. U.K.
9.3.4. Italy
9.3.5. Spain
9.4. Asia-Pacific
9.4.1. Japan
9.4.2. China
9.4.3. India
9.5. South America
9.5.1. Brazil
9.6. Middle East and Africa
9.6.1. UAE
9.6.2. South Africa
10. Global Nucleic Acid Labeling Market-Competitive Landscape
10.1. Overview
10.2. Market Share of Key Players in Global Nucleic Acid Labeling Market
10.2.1. Global Company Market Share
10.2.2. North America Company Market Share
10.2.3. Europe Company Market Share
10.2.4. APAC Company Market Share
10.3. Competitive Situations and Trends
10.3.1. Product Launches and Developments
10.3.2. Partnerships, Collaborations, and Agreements
10.3.3. Mergers & Acquisitions
10.3.4. Expansions
11. Company Profiles
11.1. Merck & Co., Inc.
11.1.1. Business Overview
11.1.2. Company Snapshot
11.1.3. Company Market Share Analysis
11.1.4. Company Product Portfolio
11.1.5. Recent Developments
11.1.6. SWOT Analysis
11.2. PerkinElmer, Inc.
11.2.1. Business Overview
11.2.2. Company Snapshot
11.2.3. Company Market Share Analysis
11.2.4. Company Product Portfolio
11.2.5. Recent Developments
11.2.6. SWOT Analysis
11.3. New England Biolabs
11.3.1. Business Overview
11.3.2. Company Snapshot
11.3.3. Company Market Share Analysis
11.3.4. Company Product Portfolio
11.3.5. Recent Developments
11.3.6. SWOT Analysis
11.4. F. Hoffmann La-Roche AG
11.4.1. Business Overview
11.4.2. Company Snapshot
11.4.3. Company Market Share Analysis
11.4.4. Company Product Portfolio
11.4.5. Recent Developments
11.4.6. SWOT Analysis
11.5. Enzo Biochem
11.5.1. Business Overview
11.5.2. Company Snapshot
11.5.3. Company Market Share Analysis
11.5.4. Company Product Portfolio
11.5.5. Recent Developments
11.5.6. SWOT Analysis
11.6. General Electric Company
11.6.1. Business Overview
11.6.2. Company Snapshot
11.6.3. Company Market Share Analysis
11.6.4. Company Product Portfolio
11.6.5. Recent Developments
11.6.6. SWOT Analysis
11.7. Vector Laboratories
11.7.1. Business Overview
11.7.2. Company Snapshot
11.7.3. Company Market Share Analysis
11.7.4. Company Product Portfolio
11.7.5. Recent Developments
11.7.6. SWOT Analysis
11.8. Promega Corporation
11.8.1. Business Overview
11.8.2. Company Snapshot
11.8.3. Company Market Share Analysis
11.8.4. Company Product Portfolio
11.8.5. Recent Developments
11.8.6. SWOT Analysis
11.9. Agilent Technologies
11.9.1. Business Overview
11.9.2. Company Snapshot
11.9.3. Company Market Share Analysis
11.9.4. Company Product Portfolio
11.9.5. Recent Developments
11.9.6. SWOT Analysis
11.10. Thermo Fisher Scientific, Inc
11.10.1. Business Overview
11.10.2. Company Snapshot
11.10.3. Company Market Share Analysis
11.10.4. Company Product Portfolio
11.10.5. Recent Developments
11.10.6. SWOT Analysis
11.11. NanoView Biosciences Inc
11.11.1. Business Overview
11.11.2. Company Snapshot
11.11.3. Company Market Share Analysis
11.11.4. Company Product Portfolio
11.11.5. Recent Developments
11.11.6. SWOT Analysis
List of Table
1. Global Nucleic Acid Labeling Market, By Product Type, 2020–2033 (USD Billion)
2. Global Reagents & Kits Nucleic Acid Labeling Market, By Region, 2020–2033 (USD Billion)
3. Global Services Nucleic Acid Labeling Market, By Region, 2020–2033 (USD Billion)
4. Global Nucleic Acid Labeling Market, By Application, 2020–2033 (USD Billion)
5. Global Microarray, Nucleic Acid Labeling Market, By Region, 2020–2033 (USD Billion)
6. Global Blotting, Nucleic Acid Labeling Market, By Region, 2020–2033 (USD Billion)
7. Global Fish, Nucleic Acid Labeling Market, By Region, 2020–2033 (USD Billion)
8. Global In Situ Hybridization, Nucleic Acid Labeling Market, By Region, 2020–2033 (USD Billion)
9. Global DNA Sequencing, Nucleic Acid Labeling Market, By Region, 2020–2033 (USD Billion)
10. Global Pcr, Nucleic Acid Labeling Market, By Region, 2020–2033 (USD Billion)
11. Global Others, Nucleic Acid Labeling Market, By Region, 2020–2033 (USD Billion)
12. Global Nucleic Acid Labeling Market, By End User, 2020–2033 (USD Billion)
13. Global Diagnostic Centers, Nucleic Acid Labeling Market, By Region, 2020–2033 (USD Billion)
14. Global Research Centers, Nucleic Acid Labeling Market, By Region, 2020–2033 (USD Billion)
15. Global Hospitals, Nucleic Acid Labeling Market, By Region, 2020–2033 (USD Billion)
16. Global Nucleic Acid Labeling Market, By Region, 2020–2033 (USD Billion)
17. Global Nucleic Acid Labeling Market, By North America, 2020–2033 (USD Billion)
18. North America Nucleic Acid Labeling Market, By Product Type, 2020–2033 (USD Billion)
19. North America Nucleic Acid Labeling Market, By Application, 2020–2033 (USD Billion)
20. North America Nucleic Acid Labeling Market, By End User, 2020–2033 (USD Billion)
21. U.S. Nucleic Acid Labeling Market, By Product Type, 2020–2033 (USD Billion)
22. U.S. Nucleic Acid Labeling Market, By Application, 2020–2033 (USD Billion)
23. U.S. Nucleic Acid Labeling Market, By End User, 2020–2033 (USD Billion)
24. Canada Nucleic Acid Labeling Market, By Product Type, 2020–2033 (USD Billion)
25. Canada Nucleic Acid Labeling Market, By Application, 2020–2033 (USD Billion)
26. Canada Nucleic Acid Labeling Market, By End User, 2020–2033 (USD Billion)
27. Mexico Nucleic Acid Labeling Market, By Product Type, 2020–2033 (USD Billion)
28. Mexico Nucleic Acid Labeling Market, By Application, 2020–2033 (USD Billion)
29. Mexico Nucleic Acid Labeling Market, By End User, 2020–2033 (USD Billion)
30. Europe Nucleic Acid Labeling Market, By Product Type, 2020–2033 (USD Billion)
31. Europe Nucleic Acid Labeling Market, By Application, 2020–2033 (USD Billion)
32. Europe Nucleic Acid Labeling Market, By End User, 2020–2033 (USD Billion)
33. Germany Nucleic Acid Labeling Market, By Product Type, 2020–2033 (USD Billion)
34. Germany Nucleic Acid Labeling Market, By Application, 2020–2033 (USD Billion)
35. Germany Nucleic Acid Labeling Market, By End User, 2020–2033 (USD Billion)
36. France Nucleic Acid Labeling Market, By Product Type, 2020–2033 (USD Billion)
37. France Nucleic Acid Labeling Market, By Application, 2020–2033 (USD Billion)
38. France Nucleic Acid Labeling Market, By End User, 2020–2033 (USD Billion)
39. U.K. Nucleic Acid Labeling Market, By Product Type, 2020–2033 (USD Billion)
40. U.K. Nucleic Acid Labeling Market, By Application, 2020–2033 (USD Billion)
41. U.K. Nucleic Acid Labeling Market, By End User, 2020–2033 (USD Billion)
42. Italy Nucleic Acid Labeling Market, By Product Type, 2020–2033 (USD Billion)
43. Italy Nucleic Acid Labeling Market, By Application, 2020–2033 (USD Billion)
44. Italy Nucleic Acid Labeling Market, By End User, 2020–2033 (USD Billion)
45. Spain Nucleic Acid Labeling Market, By Product Type, 2020–2033 (USD Billion)
46. Spain Nucleic Acid Labeling Market, By Application, 2020–2033 (USD Billion)
47. Spain Nucleic Acid Labeling Market, By End User, 2020–2033 (USD Billion)
48. Asia Pacific Nucleic Acid Labeling Market, By Product Type, 2020–2033 (USD Billion)
49. Asia Pacific Nucleic Acid Labeling Market, By Application, 2020–2033 (USD Billion)
50. Asia Pacific Nucleic Acid Labeling Market, By End User, 2020–2033 (USD Billion)
51. Japan Nucleic Acid Labeling Market, By Product Type, 2020–2033 (USD Billion)
52. Japan Nucleic Acid Labeling Market, By Application, 2020–2033 (USD Billion)
53. Japan Nucleic Acid Labeling Market, By End User, 2020–2033 (USD Billion)
54. China Nucleic Acid Labeling Market, By Product Type, 2020–2033 (USD Billion)
55. China Nucleic Acid Labeling Market, By Application, 2020–2033 (USD Billion)
56. China Nucleic Acid Labeling Market, By End User, 2020–2033 (USD Billion)
57. India Nucleic Acid Labeling Market, By Product Type, 2020–2033 (USD Billion)
58. India Nucleic Acid Labeling Market, By Application, 2020–2033 (USD Billion)
59. India Nucleic Acid Labeling Market, By End User, 2020–2033 (USD Billion)
60. South America Nucleic Acid Labeling Market, By Product Type, 2020–2033 (USD Billion)
61. South America Nucleic Acid Labeling Market, By Application, 2020–2033 (USD Billion)
62. South America Nucleic Acid Labeling Market, By End User, 2020–2033 (USD Billion)
63. Brazil Nucleic Acid Labeling Market, By Product Type, 2020–2033 (USD Billion)
64. Brazil Nucleic Acid Labeling Market, By Application, 2020–2033 (USD Billion)
65. Brazil Nucleic Acid Labeling Market, By End User, 2020–2033 (USD Billion)
66. Middle East and Africa Nucleic Acid Labeling Market, By Product Type, 2020–2033 (USD Billion)
67. Middle East and Africa Nucleic Acid Labeling Market, By Application, 2020–2033 (USD Billion)
68. Middle East Nucleic Acid Labeling Market, By End User, 2020–2033 (USD Billion)
69. UAE Nucleic Acid Labeling Market, By Product Type, 2020–2033 (USD Billion)
70. UAE Nucleic Acid Labeling Market, By Application, 2020–2033 (USD Billion)
71. UAE Nucleic Acid Labeling Market, By End User, 2020–2033 (USD Billion)
72. South Africa Nucleic Acid Labeling Market, By Product Type, 2020–2033 (USD Billion)
73. South Africa Nucleic Acid Labeling Market, By Application, 2020–2033 (USD Billion)
74. South Africa Nucleic Acid Labeling Market, By End User, 2020–2033 (USD Billion)
List of Figures
1. Global Nucleic Acid Labeling Market Segmentation
2. Nucleic Acid Labeling Market: Research Methodology
3. Market Size Estimation Methodology: Bottom-Up Approach
4. Market Size Estimation Methodology: Top-Down Approach
5. Data Triangulation
6. Porter’s Five Forces Analysis
7. Value Chain Analysis
8. Global Nucleic Acid Labeling Market Attractiveness Analysis By Product Type
9. Global Nucleic Acid Labeling Market Attractiveness Analysis By Application
10. Global Nucleic Acid Labeling Market Attractiveness Analysis By End User
11. Global Nucleic Acid Labeling Market Attractiveness Analysis By Region
12. Global Nucleic Acid Labeling Market: Dynamics
13. Global Nucleic Acid Labeling Market Share By Product Type (2023 & 2033)
14. Global Nucleic Acid Labeling Market Share by Application (2023 & 2033)
15. Global Nucleic Acid Labeling Market Share by End User (2023 & 2033)
16. Global Nucleic Acid Labeling Market Share by Regions (2023 & 2033)
17. Global Nucleic Acid Labeling Market Share by Company (2023)
This study forecasts revenue at global, regional, and country levels from 2020 to 2033. The Brainy Insights has segmented the global Nucleic Acid Labeling market on the basis of below mentioned segments:
Global Nucleic Acid Labeling Market by Product Type:
Global Nucleic Acid Labeling Market by Application:
Global Nucleic Acid Labeling Market by End User:
Global Nucleic Acid Labeling Market by Region:
Research has its special purpose to undertake marketing efficiently. In this competitive scenario, businesses need information across all industry verticals; the information about customer wants, market demand, competition, industry trends, distribution channels etc. This information needs to be updated regularly because businesses operate in a dynamic environment. Our organization, The Brainy Insights incorporates scientific and systematic research procedures in order to get proper market insights and industry analysis for overall business success. The analysis consists of studying the market from a miniscule level wherein we implement statistical tools which helps us in examining the data with accuracy and precision.
Our research reports feature both; quantitative and qualitative aspects for any market. Qualitative information for any market research process are fundamental because they reveal the customer needs and wants, usage and consumption for any product/service related to a specific industry. This in turn aids the marketers/investors in knowing certain perceptions of the customers. Qualitative research can enlighten about the different product concepts and designs along with unique service offering that in turn, helps define marketing problems and generate opportunities. On the other hand, quantitative research engages with the data collection process through interviews, e-mail interactions, surveys and pilot studies. Quantitative aspects for the market research are useful to validate the hypotheses generated during qualitative research method, explore empirical patterns in the data with the help of statistical tools, and finally make the market estimations.
The Brainy Insights offers comprehensive research and analysis, based on a wide assortment of factual insights gained through interviews with CXOs and global experts and secondary data from reliable sources. Our analysts and industry specialist assume vital roles in building up statistical tools and analysis models, which are used to analyse the data and arrive at accurate insights with exceedingly informative research discoveries. The data provided by our organization have proven precious to a diverse range of companies, facilitating them to address issues such as determining which products/services are the most appealing, whether or not customers use the product in the manner anticipated, the purchasing intentions of the market and many others.
Our research methodology encompasses an idyllic combination of primary and secondary initiatives. Key phases involved in this process are listed below:

The phase involves the gathering and collecting of market data and its related information with the help of different sources & research procedures.

The data procurement stage involves in data gathering and collecting through various data sources.
This stage involves in extensive research. These data sources includes:
Purchased Database: Purchased databases play a crucial role in estimating the market sizes irrespective of the domain. Our purchased database includes:
Primary Research: The Brainy Insights interacts with leading companies and experts of the concerned domain to develop the analyst team’s market understanding and expertise. It improves and substantiates every single data presented in the market reports. Primary research mainly involves in telephonic interviews, E-mail interactions and face-to-face interviews with the raw material providers, manufacturers/producers, distributors, & independent consultants. The interviews that we conduct provides valuable data on market size and industry growth trends prevailing in the market. Our organization also conducts surveys with the various industry experts in order to gain overall insights of the industry/market. For instance, in healthcare industry we conduct surveys with the pharmacists, doctors, surgeons and nurses in order to gain insights and key information of a medical product/device/equipment which the customers are going to usage. Surveys are conducted in the form of questionnaire designed by our own analyst team. Surveys plays an important role in primary research because surveys helps us to identify the key target audiences of the market. Additionally, surveys helps to identify the key target audience engaged with the market. Our survey team conducts the survey by targeting the key audience, thus gaining insights from them. Based on the perspectives of the customers, this information is utilized to formulate market strategies. Moreover, market surveys helps us to understand the current competitive situation of the industry. To be precise, our survey process typically involve with the 360 analysis of the market. This analytical process begins by identifying the prospective customers for a product or service related to the market/industry to obtain data on how a product/service could fit into customers’ lives.

Secondary Research: The secondary data sources includes information published by the on-profit organizations such as World bank, WHO, company fillings, investor presentations, annual reports, national government documents, statistical databases, blogs, articles, white papers and others. From the annual report, we analyse a company’s revenue to understand the key segment and market share of that organization in a particular region. We analyse the company websites and adopt the product mapping technique which is important for deriving the segment revenue. In the product mapping method, we select and categorize the products offered by the companies catering to domain specific market, deduce the product revenue for each of the companies so as to get overall estimation of the market size. We also source data and analyses trends based on information received from supply side and demand side intermediaries in the value chain. The supply side denotes the data gathered from supplier, distributor, wholesaler and the demand side illustrates the data gathered from the end customers for respective market domain.

The supply side for a domain specific market is analysed by:
The demand side for the market is estimated through:
In-house Library: Apart from these third-party sources, we have our in-house library of qualitative and quantitative information. Our in-house database includes market data for various industry and domains. These data are updated on regular basis as per the changing market scenario. Our library includes, historic databases, internal audit reports and archives.
Sometimes there are instances where there is no metadata or raw data available for any domain specific market. For those cases, we use our expertise to forecast and estimate the market size in order to generate comprehensive data sets. Our analyst team adopt a robust research technique in order to produce the estimates:
Data Synthesis: This stage involves the analysis & mapping of all the information obtained from the previous step. It also involves in scrutinizing the data for any discrepancy observed while data gathering related to the market. The data is collected with consideration to the heterogeneity of sources. Robust scientific techniques are in place for synthesizing disparate data sets and provide the essential contextual information that can orient market strategies. The Brainy Insights has extensive experience in data synthesis where the data passes through various stages:


Market Deduction & Formulation: The final stage comprises of assigning data points at appropriate market spaces so as to deduce feasible conclusions. Analyst perspective & subject matter expert based holistic form of market sizing coupled with industry analysis also plays a crucial role in this stage.
This stage involves in finalization of the market size and numbers that we have collected from data integration step. With data interpolation, it is made sure that there is no gap in the market data. Successful trend analysis is done by our analysts using extrapolation techniques, which provide the best possible forecasts for the market.
Data Validation & Market Feedback: Validation is the most important step in the process. Validation & re-validation via an intricately designed process helps us finalize data-points to be used for final calculations.

The Brainy Insights interacts with leading companies and experts of the concerned domain to develop the analyst team’s market understanding and expertise. It improves and substantiates every single data presented in the market reports. The data validation interview and discussion panels are typically composed of the most experienced industry members. The participants include, however, are not limited to:
Moreover, we always validate our data and findings through primary respondents from all the major regions we are working on.
Free Customization
Fortune 500 Clients
Free Yearly Update On Purchase Of Multi/Corporate License
Companies Served Till Date