- +1-315-215-1633
- sales@thebrainyinsights.com

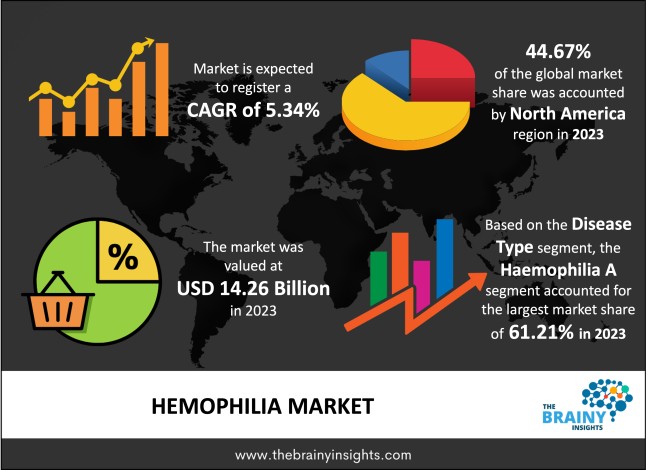
Global haemophilia market is expected to reach USD 23.99 billion by 2033, at a CAGR of 5.34% from 2024 to 2033. Global haemophilia market is witnessing a considerable growth owing to the growing prevalence of haemophilia across the globe. Ongoing improvements and developments have strengthened the healthcare sector, strengthening the healthcare infrastructure even in underdeveloped countries. Older people are more likely to suffer from haemophilia, which requires long-term care and treatment. Better diagnostics techniques are also being used, which diagnose haemophilia very accurately. Due to this, haemophilia can be managed by diagnosing it early and starting treatment at the right time. With the increasing digitalization, wearable technology can be used. With its help, real-time patient monitoring can be done so that changes in treatment can be made as needed.
Haemophilia is considered generally an inherited bleeding disorder in which blood does not clot, or there is a problem in the clotting of blood. This can lead to spontaneous bleeding after a mere cut or bruise and even in the case of surgeries. Blood contains many proteins which are called clotting factors. This clotting factors are responsible for the clotting of blood. People who are suffering from haemophilia are either having low clotting factor VIII or low clotting factor IX. The severity of haemophilia depends on the level of clotting factors in the blood. Lower the level of clotting factors in the blood more will be the bleeding which could lead to serious health problems. In some cases, haemophilia shows symptoms late, or people develop this later in life like middle-aged and elderly person. Women who have just given birth to a child or if she is in the later stage of pregnancy can also show symptoms. Such cases can be cured with proper treatment. People suffering from haemophilia should be careful as bleeding within joints can lead to chronic joint pain and disease, bleeding in the head can lead to seizures and paralysis, bleeding from vital organs can also be fatal if it can’t be stopped and lead to death. There are many types of Haemophilia. The two most common type of haemophilia is Haemophilia A, and Haemophilia B. Heamophilia A happens due to a lack of clotting factor VIII. Haemophilia B happens due to a lack of clotting factor IX. The best way for treatment is to replace the clotting factor. This way, blood start clotting. This replacement is done by infusion of factor concentrates. Currently, over 20,000 males are suffering from haemophila in US. Haemophilia A is four times more common compared to Haemophilia B. Half of the people suffering from Haemophilia are in serious form. According to the World Federation of Hemophilia record, 184,723 people were suffering from haemophilia in 2016.
Get an overview of this study by requesting a free sample
1. Introduction
1.1. Objectives of the Study
1.2. Market Definition
1.3. Research Scope
1.4. Currency
1.5. Key Target Audience
2. Research Methodology and Assumptions
3. Executive Summary
4. Premium Insights
4.1. Porter’s Five Forces Analysis
4.2. Value Chain Analysis
4.3. Top Investment Pockets
4.3.1. Market Attractiveness Analysis By Disease Type
4.3.2. Market Attractiveness Analysis By Therapy
4.3.3. Market Attractiveness Analysis By Product Type
4.3.4. Market Attractiveness Analysis By Region
4.4. Industry Trends
5. Market Dynamics
5.1. Market Evaluation
5.2. Drivers
5.2.1. Growing prevalence of hemophilia across the globe
5.2.2. Increase in R&D and new product development
5.3. Restraints
5.3.1. High cost associated with hemophilia treatment
5.4. Opportunities
5.4.1. Increasing popularity and demand of gene therapy
6. Global Hemophilia Market Analysis and Forecast, By Disease Type
6.1. Segment Overview
6.2. Hemophilia A
6.3. Hemophilia B
6.4. Others
7. Global Hemophilia Market Analysis and Forecast, By Therapy
7.1. Segment Overview
7.2. Replacement Therapy
7.3. Gene Therapy
7.4. Others
8. Global Hemophilia Market Analysis and Forecast, By Product Type
8.1. Segment Overview
8.2. Recombinant coagulation factor concentrates
8.3. Plasma-derived coagulation factor concentrates
8.4. Others
9. Global Hemophilia Market Analysis and Forecast, By Regional Analysis
9.1. Segment Overview
9.2. North America
9.2.1. U.S.
9.2.2. Canada
9.2.3. Mexico
9.3. Europe
9.3.1. Germany
9.3.2. France
9.3.3. U.K.
9.3.4. Italy
9.3.5. Spain
9.4. Asia-Pacific
9.4.1. Japan
9.4.2. China
9.4.3. India
9.5. South America
9.5.1. Brazil
9.6. Middle East and Africa
9.6.1. UAE
9.6.2. South Africa
10. Global Hemophilia Market-Competitive Landscape
10.1. Overview
10.2. Market Share of Key Players in Global Hemophilia Market
10.2.1. Global Company Market Share
10.2.2. North America Company Market Share
10.2.3. Europe Company Market Share
10.2.4. APAC Company Market Share
10.3. Competitive Situations and Trends
10.3.1. Product Launches and Developments
10.3.2. Partnerships, Collaborations, and Agreements
10.3.3. Mergers & Acquisitions
10.3.4. Expansions
11. Company Profiles
11.1. Baxalta
11.1.1. Business Overview
11.1.2. Company Snapshot
11.1.3. Company Market Share Analysis
11.1.4. Company Product Portfolio
11.1.5. Recent Developments
11.1.6. SWOT Analysis
11.2. CSL Behring
11.2.1. Business Overview
11.2.2. Company Snapshot
11.2.3. Company Market Share Analysis
11.2.4. Company Product Portfolio
11.2.5. Recent Developments
11.2.6. SWOT Analysis
11.3. Pfizer, Inc.
11.3.1. Business Overview
11.3.2. Company Snapshot
11.3.3. Company Market Share Analysis
11.3.4. Company Product Portfolio
11.3.5. Recent Developments
11.3.6. SWOT Analysis
11.4. Bayer Healthcare
11.4.1. Business Overview
11.4.2. Company Snapshot
11.4.3. Company Market Share Analysis
11.4.4. Company Product Portfolio
11.4.5. Recent Developments
11.4.6. SWOT Analysis
11.5. BioMarin Pharmaceutical, Inc.
11.5.1. Business Overview
11.5.2. Company Snapshot
11.5.3. Company Market Share Analysis
11.5.4. Company Product Portfolio
11.5.5. Recent Developments
11.5.6. SWOT Analysis
11.6. Biogen
11.6.1. Business Overview
11.6.2. Company Snapshot
11.6.3. Company Market Share Analysis
11.6.4. Company Product Portfolio
11.6.5. Recent Developments
11.6.6. SWOT Analysis
11.7. Chugai Pharmaceutical Co.
11.7.1. Business Overview
11.7.2. Company Snapshot
11.7.3. Company Market Share Analysis
11.7.4. Company Product Portfolio
11.7.5. Recent Developments
11.7.6. SWOT Analysis
11.8. Novo Nordisk
11.8.1. Business Overview
11.8.2. Company Snapshot
11.8.3. Company Market Share Analysis
11.8.4. Company Product Portfolio
11.8.5. Recent Developments
11.8.6. SWOT Analysis
11.9. Shire Plc.
11.9.1. Business Overview
11.9.2. Company Snapshot
11.9.3. Company Market Share Analysis
11.9.4. Company Product Portfolio
11.9.5. Recent Developments
11.9.6. SWOT Analysis
11.10. Baxter International, Inc
11.10.1. Business Overview
11.10.2. Company Snapshot
11.10.3. Company Market Share Analysis
11.10.4. Company Product Portfolio
11.10.5. Recent Developments
11.10.6. SWOT Analysis
11.11. Hospira Inc.
11.11.1. Business Overview
11.11.2. Company Snapshot
11.11.3. Company Market Share Analysis
11.11.4. Company Product Portfolio
11.11.5. Recent Developments
11.11.6. SWOT Analysis
List of Table
1. Global Hemophilia Market, By Disease Type, 2020–2033 (USD Billion)
2. Global Hemophilia A Hemophilia Market, By Region, 2020–2033 (USD Billion)
3. Global Hemophilia B Hemophilia Market, By Region, 2020–2033 (USD Billion)
4. Global Others Hemophilia Market, By Region, 2020–2033 (USD Billion)
5. Global Hemophilia Market, By Therapy, 2020–2033 (USD Billion)
6. Global Replacement Therapy, Hemophilia Market, By Region, 2020–2033 (USD Billion)
7. Global Gene Therapy, Hemophilia Market, By Region, 2020–2033 (USD Billion)
8. Global Others, Hemophilia Market, By Region, 2020–2033 (USD Billion)
9. Global Hemophilia Market, By Product Type, 2020–2033 (USD Billion)
10. Global Recombinant Coagulation Factor Concentrates, Hemophilia Market, By Region, 2020–2033 (USD Billion)
11. Global Plasma-derived Coagulation Factor Concentrates, Hemophilia Market, By Region, 2020–2033 (USD Billion)
12. Global Others, Hemophilia Market, By Region, 2020–2033 (USD Billion)
13. Global Hemophilia Market, By Region, 2020–2033 (USD Billion)
14. Global Hemophilia Market, By North America, 2020–2033 (USD Billion)
15. North America Hemophilia Market, By Disease Type, 2020–2033 (USD Billion)
16. North America Hemophilia Market, By Therapy, 2020–2033 (USD Billion)
17. North America Hemophilia Market, By Product Type, 2020–2033 (USD Billion)
18. U.S. Hemophilia Market, By Disease Type, 2020–2033 (USD Billion)
19. U.S. Hemophilia Market, By Therapy, 2020–2033 (USD Billion)
20. U.S. Hemophilia Market, By Product Type, 2020–2033 (USD Billion)
21. Canada Hemophilia Market, By Disease Type, 2020–2033 (USD Billion)
22. Canada Hemophilia Market, By Therapy, 2020–2033 (USD Billion)
23. Canada Hemophilia Market, By Product Type, 2020–2033 (USD Billion)
24. Mexico Hemophilia Market, By Disease Type, 2020–2033 (USD Billion)
25. Mexico Hemophilia Market, By Therapy, 2020–2033 (USD Billion)
26. Mexico Hemophilia Market, By Product Type, 2020–2033 (USD Billion)
27. Europe Hemophilia Market, By Disease Type, 2020–2033 (USD Billion)
28. Europe Hemophilia Market, By Therapy, 2020–2033 (USD Billion)
29. Europe Hemophilia Market, By Product Type, 2020–2033 (USD Billion)
30. Germany Hemophilia Market, By Disease Type, 2020–2033 (USD Billion)
31. Germany Hemophilia Market, By Therapy, 2020–2033 (USD Billion)
32. Germany Hemophilia Market, By Product Type, 2020–2033 (USD Billion)
33. France Hemophilia Market, By Disease Type, 2020–2033 (USD Billion)
34. France Hemophilia Market, By Therapy, 2020–2033 (USD Billion)
35. France Hemophilia Market, By Product Type, 2020–2033 (USD Billion)
36. U.K. Hemophilia Market, By Disease Type, 2020–2033 (USD Billion)
37. U.K. Hemophilia Market, By Therapy, 2020–2033 (USD Billion)
38. U.K. Hemophilia Market, By Product Type, 2020–2033 (USD Billion)
39. Italy Hemophilia Market, By Disease Type, 2020–2033 (USD Billion)
40. Italy Hemophilia Market, By Therapy, 2020–2033 (USD Billion)
41. Italy Hemophilia Market, By Product Type, 2020–2033 (USD Billion)
42. Spain Hemophilia Market, By Disease Type, 2020–2033 (USD Billion)
43. Spain Hemophilia Market, By Therapy, 2020–2033 (USD Billion)
44. Spain Hemophilia Market, By Product Type, 2020–2033 (USD Billion)
45. Asia Pacific Hemophilia Market, By Disease Type, 2020–2033 (USD Billion)
46. Asia Pacific Hemophilia Market, By Therapy, 2020–2033 (USD Billion)
47. Asia Pacific Hemophilia Market, By Product Type, 2020–2033 (USD Billion)
48. Japan Hemophilia Market, By Disease Type, 2020–2033 (USD Billion)
49. Japan Hemophilia Market, By Therapy, 2020–2033 (USD Billion)
50. Japan Hemophilia Market, By Product Type, 2020–2033 (USD Billion)
51. China Hemophilia Market, By Disease Type, 2020–2033 (USD Billion)
52. China Hemophilia Market, By Therapy, 2020–2033 (USD Billion)
53. China Hemophilia Market, By Product Type, 2020–2033 (USD Billion)
54. India Hemophilia Market, By Disease Type, 2020–2033 (USD Billion)
55. India Hemophilia Market, By Therapy, 2020–2033 (USD Billion)
56. India Hemophilia Market, By Product Type, 2020–2033 (USD Billion)
57. South America Hemophilia Market, By Disease Type, 2020–2033 (USD Billion)
58. South America Hemophilia Market, By Therapy, 2020–2033 (USD Billion)
59. South America Hemophilia Market, By Product Type, 2020–2033 (USD Billion)
60. Brazil Hemophilia Market, By Disease Type, 2020–2033 (USD Billion)
61. Brazil Hemophilia Market, By Therapy, 2020–2033 (USD Billion)
62. Brazil Hemophilia Market, By Product Type, 2020–2033 (USD Billion)
63. Middle East and Africa Hemophilia Market, By Disease Type, 2020–2033 (USD Billion)
64. Middle East and Africa Hemophilia Market, By Therapy, 2020–2033 (USD Billion)
65. Middle East Hemophilia Market, By Product Type, 2020–2033 (USD Billion)
66. UAE Hemophilia Market, By Disease Type, 2020–2033 (USD Billion)
67. UAE Hemophilia Market, By Therapy, 2020–2033 (USD Billion)
68. UAE Hemophilia Market, By Product Type, 2020–2033 (USD Billion)
69. South Africa Hemophilia Market, By Disease Type, 2020–2033 (USD Billion)
70. South Africa Hemophilia Market, By Therapy, 2020–2033 (USD Billion)
71. South Africa Hemophilia Market, By Product Type, 2020–2033 (USD Billion)
List of Figures
1. Global Hemophilia Market Segmentation
2. Hemophilia Market: Research Methodology
3. Market Size Estimation Methodology: Bottom-Up Approach
4. Market Size Estimation Methodology: Top-Down Approach
5. Data Triangulation
6. Porter’s Five Forces Analysis
7. Value Chain Analysis
8. Global Hemophilia Market Attractiveness Analysis By Disease Type
9. Global Hemophilia Market Attractiveness Analysis By Therapy
10. Global Hemophilia Market Attractiveness Analysis By Product Type
11. Global Hemophilia Market Attractiveness Analysis By Region
12. Global Hemophilia Market: Dynamics
13. Global Hemophilia Market Share By Disease Type (2023 & 2033)
14. Global Hemophilia Market Share by Therapy (2023 & 2033)
15. Global Hemophilia Market Share by Product Type (2023 & 2033)
16. Global Hemophilia Market Share by Regions (2023 & 2033)
17. Global Hemophilia Market Share by Company (2023)
This study forecasts revenue at global, regional, and country levels from 2020 to 2033. The Brainy Insights has segmented the global Hemophilia market on the basis of below mentioned segments:
Global Hemophilia Market by Disease Type:
Global Hemophilia Market by Therapy:
Global Hemophilia Market by Product Type:
Global Hemophilia Market by Region:
Research has its special purpose to undertake marketing efficiently. In this competitive scenario, businesses need information across all industry verticals; the information about customer wants, market demand, competition, industry trends, distribution channels etc. This information needs to be updated regularly because businesses operate in a dynamic environment. Our organization, The Brainy Insights incorporates scientific and systematic research procedures in order to get proper market insights and industry analysis for overall business success. The analysis consists of studying the market from a miniscule level wherein we implement statistical tools which helps us in examining the data with accuracy and precision.
Our research reports feature both; quantitative and qualitative aspects for any market. Qualitative information for any market research process are fundamental because they reveal the customer needs and wants, usage and consumption for any product/service related to a specific industry. This in turn aids the marketers/investors in knowing certain perceptions of the customers. Qualitative research can enlighten about the different product concepts and designs along with unique service offering that in turn, helps define marketing problems and generate opportunities. On the other hand, quantitative research engages with the data collection process through interviews, e-mail interactions, surveys and pilot studies. Quantitative aspects for the market research are useful to validate the hypotheses generated during qualitative research method, explore empirical patterns in the data with the help of statistical tools, and finally make the market estimations.
The Brainy Insights offers comprehensive research and analysis, based on a wide assortment of factual insights gained through interviews with CXOs and global experts and secondary data from reliable sources. Our analysts and industry specialist assume vital roles in building up statistical tools and analysis models, which are used to analyse the data and arrive at accurate insights with exceedingly informative research discoveries. The data provided by our organization have proven precious to a diverse range of companies, facilitating them to address issues such as determining which products/services are the most appealing, whether or not customers use the product in the manner anticipated, the purchasing intentions of the market and many others.
Our research methodology encompasses an idyllic combination of primary and secondary initiatives. Key phases involved in this process are listed below:

The phase involves the gathering and collecting of market data and its related information with the help of different sources & research procedures.

The data procurement stage involves in data gathering and collecting through various data sources.
This stage involves in extensive research. These data sources includes:
Purchased Database: Purchased databases play a crucial role in estimating the market sizes irrespective of the domain. Our purchased database includes:
Primary Research: The Brainy Insights interacts with leading companies and experts of the concerned domain to develop the analyst team’s market understanding and expertise. It improves and substantiates every single data presented in the market reports. Primary research mainly involves in telephonic interviews, E-mail interactions and face-to-face interviews with the raw material providers, manufacturers/producers, distributors, & independent consultants. The interviews that we conduct provides valuable data on market size and industry growth trends prevailing in the market. Our organization also conducts surveys with the various industry experts in order to gain overall insights of the industry/market. For instance, in healthcare industry we conduct surveys with the pharmacists, doctors, surgeons and nurses in order to gain insights and key information of a medical product/device/equipment which the customers are going to usage. Surveys are conducted in the form of questionnaire designed by our own analyst team. Surveys plays an important role in primary research because surveys helps us to identify the key target audiences of the market. Additionally, surveys helps to identify the key target audience engaged with the market. Our survey team conducts the survey by targeting the key audience, thus gaining insights from them. Based on the perspectives of the customers, this information is utilized to formulate market strategies. Moreover, market surveys helps us to understand the current competitive situation of the industry. To be precise, our survey process typically involve with the 360 analysis of the market. This analytical process begins by identifying the prospective customers for a product or service related to the market/industry to obtain data on how a product/service could fit into customers’ lives.

Secondary Research: The secondary data sources includes information published by the on-profit organizations such as World bank, WHO, company fillings, investor presentations, annual reports, national government documents, statistical databases, blogs, articles, white papers and others. From the annual report, we analyse a company’s revenue to understand the key segment and market share of that organization in a particular region. We analyse the company websites and adopt the product mapping technique which is important for deriving the segment revenue. In the product mapping method, we select and categorize the products offered by the companies catering to domain specific market, deduce the product revenue for each of the companies so as to get overall estimation of the market size. We also source data and analyses trends based on information received from supply side and demand side intermediaries in the value chain. The supply side denotes the data gathered from supplier, distributor, wholesaler and the demand side illustrates the data gathered from the end customers for respective market domain.

The supply side for a domain specific market is analysed by:
The demand side for the market is estimated through:
In-house Library: Apart from these third-party sources, we have our in-house library of qualitative and quantitative information. Our in-house database includes market data for various industry and domains. These data are updated on regular basis as per the changing market scenario. Our library includes, historic databases, internal audit reports and archives.
Sometimes there are instances where there is no metadata or raw data available for any domain specific market. For those cases, we use our expertise to forecast and estimate the market size in order to generate comprehensive data sets. Our analyst team adopt a robust research technique in order to produce the estimates:
Data Synthesis: This stage involves the analysis & mapping of all the information obtained from the previous step. It also involves in scrutinizing the data for any discrepancy observed while data gathering related to the market. The data is collected with consideration to the heterogeneity of sources. Robust scientific techniques are in place for synthesizing disparate data sets and provide the essential contextual information that can orient market strategies. The Brainy Insights has extensive experience in data synthesis where the data passes through various stages:


Market Deduction & Formulation: The final stage comprises of assigning data points at appropriate market spaces so as to deduce feasible conclusions. Analyst perspective & subject matter expert based holistic form of market sizing coupled with industry analysis also plays a crucial role in this stage.
This stage involves in finalization of the market size and numbers that we have collected from data integration step. With data interpolation, it is made sure that there is no gap in the market data. Successful trend analysis is done by our analysts using extrapolation techniques, which provide the best possible forecasts for the market.
Data Validation & Market Feedback: Validation is the most important step in the process. Validation & re-validation via an intricately designed process helps us finalize data-points to be used for final calculations.

The Brainy Insights interacts with leading companies and experts of the concerned domain to develop the analyst team’s market understanding and expertise. It improves and substantiates every single data presented in the market reports. The data validation interview and discussion panels are typically composed of the most experienced industry members. The participants include, however, are not limited to:
Moreover, we always validate our data and findings through primary respondents from all the major regions we are working on.
Free Customization
Fortune 500 Clients
Free Yearly Update On Purchase Of Multi/Corporate License
Companies Served Till Date