- +1-315-215-1633
- sales@thebrainyinsights.com

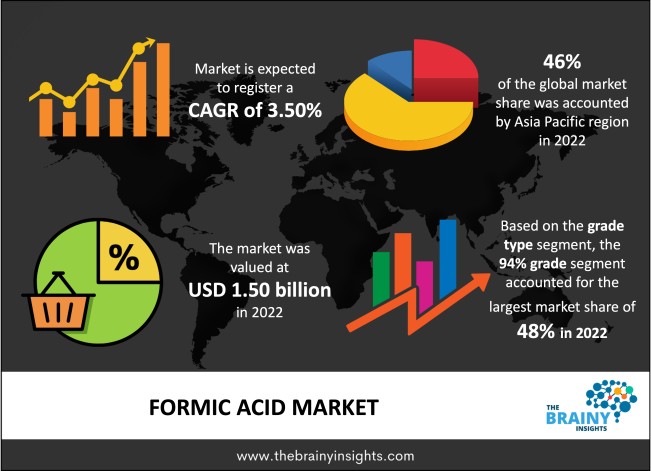
The global formic acid market is expected to grow from USD 1.50 billion in 2022 to USD 2.11 billion by 2032, at a CAGR of 3.50% from 2023-2030. The increasing demand for animal feed from the livestock industry will augment the growth of the global formic acid market.
Formic acid is the common name for methanoic acid, which has the chemical formula CH2O2. Formic acid is the simplest carboxylic acid. It is a colourless liquid with a pungent smell. It is of the acidic family and is corrosive in nature. It is found in nature, especially in the anti or nettle sting. Chemically it is produced as a by-product of acetic acid production. It can also be created through the hydrogenation of carbon dioxide, oxidation of biomass and other laboratory methods. The most known use of formic acid in the chemical industry is its use to produce methanol. Formic acid is also used in silage and animal feed preservation, given its antibacterial and preservative properties. It is used in the dairy sector as well. Formic acid aids in the fuel cells. It can be used in the metallurgy industry for soldering. Other sectors that use formic acid include leather, rubber, textile, food and beverages and pharmaceutical. It is also extensively used in the chemical and industrial sectors. The wide uses and applications of formic acid will propel the market’s growth and offer potential market growth opportunities for the industrial players.
Get an overview of this study by requesting a free sample
February 2022 - An environmental concern on a global scale is climate change. The excessive use of fossil fuels plays a significant role in climate change. Carbon dioxide (CO2), a greenhouse gas that contributes to global warming, is produced by them. In light of this, governments all over the world are developing regulations to reduce such carbon emissions. However, reducing carbon emissions alone might not be sufficient. It's also essential to manage the carbon dioxide produced. In this regard, researchers have proposed chemically transforming CO2 into value-added substances like methanol and formic acid (HCOOH). The latter must be produced from a source of a hydride ion (H-), which is one proton and two electrons in weight. A hydride (H-) generator and reservoir in biological systems is the nicotinamide adenine dinucleotide (NAD+/NADH) reduction-oxidation pair. In light of this, a team of scientists led by Professor Hitoshi Tamiaki from Ritsumeikan University in Japan have now created a novel chemical process that converts CO2 to HCOOH using ruthenium complexes that resemble NAD+/NADH. The researchers are excited by their findings and intend to create a new method of converting sunlight into chemical energy to create fresh, sustainable materials.
1. Introduction
1.1. Objectives of the Study
1.2. Market Definition
1.3. Research Scope
1.4. Currency
1.5. Key Target Audience
2. Research Methodology and Assumptions
3. Executive Summary
4. Premium Insights
4.1. Porter’s Five Forces Analysis
4.2. Value Chain Analysis
4.3. Top Investment Pockets
4.3.1. Market Attractiveness Analysis By Grade Type
4.3.2. Market Attractiveness Analysis By End User
4.3.3. Market Attractiveness Analysis By Region
4.4. Industry Trends
5. Market Dynamics
5.1. Market Evaluation
5.2. Drivers
5.2.1. The increasing demand for formic acid from the agriculture, dairy and livestock sectors of the global economy
5.3. Restraints
5.3.1. There are several health risks associated with formic acid
5.4. Opportunities
5.4.1. The growing end users of formic acid
5.5. Challenges
5.5.1. The stringent regulatory guidelines governing the uses/end users of formic acid
6. Global Formic Acid Market Analysis and Forecast, By Grade Type
6.1. Segment Overview
6.2. 85% Grade
6.3. 94% Grade
6.4. 99% Grade
6.5. Others
7. Global Formic Acid Market Analysis and Forecast, By End User
7.1. Segment Overview
7.2. Silage Additives and Animal Feeds
7.3. Textile Dyeing
7.4. Rubber Chemicals
7.5. Pharmaceutical Intermediate
7.6. Leather and Tanning
7.7. Oil and Gas
7.8. Others
8. Global Formic Acid Market Analysis and Forecast, By Regional Analysis
8.1. Segment Overview
8.2. North America
8.2.1. U.S.
8.2.2. Canada
8.2.3. Mexico
8.3. Europe
8.3.1. Germany
8.3.2. France
8.3.3. U.K.
8.3.4. Italy
8.3.5. Spain
8.4. Asia-Pacific
8.4.1. Japan
8.4.2. China
8.4.3. India
8.5. South America
8.5.1. Brazil
8.6. Middle East and Africa
8.6.1. UAE
8.6.2. South Africa
9. Global Formic Acid Market-Competitive Landscape
9.1. Overview
9.2. Market Share of Key Players in the Formic Acid Market
9.2.1. Global Company Market Share
9.2.2. North America Company Market Share
9.2.3. Europe Company Market Share
9.2.4. APAC Company Market Share
9.3. Competitive Situations and Trends
9.3.1. Product Launches and Developments
9.3.2. Partnerships, Collaborations, and Agreements
9.3.3. Mergers & Acquisitions
9.3.4. Expansions
10. Company Profiles
10.1. BASF SE
10.1.1. Business Overview
10.1.2. Company Snapshot
10.1.3. Company Market Share Analysis
10.1.4. Company Product Portfolio
10.1.5. Recent Developments
10.1.6. SWOT Analysis
10.2. Eastman Chemical Co. Ltd.
10.2.1. Business Overview
10.2.2. Company Snapshot
10.2.3. Company Market Share Analysis
10.2.4. Company Product Portfolio
10.2.5. Recent Developments
10.2.6. SWOT Analysis
10.3. Gujarat Narmada Valley Fertilizers and Chemicals Limited
10.3.1. Business Overview
10.3.2. Company Snapshot
10.3.3. Company Market Share Analysis
10.3.4. Company Product Portfolio
10.3.5. Recent Developments
10.3.6. SWOT Analysis
10.4. Huanghua Pengfa Chemical Co. Ltd.
10.4.1. Business Overview
10.4.2. Company Snapshot
10.4.3. Company Market Share Analysis
10.4.4. Company Product Portfolio
10.4.5. Recent Developments
10.4.6. SWOT Analysis
10.5. LUXI Group
10.5.1. Business Overview
10.5.2. Company Snapshot
10.5.3. Company Market Share Analysis
10.5.4. Company Product Portfolio
10.5.5. Recent Developments
10.5.6. SWOT Analysis
10.6. Mudanjiang Fengda Chemicals Co. Ltd.
10.6.1. Business Overview
10.6.2. Company Snapshot
10.6.3. Company Market Share Analysis
10.6.4. Company Product Portfolio
10.6.5. Recent Developments
10.6.6. SWOT Analysis
10.7. Perstorp
10.7.1. Business Overview
10.7.2. Company Snapshot
10.7.3. Company Market Share Analysis
10.7.4. Company Product Portfolio
10.7.5. Recent Developments
10.7.6. SWOT Analysis
10.8. Rashtriya Chemicals and Fertilizers Limited
10.8.1. Business Overview
10.8.2. Company Snapshot
10.8.3. Company Market Share Analysis
10.8.4. Company Product Portfolio
10.8.5. Recent Developments
10.8.6. SWOT Analysis
10.9. Shandong Feicheng Acid Chemicals Co. Ltd.
10.9.1. Business Overview
10.9.2. Company Snapshot
10.9.3. Company Market Share Analysis
10.9.4. Company Product Portfolio
10.9.5. Recent Developments
10.9.6. SWOT Analysis
10.10. Taminco Corporation
10.10.1. Business Overview
10.10.2. Company Snapshot
10.10.3. Company Market Share Analysis
10.10.4. Company Component Portfolio
10.10.5. Recent Developments
10.10.6. SWOT Analysis
List of Table
1. Global Formic Acid Market, By Grade Type, 2019-2032 (USD Billion)
2. Global 85% Grade Formic Acid Market, By Region, 2019-2032 (USD Billion)
3. Global 94% Grade Formic Acid Market, By Region, 2019-2032 (USD Billion)
4. Global 99% Grade Formic Acid Market, By Region, 2019-2032 (USD Billion)
5. Global Others Formic Acid Market, By Region, 2019-2032 (USD Billion)
6. Global Formic Acid Market, By End User, 2019-2032 (USD Billion)
7. Global Silage Additives and Animal Feeds Formic Acid Market, By Region, 2019-2032 (USD Billion)
8. Global Textile Dyeing Formic Acid Market, By Region, 2019-2032 (USD Billion)
9. Global Rubber Chemicals Formic Acid Market, By Region, 2019-2032 (USD Billion)
10. Global Pharmaceutical Intermediate Formic Acid Market, By Region, 2019-2032 (USD Billion)
11. Global Leather and Tanning Formic Acid Market, By Region, 2019-2032 (USD Billion)
12. Global Oil and Gas Formic Acid Market, By Region, 2019-2032 (USD Billion)
13. Global Others Formic Acid Market, By Region, 2019-2032 (USD Billion)
14. Global Formic Acid Market, By Region, 2019-2032 (USD Billion)
15. North America Formic Acid Market, By Grade Type, 2019-2032 (USD Billion)
16. North America Formic Acid Market, By End User, 2019-2032 (USD Billion)
17. U.S. Formic Acid Market, By Grade Type, 2019-2032 (USD Billion)
18. U.S. Formic Acid Market, By End User, 2019-2032 (USD Billion)
19. Canada Formic Acid Market, By Grade Type, 2019-2032 (USD Billion)
20. Canada Formic Acid Market, By End User, 2019-2032 (USD Billion)
21. Mexico Formic Acid Market, By Grade Type, 2019-2032 (USD Billion)
22. Mexico Formic Acid Market, By End User, 2019-2032 (USD Billion)
23. Europe Formic Acid Market, By Grade Type, 2019-2032 (USD Billion)
24. Europe Formic Acid Market, By End User, 2019-2032 (USD Billion)
25. Germany Formic Acid Market, By Grade Type, 2019-2032 (USD Billion)
26. Germany Formic Acid Market, By End User, 2019-2032 (USD Billion)
27. France Formic Acid Market, By Grade Type, 2019-2032 (USD Billion)
28. France Formic Acid Market, By End User, 2019-2032 (USD Billion)
29. U.K. Formic Acid Market, By Grade Type, 2019-2032 (USD Billion)
30. U.K. Formic Acid Market, By End User, 2019-2032 (USD Billion)
31. Italy Formic Acid Market, By Grade Type, 2019-2032 (USD Billion)
32. Italy Formic Acid Market, By End User, 2019-2032 (USD Billion)
33. Spain Formic Acid Market, By Grade Type, 2019-2032 (USD Billion)
34. Spain Formic Acid Market, By End User, 2019-2032 (USD Billion)
35. Asia Pacific Formic Acid Market, By Grade Type, 2019-2032 (USD Billion)
36. Asia Pacific Formic Acid Market, By End User, 2019-2032 (USD Billion)
37. Japan Formic Acid Market, By Grade Type, 2019-2032 (USD Billion)
38. Japan Formic Acid Market, By End User, 2019-2032 (USD Billion)
39. China Formic Acid Market, By Grade Type, 2019-2032 (USD Billion)
40. China Formic Acid Market, By End User, 2019-2032 (USD Billion)
41. India Formic Acid Market, By Grade Type, 2019-2032 (USD Billion)
42. India Formic Acid Market, By End User, 2019-2032 (USD Billion)
43. South America Formic Acid Market, By Grade Type, 2019-2032 (USD Billion)
44. South America Formic Acid Market, By End User, 2019-2032 (USD Billion)
45. Brazil Formic Acid Market, By Grade Type, 2019-2032 (USD Billion)
46. Brazil Formic Acid Market, By End User, 2019-2032 (USD Billion)
47. Middle East and Africa Formic Acid Market, By Grade Type, 2019-2032 (USD Billion)
48. Middle East and Africa Formic Acid Market, By End User, 2019-2032 (USD Billion)
49. UAE Formic Acid Market, By Grade Type, 2019-2032 (USD Billion)
50. UAE Formic Acid Market, By End User, 2019-2032 (USD Billion)
51. South Africa Formic Acid Market, By Grade Type, 2019-2032 (USD Billion)
52. South Africa Formic Acid Market, By End User, 2019-2032 (USD Billion)
List of Figures
1. Global Formic Acid Market Segmentation
2. Formic Acid Market: Research Methodology
3. Market Size Estimation Methodology: Bottom-Up Approach
4. Market Size Estimation Methodology: Top-Down Approach
5. Data Triangulation
6. Porter’s Five Forces Analysis
7. Value Chain Analysis
8. Global Formic Acid Market Attractiveness Analysis By Grade Type
9. Global Formic Acid Market Attractiveness Analysis By End User
10. Global Formic Acid Market Attractiveness Analysis By Region
11. Global Formic Acid Market: Dynamics
12. Global Formic Acid Market Share by Grade Type (2022 & 2032)
13. Global Formic Acid Market Share by End User (2022 & 2032)
14. Global Formic Acid Market Share by Regions (2022 & 2032)
15. Global Formic Acid Market Share by Company (2022)
This study forecasts revenue at global, regional, and country levels from 2019 to 2032. The Brainy Insights has segmented the formic acid market based on below mentioned segments:
Formic Acid Market by Grade Type:
Formic Acid Market by End User:
Formic Acid Market by Region:
Research has its special purpose to undertake marketing efficiently. In this competitive scenario, businesses need information across all industry verticals; the information about customer wants, market demand, competition, industry trends, distribution channels etc. This information needs to be updated regularly because businesses operate in a dynamic environment. Our organization, The Brainy Insights incorporates scientific and systematic research procedures in order to get proper market insights and industry analysis for overall business success. The analysis consists of studying the market from a miniscule level wherein we implement statistical tools which helps us in examining the data with accuracy and precision.
Our research reports feature both; quantitative and qualitative aspects for any market. Qualitative information for any market research process are fundamental because they reveal the customer needs and wants, usage and consumption for any product/service related to a specific industry. This in turn aids the marketers/investors in knowing certain perceptions of the customers. Qualitative research can enlighten about the different product concepts and designs along with unique service offering that in turn, helps define marketing problems and generate opportunities. On the other hand, quantitative research engages with the data collection process through interviews, e-mail interactions, surveys and pilot studies. Quantitative aspects for the market research are useful to validate the hypotheses generated during qualitative research method, explore empirical patterns in the data with the help of statistical tools, and finally make the market estimations.
The Brainy Insights offers comprehensive research and analysis, based on a wide assortment of factual insights gained through interviews with CXOs and global experts and secondary data from reliable sources. Our analysts and industry specialist assume vital roles in building up statistical tools and analysis models, which are used to analyse the data and arrive at accurate insights with exceedingly informative research discoveries. The data provided by our organization have proven precious to a diverse range of companies, facilitating them to address issues such as determining which products/services are the most appealing, whether or not customers use the product in the manner anticipated, the purchasing intentions of the market and many others.
Our research methodology encompasses an idyllic combination of primary and secondary initiatives. Key phases involved in this process are listed below:

The phase involves the gathering and collecting of market data and its related information with the help of different sources & research procedures.

The data procurement stage involves in data gathering and collecting through various data sources.
This stage involves in extensive research. These data sources includes:
Purchased Database: Purchased databases play a crucial role in estimating the market sizes irrespective of the domain. Our purchased database includes:
Primary Research: The Brainy Insights interacts with leading companies and experts of the concerned domain to develop the analyst team’s market understanding and expertise. It improves and substantiates every single data presented in the market reports. Primary research mainly involves in telephonic interviews, E-mail interactions and face-to-face interviews with the raw material providers, manufacturers/producers, distributors, & independent consultants. The interviews that we conduct provides valuable data on market size and industry growth trends prevailing in the market. Our organization also conducts surveys with the various industry experts in order to gain overall insights of the industry/market. For instance, in healthcare industry we conduct surveys with the pharmacists, doctors, surgeons and nurses in order to gain insights and key information of a medical product/device/equipment which the customers are going to usage. Surveys are conducted in the form of questionnaire designed by our own analyst team. Surveys plays an important role in primary research because surveys helps us to identify the key target audiences of the market. Additionally, surveys helps to identify the key target audience engaged with the market. Our survey team conducts the survey by targeting the key audience, thus gaining insights from them. Based on the perspectives of the customers, this information is utilized to formulate market strategies. Moreover, market surveys helps us to understand the current competitive situation of the industry. To be precise, our survey process typically involve with the 360 analysis of the market. This analytical process begins by identifying the prospective customers for a product or service related to the market/industry to obtain data on how a product/service could fit into customers’ lives.

Secondary Research: The secondary data sources includes information published by the on-profit organizations such as World bank, WHO, company fillings, investor presentations, annual reports, national government documents, statistical databases, blogs, articles, white papers and others. From the annual report, we analyse a company’s revenue to understand the key segment and market share of that organization in a particular region. We analyse the company websites and adopt the product mapping technique which is important for deriving the segment revenue. In the product mapping method, we select and categorize the products offered by the companies catering to domain specific market, deduce the product revenue for each of the companies so as to get overall estimation of the market size. We also source data and analyses trends based on information received from supply side and demand side intermediaries in the value chain. The supply side denotes the data gathered from supplier, distributor, wholesaler and the demand side illustrates the data gathered from the end customers for respective market domain.

The supply side for a domain specific market is analysed by:
The demand side for the market is estimated through:
In-house Library: Apart from these third-party sources, we have our in-house library of qualitative and quantitative information. Our in-house database includes market data for various industry and domains. These data are updated on regular basis as per the changing market scenario. Our library includes, historic databases, internal audit reports and archives.
Sometimes there are instances where there is no metadata or raw data available for any domain specific market. For those cases, we use our expertise to forecast and estimate the market size in order to generate comprehensive data sets. Our analyst team adopt a robust research technique in order to produce the estimates:
Data Synthesis: This stage involves the analysis & mapping of all the information obtained from the previous step. It also involves in scrutinizing the data for any discrepancy observed while data gathering related to the market. The data is collected with consideration to the heterogeneity of sources. Robust scientific techniques are in place for synthesizing disparate data sets and provide the essential contextual information that can orient market strategies. The Brainy Insights has extensive experience in data synthesis where the data passes through various stages:


Market Deduction & Formulation: The final stage comprises of assigning data points at appropriate market spaces so as to deduce feasible conclusions. Analyst perspective & subject matter expert based holistic form of market sizing coupled with industry analysis also plays a crucial role in this stage.
This stage involves in finalization of the market size and numbers that we have collected from data integration step. With data interpolation, it is made sure that there is no gap in the market data. Successful trend analysis is done by our analysts using extrapolation techniques, which provide the best possible forecasts for the market.
Data Validation & Market Feedback: Validation is the most important step in the process. Validation & re-validation via an intricately designed process helps us finalize data-points to be used for final calculations.

The Brainy Insights interacts with leading companies and experts of the concerned domain to develop the analyst team’s market understanding and expertise. It improves and substantiates every single data presented in the market reports. The data validation interview and discussion panels are typically composed of the most experienced industry members. The participants include, however, are not limited to:
Moreover, we always validate our data and findings through primary respondents from all the major regions we are working on.
Free Customization
Fortune 500 Clients
Free Yearly Update On Purchase Of Multi/Corporate License
Companies Served Till Date