- +1-315-215-1633
- sales@thebrainyinsights.com

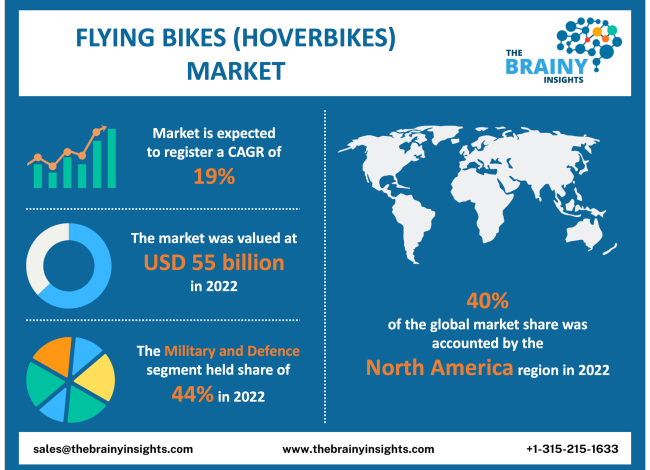
The global flying bikes (hoverbikes) market is expected to grow from USD 55 billion in 2022 to USD 313.20 billion by 2032, at a CAGR of 19% during the forecast period 2023-2032. The increasing demand for flying bikes in defense, urban transportation, and police administration will drive the global flying bikes (hoverbikes) market.
A hoverbike or a flying bike is a similar concept to that of a motorcycle. The principle, functional, and visible difference is that a flying bike hovers above the ground and travels in the atmosphere rather than on the ground. It uses propellers to lift and move from one place to other. Flying bikes or hoverbikes are developed with the reimagination of urban mobility, given the deteriorating global transportation infrastructure. New materials like carbon fiber are used to make it lightweight. Electric propulsion is used to avoid fossil fuel pollution and improve efficiency. Flying bikes or hoverbikes are expected to gather more consumers in the coming years, given their potential uses in several sectors. The defence sector will use it for fast, hassle-free, and efficient transportation of food, fuel, medicines, or weapons. They can also use it for surveillance, rescue, or evacuation in hilly terrain and inaccessible border areas. Similarly, the bikes can be used in emergency transportation, law-and-order maintenance, and other relevant areas. The increasing research and development expenditure by private players, given the prospective market in the future, will drive the global market's growth in the forecast period.
Get an overview of this study by requesting a free sample
January 2023 - While there are still technological and legal obstacles, efforts are being made in Japan to put "flying motorcycles" to use in disaster-affected areas for the transportation of supplies and rescue operations. ALI Technologies Inc., a startup with headquarters in Tokyo, developed the Xturismo hoverbike, and the first unit was shipped out in December 2022. The business created the bike to fly about 3 meters above the ground using six propellers, drawing inspiration from the "Star Wars" film series. It can fly up to about 80 to 100 kph. A public-private council established by the industry and transport ministries has been discussing sky transportation systems and technology since 2018. ALI claims that the entertainment industry, as well as police and firefighting agencies abroad, have frequently been inquiring about its hoverbike. These queries have primarily come from the Middle East and North America, which contain many deserts. The usage of hoverbikes in Japan is now restricted by regulation to areas like the sea, racetracks, and resort facilities. Their mobility is anticipated to be helpful in disaster relief operations in the future. The development of hoverbikes, including their downsizing and complete electrification, is expected to go more quickly.
1. Introduction
1.1. Objectives of the Study
1.2. Market Definition
1.3. Research Scope
1.4. Currency
1.5. Key Target Audience
2. Research Methodology and Assumptions
3. Executive Summary
4. Premium Insights
4.1. Porter’s Five Forces Analysis
4.2. Value Chain Analysis
4.3. Top Investment Pockets
4.3.1. Market Attractiveness Analysis By Application
4.3.2. Market Attractiveness Analysis By Mode of Operation
4.3.3. Market Attractiveness Analysis By Region
4.4. Industry Trends
5. Market Dynamics
5.1. Market Evaluation
5.2. Drivers
5.2.1. The increasing research and development expenditure
5.3. Restraints
5.3.1. High capital costs and expenditure
5.4. Opportunities
5.4.1. Increasing applications or uses of flying bikes
5.5. Challenges
5.5.1. The safety and security concerns are high
6. Global Flying Bikes (Hoverbikes) Drugs Market Analysis and Forecast, By Application
6.1. Segment Overview
6.2. Emergency Services
6.3. Police Administration
6.4. Military And Defence
6.5. Transportation
6.6. Others
7. Global Flying Bikes (Hoverbikes) Drugs Market Analysis and Forecast, By Mode of Operation
7.1. Segment Overview
7.2. Electric
7.3. Hybrid
7.4. Others
8. Global Flying Bikes (Hoverbikes) Drugs Market Analysis and Forecast, By Regional Analysis
8.1. Segment Overview
8.2. North America
8.2.1. U.S.
8.2.2. Canada
8.2.3. Mexico
8.3. Europe
8.3.1. Germany
8.3.2. France
8.3.3. U.K.
8.3.4. Italy
8.3.5. Spain
8.4. Asia-Pacific
8.4.1. Japan
8.4.2. China
8.4.3. India
8.5. South America
8.5.1. Brazil
8.6. Middle East and Africa
8.6.1. UAE
8.6.2. South Africa
9. Global Flying Bikes (Hoverbikes) Drugs Market-Competitive Landscape
9.1. Overview
9.2. Market Share of Key Players in the Flying Bikes (Hoverbikes) Drugs Market
9.2.1. Global Company Market Share
9.2.2. North America Company Market Share
9.2.3. Europe Company Market Share
9.2.4. APAC Company Market Share
9.3. Competitive Situations and Trends
9.3.1. Product Launches and Developments
9.3.2. Partnerships, Collaborations, and Agreements
9.3.3. Mergers & Acquisitions
9.3.4. Expansions
10. Company Profiles
10.1. Aerofex Corporation
10.1.1. Business Overview
10.1.2. Company Snapshot
10.1.3. Company Market Share Analysis
10.1.4. Company Product Portfolio
10.1.5. Recent Developments
10.1.6. SWOT Analysis
10.2. ALI Technologies
10.2.1. Business Overview
10.2.2. Company Snapshot
10.2.3. Company Market Share Analysis
10.2.4. Company Product Portfolio
10.2.5. Recent Developments
10.2.6. SWOT Analysis
10.3. BMW Motorrad
10.3.1. Business Overview
10.3.2. Company Snapshot
10.3.3. Company Market Share Analysis
10.3.4. Company Product Portfolio
10.3.5. Recent Developments
10.3.6. SWOT Analysis
10.4. Honeywell
10.4.1. Business Overview
10.4.2. Company Snapshot
10.4.3. Company Market Share Analysis
10.4.4. Company Product Portfolio
10.4.5. Recent Developments
10.4.6. SWOT Analysis
10.5. Jetpack Aviation
10.5.1. Business Overview
10.5.2. Company Snapshot
10.5.3. Company Market Share Analysis
10.5.4. Company Product Portfolio
10.5.5. Recent Developments
10.5.6. SWOT Analysis
10.6. Kalashnikov Concern JSC
10.6.1. Business Overview
10.6.2. Company Snapshot
10.6.3. Company Market Share Analysis
10.6.4. Company Product Portfolio
10.6.5. Recent Developments
10.6.6. SWOT Analysis
10.7. Lazareth Auto-Moto
10.7.1. Business Overview
10.7.2. Company Snapshot
10.7.3. Company Market Share Analysis
10.7.4. Company Product Portfolio
10.7.5. Recent Developments
10.7.6. SWOT Analysis
10.8. Malloy Aeronautics
10.8.1. Business Overview
10.8.2. Company Snapshot
10.8.3. Company Market Share Analysis
10.8.4. Company Product Portfolio
10.8.5. Recent Developments
10.8.6. SWOT Analysis
10.9. Northrop Grumman
10.9.1. Business Overview
10.9.2. Company Snapshot
10.9.3. Company Market Share Analysis
10.9.4. Company Product Portfolio
10.9.5. Recent Developments
10.9.6. SWOT Analysis
10.10. Thales
10.10.1. Business Overview
10.10.2. Company Snapshot
10.10.3. Company Market Share Analysis
10.10.4. Company Component Portfolio
10.10.5. Recent Developments
10.10.6. SWOT Analysis
List of Table
1. Global Flying Bikes (Hoverbikes) Drugs Market, By Application, 2019-2032 (USD Billion)
2. Global Emergency Services Flying Bikes (Hoverbikes) Drugs Market, By Region, 2019-2032 (USD Billion)
3. Global Police Administration Flying Bikes (Hoverbikes) Drugs Market, By Region, 2019-2032 (USD Billion)
4. Global Military and Defense Flying Bikes (Hoverbikes) Drugs Market, By Region, 2019-2032 (USD Billion)
5. Global Transportation Flying Bikes (Hoverbikes) Drugs Market, By Region, 2019-2032 (USD Billion)
6. Global Others Flying Bikes (Hoverbikes) Drugs Market, By Region, 2019-2032 (USD Billion)
7. Global Flying Bikes (Hoverbikes) Drugs Market, By Mode of Operation, 2019-2032 (USD Billion)
8. Global Electric Flying Bikes (Hoverbikes) Drugs Market, By Region, 2019-2032 (USD Billion)
9. Global Hybrid Flying Bikes (Hoverbikes) Drugs Market, By Region, 2019-2032 (USD Billion)
10. Global Others Flying Bikes (Hoverbikes) Drugs Market, By Region, 2019-2032 (USD Billion)
11. Global Flying Bikes (Hoverbikes) Drugs Market, By Region, 2019-2032 (USD Billion)
12. North America Flying Bikes (Hoverbikes) Drugs Market, By Application, 2019-2032 (USD Billion)
13. North America Flying Bikes (Hoverbikes) Drugs Market, By Mode of Operation, 2019-2032 (USD Billion)
14. U.S. Flying Bikes (Hoverbikes) Drugs Market, By Application, 2019-2032 (USD Billion)
15. U.S. Flying Bikes (Hoverbikes) Drugs Market, By Mode of Operation, 2019-2032 (USD Billion)
16. Canada Flying Bikes (Hoverbikes) Drugs Market, By Application, 2019-2032 (USD Billion)
17. Canada Flying Bikes (Hoverbikes) Drugs Market, By Mode of Operation, 2019-2032 (USD Billion)
18. Mexico Flying Bikes (Hoverbikes) Drugs Market, By Application, 2019-2032 (USD Billion)
19. Mexico Flying Bikes (Hoverbikes) Drugs Market, By Mode of Operation, 2019-2032 (USD Billion)
20. Europe Flying Bikes (Hoverbikes) Drugs Market, By Application, 2019-2032 (USD Billion)
21. Europe Flying Bikes (Hoverbikes) Drugs Market, By Mode of Operation, 2019-2032 (USD Billion)
22. Germany Flying Bikes (Hoverbikes) Drugs Market, By Application, 2019-2032 (USD Billion)
23. Germany Flying Bikes (Hoverbikes) Drugs Market, By Mode of Operation, 2019-2032 (USD Billion)
24. France Flying Bikes (Hoverbikes) Drugs Market, By Application, 2019-2032 (USD Billion)
25. France Flying Bikes (Hoverbikes) Drugs Market, By Mode of Operation, 2019-2032 (USD Billion)
26. U.K. Flying Bikes (Hoverbikes) Drugs Market, By Application, 2019-2032 (USD Billion)
27. U.K. Flying Bikes (Hoverbikes) Drugs Market, By Mode of Operation, 2019-2032 (USD Billion)
28. Italy Flying Bikes (Hoverbikes) Drugs Market, By Application, 2019-2032 (USD Billion)
29. Italy Flying Bikes (Hoverbikes) Drugs Market, By Mode of Operation, 2019-2032 (USD Billion)
30. Spain Flying Bikes (Hoverbikes) Drugs Market, By Application, 2019-2032 (USD Billion)
31. Spain Flying Bikes (Hoverbikes) Drugs Market, By Mode of Operation, 2019-2032 (USD Billion)
32. Asia Pacific Flying Bikes (Hoverbikes) Drugs Market, By Application, 2019-2032 (USD Billion)
33. Asia Pacific Flying Bikes (Hoverbikes) Drugs Market, By Mode of Operation, 2019-2032 (USD Billion)
34. Japan Flying Bikes (Hoverbikes) Drugs Market, By Application, 2019-2032 (USD Billion)
35. Japan Flying Bikes (Hoverbikes) Drugs Market, By Mode of Operation, 2019-2032 (USD Billion)
36. China Flying Bikes (Hoverbikes) Drugs Market, By Application, 2019-2032 (USD Billion)
37. China Flying Bikes (Hoverbikes) Drugs Market, By Mode of Operation, 2019-2032 (USD Billion)
38. India Flying Bikes (Hoverbikes) Drugs Market, By Application, 2019-2032 (USD Billion)
39. India Flying Bikes (Hoverbikes) Drugs Market, By Mode of Operation, 2019-2032 (USD Billion)
40. South America Flying Bikes (Hoverbikes) Drugs Market, By Application, 2019-2032 (USD Billion)
41. South America Flying Bikes (Hoverbikes) Drugs Market, By Mode of Operation, 2019-2032 (USD Billion)
42. Brazil Flying Bikes (Hoverbikes) Drugs Market, By Application, 2019-2032 (USD Billion)
43. Brazil Flying Bikes (Hoverbikes) Drugs Market, By Mode of Operation, 2019-2032 (USD Billion)
44. Middle East and Africa Flying Bikes (Hoverbikes) Drugs Market, By Application, 2019-2032 (USD Billion)
45. Middle East and Africa Flying Bikes (Hoverbikes) Drugs Market, By Mode of Operation, 2019-2032 (USD Billion)
46. UAE Flying Bikes (Hoverbikes) Drugs Market, By Application, 2019-2032 (USD Billion)
47. UAE Flying Bikes (Hoverbikes) Drugs Market, By Mode of Operation, 2019-2032 (USD Billion)
48. South Africa Flying Bikes (Hoverbikes) Drugs Market, By Application, 2019-2032 (USD Billion)
49. South Africa Flying Bikes (Hoverbikes) Drugs Market, By Mode of Operation, 2019-2032 (USD Billion)
List of Figures
1. Global Flying Bikes (Hoverbikes) Drugs Market Segmentation
2. Flying Bikes (Hoverbikes) Drugs Market: Research Methodology
3. Market Size Estimation Methodology: Bottom-Up Approach
4. Market Size Estimation Methodology: Top-Down Approach
5. Data Triangulation
6. Porter’s Five Forces Analysis
7. Value Chain Analysis
8. Global Flying Bikes (Hoverbikes) Drugs Market Attractiveness Analysis By Application
9. Global Flying Bikes (Hoverbikes) Drugs Market Attractiveness Analysis By Mode of Operation
10. Global Flying Bikes (Hoverbikes) Drugs Market Attractiveness Analysis By Region
11. Global Flying Bikes (Hoverbikes) Drugs Market: Dynamics
12. Global Flying Bikes (Hoverbikes) Drugs Market Share by Application (2022 & 2032)
13. Global Flying Bikes (Hoverbikes) Drugs Market Share by Mode of Operation (2022 & 2032)
14. Global Flying Bikes (Hoverbikes) Drugs Market Share by Regions (2022 & 2032)
15. Global Flying Bikes (Hoverbikes) Drugs Market Share by Company (2021)
This study forecasts revenue at global, regional, and country levels from 2019 to 2032. The Brainy Insights has segmented the flying bikes (hoverbikes) market based on below mentioned segments:
Flying Bikes (Hoverbikes) Market by Application:
Flying Bikes (Hoverbikes) Market by Mode of Operation:
Flying Bikes (Hoverbikes) Market by Region:
Research has its special purpose to undertake marketing efficiently. In this competitive scenario, businesses need information across all industry verticals; the information about customer wants, market demand, competition, industry trends, distribution channels etc. This information needs to be updated regularly because businesses operate in a dynamic environment. Our organization, The Brainy Insights incorporates scientific and systematic research procedures in order to get proper market insights and industry analysis for overall business success. The analysis consists of studying the market from a miniscule level wherein we implement statistical tools which helps us in examining the data with accuracy and precision.
Our research reports feature both; quantitative and qualitative aspects for any market. Qualitative information for any market research process are fundamental because they reveal the customer needs and wants, usage and consumption for any product/service related to a specific industry. This in turn aids the marketers/investors in knowing certain perceptions of the customers. Qualitative research can enlighten about the different product concepts and designs along with unique service offering that in turn, helps define marketing problems and generate opportunities. On the other hand, quantitative research engages with the data collection process through interviews, e-mail interactions, surveys and pilot studies. Quantitative aspects for the market research are useful to validate the hypotheses generated during qualitative research method, explore empirical patterns in the data with the help of statistical tools, and finally make the market estimations.
The Brainy Insights offers comprehensive research and analysis, based on a wide assortment of factual insights gained through interviews with CXOs and global experts and secondary data from reliable sources. Our analysts and industry specialist assume vital roles in building up statistical tools and analysis models, which are used to analyse the data and arrive at accurate insights with exceedingly informative research discoveries. The data provided by our organization have proven precious to a diverse range of companies, facilitating them to address issues such as determining which products/services are the most appealing, whether or not customers use the product in the manner anticipated, the purchasing intentions of the market and many others.
Our research methodology encompasses an idyllic combination of primary and secondary initiatives. Key phases involved in this process are listed below:

The phase involves the gathering and collecting of market data and its related information with the help of different sources & research procedures.

The data procurement stage involves in data gathering and collecting through various data sources.
This stage involves in extensive research. These data sources includes:
Purchased Database: Purchased databases play a crucial role in estimating the market sizes irrespective of the domain. Our purchased database includes:
Primary Research: The Brainy Insights interacts with leading companies and experts of the concerned domain to develop the analyst team’s market understanding and expertise. It improves and substantiates every single data presented in the market reports. Primary research mainly involves in telephonic interviews, E-mail interactions and face-to-face interviews with the raw material providers, manufacturers/producers, distributors, & independent consultants. The interviews that we conduct provides valuable data on market size and industry growth trends prevailing in the market. Our organization also conducts surveys with the various industry experts in order to gain overall insights of the industry/market. For instance, in healthcare industry we conduct surveys with the pharmacists, doctors, surgeons and nurses in order to gain insights and key information of a medical product/device/equipment which the customers are going to usage. Surveys are conducted in the form of questionnaire designed by our own analyst team. Surveys plays an important role in primary research because surveys helps us to identify the key target audiences of the market. Additionally, surveys helps to identify the key target audience engaged with the market. Our survey team conducts the survey by targeting the key audience, thus gaining insights from them. Based on the perspectives of the customers, this information is utilized to formulate market strategies. Moreover, market surveys helps us to understand the current competitive situation of the industry. To be precise, our survey process typically involve with the 360 analysis of the market. This analytical process begins by identifying the prospective customers for a product or service related to the market/industry to obtain data on how a product/service could fit into customers’ lives.

Secondary Research: The secondary data sources includes information published by the on-profit organizations such as World bank, WHO, company fillings, investor presentations, annual reports, national government documents, statistical databases, blogs, articles, white papers and others. From the annual report, we analyse a company’s revenue to understand the key segment and market share of that organization in a particular region. We analyse the company websites and adopt the product mapping technique which is important for deriving the segment revenue. In the product mapping method, we select and categorize the products offered by the companies catering to domain specific market, deduce the product revenue for each of the companies so as to get overall estimation of the market size. We also source data and analyses trends based on information received from supply side and demand side intermediaries in the value chain. The supply side denotes the data gathered from supplier, distributor, wholesaler and the demand side illustrates the data gathered from the end customers for respective market domain.

The supply side for a domain specific market is analysed by:
The demand side for the market is estimated through:
In-house Library: Apart from these third-party sources, we have our in-house library of qualitative and quantitative information. Our in-house database includes market data for various industry and domains. These data are updated on regular basis as per the changing market scenario. Our library includes, historic databases, internal audit reports and archives.
Sometimes there are instances where there is no metadata or raw data available for any domain specific market. For those cases, we use our expertise to forecast and estimate the market size in order to generate comprehensive data sets. Our analyst team adopt a robust research technique in order to produce the estimates:
Data Synthesis: This stage involves the analysis & mapping of all the information obtained from the previous step. It also involves in scrutinizing the data for any discrepancy observed while data gathering related to the market. The data is collected with consideration to the heterogeneity of sources. Robust scientific techniques are in place for synthesizing disparate data sets and provide the essential contextual information that can orient market strategies. The Brainy Insights has extensive experience in data synthesis where the data passes through various stages:


Market Deduction & Formulation: The final stage comprises of assigning data points at appropriate market spaces so as to deduce feasible conclusions. Analyst perspective & subject matter expert based holistic form of market sizing coupled with industry analysis also plays a crucial role in this stage.
This stage involves in finalization of the market size and numbers that we have collected from data integration step. With data interpolation, it is made sure that there is no gap in the market data. Successful trend analysis is done by our analysts using extrapolation techniques, which provide the best possible forecasts for the market.
Data Validation & Market Feedback: Validation is the most important step in the process. Validation & re-validation via an intricately designed process helps us finalize data-points to be used for final calculations.

The Brainy Insights interacts with leading companies and experts of the concerned domain to develop the analyst team’s market understanding and expertise. It improves and substantiates every single data presented in the market reports. The data validation interview and discussion panels are typically composed of the most experienced industry members. The participants include, however, are not limited to:
Moreover, we always validate our data and findings through primary respondents from all the major regions we are working on.
Free Customization
Fortune 500 Clients
Free Yearly Update On Purchase Of Multi/Corporate License
Companies Served Till Date