- +1-315-215-1633
- sales@thebrainyinsights.com

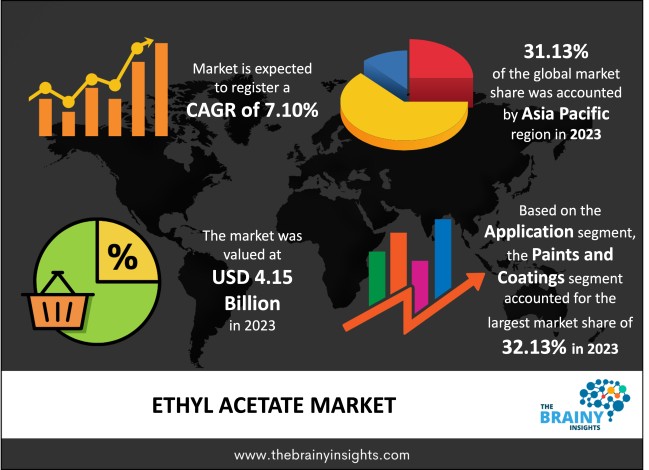
Global ethyl acetate market is anticipated to reach USD 8.25 billion by 2033, at a CAGR of 7.10% from 2024 to 2033. Global Ethyl acetate market is witnessing a considerable growth owing to the high demand in major end-user industries and demand from the flexible packaging industry. Ethyl acetate is used in the pharmaceutical industry to purify active drug ingredients. Its demand has also increased due to increasing investments in the healthcare industry. Ethyl Acetate is also used in the food and beverage industry as an additive and flavour enhancer. This is because the consumption of processed food and beverage products is increasing.
Ethyl Acetate which is also known as ethyl ethanoate, is a chemical compound having formula C4H8O2. It is a clear, colourless liquid having fruity odour. Its density is lesser than water, and its vapour is heavier than air. Ethyl alcohol is very commonly found in alcoholic beverages. One can also found Ethyl Acetate in fruit juices, radishes, cereal crops, spirits etc. They are produced by Rubus Species and Anthemis nobilis plants. Ethyl Acetate market will continue to grow because of its varied application in different business segment. They are used in providing the essence of fruits like banana, pineapple, strawberries etc. and therefore in great demand by the food & beverage industry. It is broadly used as a solvent in the production of Hop extracts and also used in the extraction of tobacco form cigarettes, decaffeinated tea or coffee. They are widely used by coating industries for wooden furniture, construction, mining and marine equipment. It is also required in agriculture. As a high purity solvent, they are used in the formulation of nail polish remover, and for cleaning electric circuit boards. At lower purity level, they are in great demand by printing, pharmaceuticals and food industries. They are also used in perfume and extraction solvent for herbicides. In wine, it is produced naturally because of the fermentation process. They are also in demand from synthetic leather manufactures and are used in making belts, purses, leather bags etc. It is in great demand from many end-user industries like cosmetic Industry, printing industry, electronic item industry. There is an increase in disposable income of the people in developed and developing countries. This factor has changed the lifestyle of the people and given them the access to high-quality products. This factor has increased the sales of cosmetic products. Food & Beverage industries are also expanding because of this factor. This, in turn, is driving the Ethyl Acetate market. The alcoholic beverages have also become widely popular in the celebration parties and for networking. Such factor is also driving the market. Ethyl Acetate can also be used in the paint and coating industry, which will also increase the future demand of this market.
Get an overview of this study by requesting a free sample
1. Introduction
1.1. Objectives of the Study
1.2. Market Definition
1.3. Research Scope
1.4. Currency
1.5. Key Target Audience
2. Research Methodology and Assumptions
3. Executive Summary
4. Premium Insights
4.1. Porter’s Five Forces Analysis
4.2. Value Chain Analysis
4.3. Top Investment Pockets
4.3.1. Market Attractiveness Analysis By Application
4.3.2. Market Attractiveness Analysis By End User
4.3.3. Market Attractiveness Analysis By Region
4.4. Industry Trends
5. Market Dynamics
5.1. Market Evaluation
5.2. Drivers
5.2.1. The high demand in major end-user industries
5.2.2. Demand from the flexible packaging industry
5.3. Restrains
5.3.1. Health related concern
5.4. Opportunities
5.4.1. Disposable income in emerging economies
6. Global Ethyl Acetate Market Analysis and Forecast, By Application
6.1. Segment Overview
6.2. Adhesives and Sealants
6.3. Paints and Coatings
6.4. Pigments
6.5. Process Solvents
6.6. Intermediates
6.7. Others
7. Global Ethyl Acetate Market Analysis and Forecast, By End User
7.1. Segment Overview
7.2. Food and Beverage
7.3. Pharmaceuticals
7.4. Automotive
7.5. Artificial Leather
7.6. Packaging
7.7. Others
8. Global Ethyl Acetate Market Analysis and Forecast, By Regional Analysis
8.1. Segment Overview
8.2. North America
8.2.1. U.S.
8.2.2. Canada
8.2.3. Mexico
8.3. Europe
8.3.1. Germany
8.3.2. France
8.3.3. U.K.
8.3.4. Italy
8.3.5. Spain
8.4. Asia-Pacific
8.4.1. Japan
8.4.2. China
8.4.3. India
8.5. South America
8.5.1. Brazil
8.6. Middle East and Africa
8.6.1. UAE
8.6.2. South Africa
9. Global Ethyl Acetate Market-Competitive Landscape
9.1. Overview
9.2. Market Share of Key Players in Global Ethyl Acetate Market
9.2.1. Global Company Market Share
9.2.2. North America Company Market Share
9.2.3. Europe Company Market Share
9.2.4. APAC Company Market Share
9.3. Competitive Situations and Trends
9.3.1. Product Launches and Developments
9.3.2. Partnerships, Collaborations, and Agreements
9.3.3. Mergers & Acquisitions
9.3.4. Expansions
10. Company Profiles
10.1. Celanese Corporation
10.1.1. Business Overview
10.1.2. Company Snapshot
10.1.3. Company Market Share Analysis
10.1.4. Company Product Portfolio
10.1.5. Recent Developments
10.1.6. SWOT Analysis
10.2. INEOS
10.2.1. Business Overview
10.2.2. Company Snapshot
10.2.3. Company Market Share Analysis
10.2.4. Company Product Portfolio
10.2.5. Recent Developments
10.2.6. SWOT Analysis
10.3. Eastman Chemical Company
10.3.1. Business Overview
10.3.2. Company Snapshot
10.3.3. Company Market Share Analysis
10.3.4. Company Product Portfolio
10.3.5. Recent Developments
10.3.6. SWOT Analysis
10.4. Solvay S.A.
10.4.1. Business Overview
10.4.2. Company Snapshot
10.4.3. Company Market Share Analysis
10.4.4. Company Product Portfolio
10.4.5. Recent Developments
10.4.6. SWOT Analysis
10.5. Jiangsu Sopo (Group) Co., Ltd.
10.5.1. Business Overview
10.5.2. Company Snapshot
10.5.3. Company Market Share Analysis
10.5.4. Company Product Portfolio
10.5.5. Recent Developments
10.5.6. SWOT Analysis
10.6. Sigma-Aldrich Corp
10.6.1. Business Overview
10.6.2. Company Snapshot
10.6.3. Company Market Share Analysis
10.6.4. Company Product Portfolio
10.6.5. Recent Developments
10.6.6. SWOT Analysis
10.7. Jubilant Life Science Ltd.
10.7.1. Business Overview
10.7.2. Company Snapshot
10.7.3. Company Market Share Analysis
10.7.4. Company Product Portfolio
10.7.5. Recent Developments
10.7.6. SWOT Analysis
10.8. Jinyimeng Group Co. Ltd
10.8.1. Business Overview
10.8.2. Company Snapshot
10.8.3. Company Market Share Analysis
10.8.4. Company Product Portfolio
10.8.5. Recent Developments
10.8.6. SWOT Analysis
10.9. Daicel Corporation
10.9.1. Business Overview
10.9.2. Company Snapshot
10.9.3. Company Market Share Analysis
10.9.4. Company Product Portfolio
10.9.5. Recent Developments
10.9.6. SWOT Analysis
10.10. Sasol
10.10.1. Business Overview
10.10.2. Company Snapshot
10.10.3. Company Market Share Analysis
10.10.4. Company Product Portfolio
10.10.5. Recent Developments
10.10.6. SWOT Analysis
10.11. Sipchem
10.11.1. Business Overview
10.11.2. Company Snapshot
10.11.3. Company Market Share Analysis
10.11.4. Company Product Portfolio
10.11.5. Recent Developments
10.11.6. SWOT Analysis
10.12. Linde plc
10.12.1. Business Overview
10.12.2. Company Snapshot
10.12.3. Company Market Share Analysis
10.12.4. Company Product Portfolio
10.12.5. Recent Developments
10.12.6. SWOT Analysis
10.13. Yip Chemical Holdings Limited
10.13.1. Business Overview
10.13.2. Company Snapshot
10.13.3. Company Market Share Analysis
10.13.4. Company Product Portfolio
10.13.5. Recent Developments
10.13.6. SWOT Analysis
List of Table
1. Global Ethyl Acetate Market, By Application, 2020–2033(USD Billion)(M MT)
2. Global Adhesives and Sealants, Ethyl Acetate Market, By Region, 2020–2033(USD Billion)(M MT)
3. Global Paints and Coatings, Ethyl Acetate Market, By Region, 2020–2033(USD Billion)(M MT)
4. Global Pigments, Ethyl Acetate Market, By Region, 2020–2033(USD Billion)(M MT)
5. Global Process Solvents, Ethyl Acetate Market, By Region, 2020–2033(USD Billion)(M MT)
6. Global Intermediates, Ethyl Acetate Market, By Region, 2020–2033(USD Billion)(M MT)
7. Global Others, Ethyl Acetate Market, By Region, 2020–2033(USD Billion)(M MT)
8. Global Ethyl Acetate Market, By End User, 2020–2033(USD Billion)(M MT)
9. Global Food and Beverage Ethyl Acetate Market, By Region, 2020–2033(USD Billion)(M MT)
10. Global Pharmaceuticals Ethyl Acetate Market, By Region, 2020–2033(USD Billion)(M MT)
11. Global Automotive Ethyl Acetate Market, By Region, 2020–2033(USD Billion)(M MT)
12. Global Artificial Leather Ethyl Acetate Market, By Region, 2020–2033(USD Billion)(M MT)
13. Global Packaging Ethyl Acetate Market, By Region, 2020–2033(USD Billion)(M MT)
14. Global Others Ethyl Acetate Market, By Region, 2020–2033(USD Billion)(M MT)
15. Global Ethyl Acetate Market, By Region, 2020–2033(USD Billion)(M MT)
16. Global Ethyl Acetate Market, By North America, 2020–2033(USD Billion)(M MT)
17. North America Ethyl Acetate Market, By Application, 2020–2033(USD Billion)(M MT)
18. North America Ethyl Acetate Market, By End User, 2020–2033(USD Billion)(M MT)
19. U.S. Ethyl Acetate Market, By Application, 2020–2033(USD Billion)(M MT)
20. U.S. Ethyl Acetate Market, By End User, 2020–2033(USD Billion)(M MT)
21. Canada Ethyl Acetate Market, By Application, 2020–2033(USD Billion)(M MT)
22. Canada Ethyl Acetate Market, By End User, 2020–2033(USD Billion)(M MT)
23. Mexico Ethyl Acetate Market, By Application, 2020–2033(USD Billion)(M MT)
24. Mexico Ethyl Acetate Market, By End User, 2020–2033(USD Billion)(M MT)
25. Europe Ethyl Acetate Market, By Application, 2020–2033(USD Billion)(M MT)
26. Europe Ethyl Acetate Market, By End User, 2020–2033(USD Billion)(M MT)
27. Germany Ethyl Acetate Market, By Application, 2020–2033(USD Billion)(M MT)
28. Germany Ethyl Acetate Market, By End User, 2020–2033(USD Billion)(M MT)
29. France Ethyl Acetate Market, By Application, 2020–2033(USD Billion)(M MT)
30. France Ethyl Acetate Market, By End User, 2020–2033(USD Billion)(M MT)
31. U.K. Ethyl Acetate Market, By Application, 2020–2033(USD Billion)(M MT)
32. U.K. Ethyl Acetate Market, By End User, 2020–2033(USD Billion)(M MT)
33. Italy Ethyl Acetate Market, By Application, 2020–2033(USD Billion)(M MT)
34. Italy Ethyl Acetate Market, By End User, 2020–2033(USD Billion)(M MT)
35. Spain Ethyl Acetate Market, By Application, 2020–2033(USD Billion)(M MT)
36. Spain Ethyl Acetate Market, By End User, 2020–2033(USD Billion)(M MT)
37. Asia Pacific Ethyl Acetate Market, By Application, 2020–2033(USD Billion)(M MT)
38. Asia Pacific Ethyl Acetate Market, By End User, 2020–2033(USD Billion)(M MT)
39. Japan Ethyl Acetate Market, By Application, 2020–2033(USD Billion)(M MT)
40. Japan Ethyl Acetate Market, By End User, 2020–2033(USD Billion)(M MT)
41. China Ethyl Acetate Market, By Application, 2020–2033(USD Billion)(M MT)
42. China Ethyl Acetate Market, By End User, 2020–2033(USD Billion)(M MT)
43. India Ethyl Acetate Market, By Application, 2020–2033(USD Billion)(M MT)
44. India Ethyl Acetate Market, By End User, 2020–2033(USD Billion)(M MT)
45. South America Ethyl Acetate Market, By Application, 2020–2033(USD Billion)(M MT)
46. South America Ethyl Acetate Market, By End User, 2020–2033(USD Billion)(M MT)
47. Brazil Ethyl Acetate Market, By Application, 2020–2033(USD Billion)(M MT)
48. Brazil Ethyl Acetate Market, By End User, 2020–2033(USD Billion)(M MT)
49. Middle East and Africa Ethyl Acetate Market, By Application, 2020–2033(USD Billion)(M MT)
50. Middle East and Africa Ethyl Acetate Market, By End User, 2020–2033(USD Billion)(M MT)
51. UAE Ethyl Acetate Market, By Application, 2020–2033(USD Billion)(M MT)
52. UAE Ethyl Acetate Market, By End User, 2020–2033(USD Billion)(M MT)
53. South Africa Ethyl Acetate Market, By Application, 2020–2033(USD Billion)(M MT)
54. South Africa Ethyl Acetate Market, By End User, 2020–2033(USD Billion)(M MT)
List of Figures
1. Global Ethyl Acetate Market Segmentation
2. Ethyl Acetate Market: Research Methodology
3. Market Size Estimation Methodology: Bottom-Up Approach
4. Market Size Estimation Methodology: Top-Down Approach
5. Data Triangulation
6. Porter’s Five Forces Analysis
7. Value Chain Analysis
8. Global Ethyl Acetate Market Attractiveness Analysis By Application
9. Global Ethyl Acetate Market Attractiveness Analysis By End User
10. Global Ethyl Acetate Market Attractiveness Analysis By Region
11. Global Ethyl Acetate Market: Dynamics
12. Global Ethyl Acetate Market Share By Application (2023 & 2033)
13. Global Ethyl Acetate Market Share By End User (2023 & 2033)
14. Global Ethyl Acetate Market Share by Regions (2023 & 2033)
15. Global Ethyl Acetate Market Share by Company (2023)
This study forecasts revenue at global, regional, and country levels from 2020 to 2033. The Brainy Insights has segmented the global Ethyl Acetate market on the basis of below mentioned segments:
Global Ethyl Acetate Market by Application:
Global Ethyl Acetate Market by End User:
Global Ethyl Acetate Market by Region:
Research has its special purpose to undertake marketing efficiently. In this competitive scenario, businesses need information across all industry verticals; the information about customer wants, market demand, competition, industry trends, distribution channels etc. This information needs to be updated regularly because businesses operate in a dynamic environment. Our organization, The Brainy Insights incorporates scientific and systematic research procedures in order to get proper market insights and industry analysis for overall business success. The analysis consists of studying the market from a miniscule level wherein we implement statistical tools which helps us in examining the data with accuracy and precision.
Our research reports feature both; quantitative and qualitative aspects for any market. Qualitative information for any market research process are fundamental because they reveal the customer needs and wants, usage and consumption for any product/service related to a specific industry. This in turn aids the marketers/investors in knowing certain perceptions of the customers. Qualitative research can enlighten about the different product concepts and designs along with unique service offering that in turn, helps define marketing problems and generate opportunities. On the other hand, quantitative research engages with the data collection process through interviews, e-mail interactions, surveys and pilot studies. Quantitative aspects for the market research are useful to validate the hypotheses generated during qualitative research method, explore empirical patterns in the data with the help of statistical tools, and finally make the market estimations.
The Brainy Insights offers comprehensive research and analysis, based on a wide assortment of factual insights gained through interviews with CXOs and global experts and secondary data from reliable sources. Our analysts and industry specialist assume vital roles in building up statistical tools and analysis models, which are used to analyse the data and arrive at accurate insights with exceedingly informative research discoveries. The data provided by our organization have proven precious to a diverse range of companies, facilitating them to address issues such as determining which products/services are the most appealing, whether or not customers use the product in the manner anticipated, the purchasing intentions of the market and many others.
Our research methodology encompasses an idyllic combination of primary and secondary initiatives. Key phases involved in this process are listed below:

The phase involves the gathering and collecting of market data and its related information with the help of different sources & research procedures.

The data procurement stage involves in data gathering and collecting through various data sources.
This stage involves in extensive research. These data sources includes:
Purchased Database: Purchased databases play a crucial role in estimating the market sizes irrespective of the domain. Our purchased database includes:
Primary Research: The Brainy Insights interacts with leading companies and experts of the concerned domain to develop the analyst team’s market understanding and expertise. It improves and substantiates every single data presented in the market reports. Primary research mainly involves in telephonic interviews, E-mail interactions and face-to-face interviews with the raw material providers, manufacturers/producers, distributors, & independent consultants. The interviews that we conduct provides valuable data on market size and industry growth trends prevailing in the market. Our organization also conducts surveys with the various industry experts in order to gain overall insights of the industry/market. For instance, in healthcare industry we conduct surveys with the pharmacists, doctors, surgeons and nurses in order to gain insights and key information of a medical product/device/equipment which the customers are going to usage. Surveys are conducted in the form of questionnaire designed by our own analyst team. Surveys plays an important role in primary research because surveys helps us to identify the key target audiences of the market. Additionally, surveys helps to identify the key target audience engaged with the market. Our survey team conducts the survey by targeting the key audience, thus gaining insights from them. Based on the perspectives of the customers, this information is utilized to formulate market strategies. Moreover, market surveys helps us to understand the current competitive situation of the industry. To be precise, our survey process typically involve with the 360 analysis of the market. This analytical process begins by identifying the prospective customers for a product or service related to the market/industry to obtain data on how a product/service could fit into customers’ lives.

Secondary Research: The secondary data sources includes information published by the on-profit organizations such as World bank, WHO, company fillings, investor presentations, annual reports, national government documents, statistical databases, blogs, articles, white papers and others. From the annual report, we analyse a company’s revenue to understand the key segment and market share of that organization in a particular region. We analyse the company websites and adopt the product mapping technique which is important for deriving the segment revenue. In the product mapping method, we select and categorize the products offered by the companies catering to domain specific market, deduce the product revenue for each of the companies so as to get overall estimation of the market size. We also source data and analyses trends based on information received from supply side and demand side intermediaries in the value chain. The supply side denotes the data gathered from supplier, distributor, wholesaler and the demand side illustrates the data gathered from the end customers for respective market domain.

The supply side for a domain specific market is analysed by:
The demand side for the market is estimated through:
In-house Library: Apart from these third-party sources, we have our in-house library of qualitative and quantitative information. Our in-house database includes market data for various industry and domains. These data are updated on regular basis as per the changing market scenario. Our library includes, historic databases, internal audit reports and archives.
Sometimes there are instances where there is no metadata or raw data available for any domain specific market. For those cases, we use our expertise to forecast and estimate the market size in order to generate comprehensive data sets. Our analyst team adopt a robust research technique in order to produce the estimates:
Data Synthesis: This stage involves the analysis & mapping of all the information obtained from the previous step. It also involves in scrutinizing the data for any discrepancy observed while data gathering related to the market. The data is collected with consideration to the heterogeneity of sources. Robust scientific techniques are in place for synthesizing disparate data sets and provide the essential contextual information that can orient market strategies. The Brainy Insights has extensive experience in data synthesis where the data passes through various stages:


Market Deduction & Formulation: The final stage comprises of assigning data points at appropriate market spaces so as to deduce feasible conclusions. Analyst perspective & subject matter expert based holistic form of market sizing coupled with industry analysis also plays a crucial role in this stage.
This stage involves in finalization of the market size and numbers that we have collected from data integration step. With data interpolation, it is made sure that there is no gap in the market data. Successful trend analysis is done by our analysts using extrapolation techniques, which provide the best possible forecasts for the market.
Data Validation & Market Feedback: Validation is the most important step in the process. Validation & re-validation via an intricately designed process helps us finalize data-points to be used for final calculations.

The Brainy Insights interacts with leading companies and experts of the concerned domain to develop the analyst team’s market understanding and expertise. It improves and substantiates every single data presented in the market reports. The data validation interview and discussion panels are typically composed of the most experienced industry members. The participants include, however, are not limited to:
Moreover, we always validate our data and findings through primary respondents from all the major regions we are working on.
Free Customization
Fortune 500 Clients
Free Yearly Update On Purchase Of Multi/Corporate License
Companies Served Till Date