- +1-315-215-1633
- sales@thebrainyinsights.com

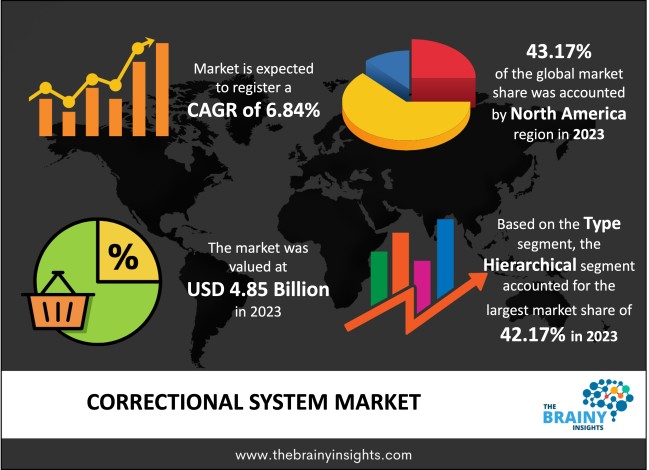
The global Correctional System market generated USD 4.85 Billion revenue in 2023 and is projected to grow at a CAGR of 6.84% from 2024 to 2033. The market is expected to reach USD 9.40 Billion by 2033. The growing population in correctional facilities raises the need to upgrade the correctional system, services, and solutions, thus creating growth in the marketplace. Furthermore, combining innovative technologies like biometrics, surveillance systems, and inmate management software enhances the nascent growth in the correctional system industry.
The correctional system is the systematic approach to supervising persons accused or convicted of criminal violations through a network of institutions, programs, and processes. In this system, people may be placed in different places like prisons, jails, detain centers or even rehabilitation centers depending on the extent of their offence and the laws of the land. This prison break is confined to the individual who has been convicted of a crime and has been found guilty. Penitentiaries or confirmed jails and temporary or regional facilities are the basic structures of imprisonment, with penitentiaries confining persons for longer terms. In contrast, jails detain individuals for temporary terms, awaiting trial, or serving short terms. Also, the correctional system concentrates on delivering programmes and services that intend to prevent criminal behaviour, helping offenders overcome personal problems. This factor may encompass educational classes, vocational rehabilitation, alcohol and drug rehabilitation, psychiatric care, and various types of counselling. Also raises the issue of restoring the losses occasioned by criminal conduct by components like victim-offender conferencing, compensation and community payback. This aspect ensures that all citizens are accountable, that the offender and the victim are at the end of healing, and that the offender and the victim are at the reunion with the rest of society. In addition, the Office of Parole seeks to ensure that ex-inmates are well-monitored and assisted in returning to society. This aspect can encompass accommodation, access to a job, support in accessing education or health care, and help with substance abuse or a mental health problem.
Get an overview of this study by requesting a free sample
1. Introduction
1.1. Objectives of the Study
1.2. Market Definition
1.3. Research Scope
1.4. Currency
1.5. Key Target Audience
2. Research Methodology and Assumptions
3. Executive Summary
4. Premium Insights
4.1. Porter’s Five Forces Analysis
4.2. Value Chain Analysis
4.3. Top Investment Pockets
4.3.1. Market Attractiveness Analysis By Type
4.3.2. Market Attractiveness Analysis By Application
4.3.3. Market Attractiveness Analysis By Region
4.4. Industry Trends
5. Market Dynamics
5.1. Market Evaluation
5.2. Drivers
5.2.1. Government Policies and Regulations
5.2.2. Population Growth and Crime Rates
5.3. Restraints
5.3.1. Budget Constraints
5.4. Opportunities
5.4.1. Privatization and Outsourcing
5.5. Challenges
5.5.1. Staffing Shortages and Retention
6. Global Correctional System Market Analysis and Forecast, By Type
6.1. Segment Overview
6.2. Autonomous
6.3. Differentiated
6.4. Hierarchical
7. Global Correctional System Market Analysis and Forecast, By Application
7.1. Segment Overview
7.2. Community-Based Rehabilitation Center
7.3. Detention Center
7.4. Halfway House
7.5. Prison
7.6. Reformatory
7.7. Work Farm
7.8. Others
8. Global Correctional System Market Analysis and Forecast, By Regional Analysis
8.1. Segment Overview
8.2. North America
8.2.1. U.S.
8.2.2. Canada
8.2.3. Mexico
8.3. Europe
8.3.1. Germany
8.3.2. France
8.3.3. U.K.
8.3.4. Italy
8.3.5. Spain
8.4. Asia-Pacific
8.4.1. Japan
8.4.2. China
8.4.3. India
8.5. South America
8.5.1. Brazil
8.6. Middle East and Africa
8.6.1. UAE
8.6.2. South Africa
9. Global Correctional System Market-Competitive Landscape
9.1. Overview
9.2. Market Share of Key Players in the Correctional System Market
9.2.1. Global Company Market Share
9.2.2. North America Company Market Share
9.2.3. Europe Company Market Share
9.2.4. APAC Company Market Share
9.3. Competitive Situations and Trends
9.3.1. Product Launches and Developments
9.3.2. Partnerships, Collaborations, and Agreements
9.3.3. Mergers & Acquisitions
9.3.4. Expansions
10. Company Profiles
10.1. Alert Public Safety Solutions
10.1.1. Business Overview
10.1.2. Company Snapshot
10.1.3. Company Market Share Analysis
10.1.4. Company Product Portfolio
10.1.5. Recent Developments
10.1.6. SWOT Analysis
10.2. Bio-Metrica
10.2.1. Business Overview
10.2.2. Company Snapshot
10.2.3. Company Market Share Analysis
10.2.4. Company Product Portfolio
10.2.5. Recent Developments
10.2.6. SWOT Analysis
10.3. Black Creek
10.3.1. Business Overview
10.3.2. Company Snapshot
10.3.3. Company Market Share Analysis
10.3.4. Company Product Portfolio
10.3.5. Recent Developments
10.3.6. SWOT Analysis
10.4. Beacon Software Solutions
10.4.1. Business Overview
10.4.2. Company Snapshot
10.4.3. Company Market Share Analysis
10.4.4. Company Product Portfolio
10.4.5. Recent Developments
10.4.6. SWOT Analysis
10.5. CoreCivic
10.5.1. Business Overview
10.5.2. Company Snapshot
10.5.3. Company Market Share Analysis
10.5.4. Company Product Portfolio
10.5.5. Recent Developments
10.5.6. SWOT Analysis
10.6. Corizon Health
10.6.1. Business Overview
10.6.2. Company Snapshot
10.6.3. Company Market Share Analysis
10.6.4. Company Product Portfolio
10.6.5. Recent Developments
10.6.6. SWOT Analysis
10.7. Encartele
10.7.1. Business Overview
10.7.2. Company Snapshot
10.7.3. Company Market Share Analysis
10.7.4. Company Product Portfolio
10.7.5. Recent Developments
10.7.6. SWOT Analysis
10.8. Eagle Advantage Solutions
10.8.1. Business Overview
10.8.2. Company Snapshot
10.8.3. Company Market Share Analysis
10.8.4. Company Product Portfolio
10.8.5. Recent Developments
10.8.6. SWOT Analysis
10.9. GTL
10.9.1. Business Overview
10.9.2. Company Snapshot
10.9.3. Company Market Share Analysis
10.9.4. Company Product Portfolio
10.9.5. Recent Developments
10.9.6. SWOT Analysis
10.10. Huber & Associates
10.10.1. Business Overview
10.10.2. Company Snapshot
10.10.3. Company Market Share Analysis
10.10.4. Company Product Portfolio
10.10.5. Recent Developments
10.10.6. SWOT Analysis
10.11. Montgomery Technology
10.11.1. Business Overview
10.11.2. Company Snapshot
10.11.3. Company Market Share Analysis
10.11.4. Company Product Portfolio
10.11.5. Recent Developments
10.11.6. SWOT Analysis
10.12. Spillman Technologies
10.12.1. Business Overview
10.12.2. Company Snapshot
10.12.3. Company Market Share Analysis
10.12.4. Company Product Portfolio
10.12.5. Recent Developments
10.12.6. SWOT Analysis
10.13. Sun Ridge Systems
10.13.1. Business Overview
10.13.2. Company Snapshot
10.13.3. Company Market Share Analysis
10.13.4. Company Product Portfolio
10.13.5. Recent Developments
10.13.6. SWOT Analysis
10.14. Securus Technologies
10.14.1. Business Overview
10.14.2. Company Snapshot
10.14.3. Company Market Share Analysis
10.14.4. Company Product Portfolio
10.14.5. Recent Developments
10.14.6. SWOT Analysis
10.15. Tyler Technologies
10.15.1. Business Overview
10.15.2. Company Snapshot
10.15.3. Company Market Share Analysis
10.15.4. Company Product Portfolio
10.15.5. Recent Developments
10.15.6. SWOT Analysis
10.16. Telmate
10.16.1. Business Overview
10.16.2. Company Snapshot
10.16.3. Company Market Share Analysis
10.16.4. Company Product Portfolio
10.16.5. Recent Developments
10.16.6. SWOT Analysis
List of Table
1. Global Correctional System Market, By Type, 2020-2033 (USD Billion)
2. Global Autonomous, Correctional System Market, By Region, 2020-2033 (USD Billion)
3. Global Differentiated, Correctional System Market, By Region, 2020-2033 (USD Billion)
4. Global Hierarchical, Correctional System Market, By Region, 2020-2033 (USD Billion)
5. Global Correctional System Market, By Application, 2020-2033 (USD Billion)
6. Global Community-Based Rehabilitation Center, Correctional System Market, By Region, 2020-2033 (USD Billion)
7. Global Detention Center, Correctional System Market, By Region, 2020-2033 (USD Billion)
8. Global Halfway House, Correctional System Market, By Region, 2020-2033 (USD Billion)
9. Global Prison, Correctional System Market, By Region, 2020-2033 (USD Billion)
10. Global Reformatory, Correctional System Market, By Region, 2020-2033 (USD Billion)
11. Global Work Farm, Correctional System Market, By Region, 2020-2033 (USD Billion)
12. Global Others, Correctional System Market, By Region, 2020-2033 (USD Billion)
13. Global Correctional System Market, By Region, 2020-2033 (USD Billion)
14. North America Correctional System Market, By Type, 2020-2033 (USD Billion)
15. North America Correctional System Market, By Application, 2020-2033 (USD Billion)
16. U.S. Correctional System Market, By Type, 2020-2033 (USD Billion)
17. U.S. Correctional System Market, By Application, 2020-2033 (USD Billion)
18. Canada Correctional System Market, By Type, 2020-2033 (USD Billion)
19. Canada Correctional System Market, By Application, 2020-2033 (USD Billion)
20. Mexico Correctional System Market, By Type, 2020-2033 (USD Billion)
21. Mexico Correctional System Market, By Application, 2020-2033 (USD Billion)
22. Europe Correctional System Market, By Type, 2020-2033 (USD Billion)
23. Europe Correctional System Market, By Application, 2020-2033 (USD Billion)
24. Germany Correctional System Market, By Type, 2020-2033 (USD Billion)
25. Germany Correctional System Market, By Application, 2020-2033 (USD Billion)
26. France Correctional System Market, By Type, 2020-2033 (USD Billion)
27. France Correctional System Market, By Application, 2020-2033 (USD Billion)
28. U.K. Correctional System Market, By Type, 2020-2033 (USD Billion)
29. U.K. Correctional System Market, By Application, 2020-2033 (USD Billion)
30. Italy Correctional System Market, By Type, 2020-2033 (USD Billion)
31. Italy Correctional System Market, By Application, 2020-2033 (USD Billion)
32. Spain Correctional System Market, By Type, 2020-2033 (USD Billion)
33. Spain Correctional System Market, By Application, 2020-2033 (USD Billion)
34. Asia Pacific Correctional System Market, By Type, 2020-2033 (USD Billion)
35. Asia Pacific Correctional System Market, By Application, 2020-2033 (USD Billion)
36. Japan Correctional System Market, By Type, 2020-2033 (USD Billion)
37. Japan Correctional System Market, By Application, 2020-2033 (USD Billion)
38. China Correctional System Market, By Type, 2020-2033 (USD Billion)
39. China Correctional System Market, By Application, 2020-2033 (USD Billion)
40. India Correctional System Market, By Type, 2020-2033 (USD Billion)
41. India Correctional System Market, By Application, 2020-2033 (USD Billion)
42. South America Correctional System Market, By Type, 2020-2033 (USD Billion)
43. South America Correctional System Market, By Application, 2020-2033 (USD Billion)
44. Brazil Correctional System Market, By Type, 2020-2033 (USD Billion)
45. Brazil Correctional System Market, By Application, 2020-2033 (USD Billion)
46. Middle East and Africa Correctional System Market, By Type, 2020-2033 (USD Billion)
47. Middle East and Africa Correctional System Market, By Application, 2020-2033 (USD Billion)
48. UAE Correctional System Market, By Type, 2020-2033 (USD Billion)
49. UAE Correctional System Market, By Application, 2020-2033 (USD Billion)
50. South Africa Correctional System Market, By Type, 2020-2033 (USD Billion)
51. South Africa Correctional System Market, By Application, 2020-2033 (USD Billion)
List of Figures
1. Global Correctional System Market Segmentation
2. Correctional System Market: Research Methodology
3. Market Size Estimation Methodology: Bottom-Up Approach
4. Market Size Estimation Methodology: Top-Down Approach
5. Data Triangulation
6. Porter’s Five Forces Analysis
7. Value Chain Analysis
8. Global Correctional System Market Attractiveness Analysis By Type
9. Global Correctional System Market Attractiveness Analysis By Application
10. Global Correctional System Market Attractiveness Analysis By Region
11. Global Correctional System Market: Dynamics
12. Global Correctional System Market Share By Type (2024 & 2033)
13. Global Correctional System Market Share By Application (2024 & 2033)
14. Global Correctional System Market Share By Regions (2024 & 2033)
15. Global Correctional System Market Share by Company (2023)
This study forecasts revenue at global, regional, and country levels from 2020 to 2033. The Brainy Insights has segmented the global Correctional System market based on below-mentioned segments:
Global Correctional System Market by Type:
Global Correctional System Market by Application:
Global Correctional System Market by Region:
Research has its special purpose to undertake marketing efficiently. In this competitive scenario, businesses need information across all industry verticals; the information about customer wants, market demand, competition, industry trends, distribution channels etc. This information needs to be updated regularly because businesses operate in a dynamic environment. Our organization, The Brainy Insights incorporates scientific and systematic research procedures in order to get proper market insights and industry analysis for overall business success. The analysis consists of studying the market from a miniscule level wherein we implement statistical tools which helps us in examining the data with accuracy and precision.
Our research reports feature both; quantitative and qualitative aspects for any market. Qualitative information for any market research process are fundamental because they reveal the customer needs and wants, usage and consumption for any product/service related to a specific industry. This in turn aids the marketers/investors in knowing certain perceptions of the customers. Qualitative research can enlighten about the different product concepts and designs along with unique service offering that in turn, helps define marketing problems and generate opportunities. On the other hand, quantitative research engages with the data collection process through interviews, e-mail interactions, surveys and pilot studies. Quantitative aspects for the market research are useful to validate the hypotheses generated during qualitative research method, explore empirical patterns in the data with the help of statistical tools, and finally make the market estimations.
The Brainy Insights offers comprehensive research and analysis, based on a wide assortment of factual insights gained through interviews with CXOs and global experts and secondary data from reliable sources. Our analysts and industry specialist assume vital roles in building up statistical tools and analysis models, which are used to analyse the data and arrive at accurate insights with exceedingly informative research discoveries. The data provided by our organization have proven precious to a diverse range of companies, facilitating them to address issues such as determining which products/services are the most appealing, whether or not customers use the product in the manner anticipated, the purchasing intentions of the market and many others.
Our research methodology encompasses an idyllic combination of primary and secondary initiatives. Key phases involved in this process are listed below:

The phase involves the gathering and collecting of market data and its related information with the help of different sources & research procedures.

The data procurement stage involves in data gathering and collecting through various data sources.
This stage involves in extensive research. These data sources includes:
Purchased Database: Purchased databases play a crucial role in estimating the market sizes irrespective of the domain. Our purchased database includes:
Primary Research: The Brainy Insights interacts with leading companies and experts of the concerned domain to develop the analyst team’s market understanding and expertise. It improves and substantiates every single data presented in the market reports. Primary research mainly involves in telephonic interviews, E-mail interactions and face-to-face interviews with the raw material providers, manufacturers/producers, distributors, & independent consultants. The interviews that we conduct provides valuable data on market size and industry growth trends prevailing in the market. Our organization also conducts surveys with the various industry experts in order to gain overall insights of the industry/market. For instance, in healthcare industry we conduct surveys with the pharmacists, doctors, surgeons and nurses in order to gain insights and key information of a medical product/device/equipment which the customers are going to usage. Surveys are conducted in the form of questionnaire designed by our own analyst team. Surveys plays an important role in primary research because surveys helps us to identify the key target audiences of the market. Additionally, surveys helps to identify the key target audience engaged with the market. Our survey team conducts the survey by targeting the key audience, thus gaining insights from them. Based on the perspectives of the customers, this information is utilized to formulate market strategies. Moreover, market surveys helps us to understand the current competitive situation of the industry. To be precise, our survey process typically involve with the 360 analysis of the market. This analytical process begins by identifying the prospective customers for a product or service related to the market/industry to obtain data on how a product/service could fit into customers’ lives.

Secondary Research: The secondary data sources includes information published by the on-profit organizations such as World bank, WHO, company fillings, investor presentations, annual reports, national government documents, statistical databases, blogs, articles, white papers and others. From the annual report, we analyse a company’s revenue to understand the key segment and market share of that organization in a particular region. We analyse the company websites and adopt the product mapping technique which is important for deriving the segment revenue. In the product mapping method, we select and categorize the products offered by the companies catering to domain specific market, deduce the product revenue for each of the companies so as to get overall estimation of the market size. We also source data and analyses trends based on information received from supply side and demand side intermediaries in the value chain. The supply side denotes the data gathered from supplier, distributor, wholesaler and the demand side illustrates the data gathered from the end customers for respective market domain.

The supply side for a domain specific market is analysed by:
The demand side for the market is estimated through:
In-house Library: Apart from these third-party sources, we have our in-house library of qualitative and quantitative information. Our in-house database includes market data for various industry and domains. These data are updated on regular basis as per the changing market scenario. Our library includes, historic databases, internal audit reports and archives.
Sometimes there are instances where there is no metadata or raw data available for any domain specific market. For those cases, we use our expertise to forecast and estimate the market size in order to generate comprehensive data sets. Our analyst team adopt a robust research technique in order to produce the estimates:
Data Synthesis: This stage involves the analysis & mapping of all the information obtained from the previous step. It also involves in scrutinizing the data for any discrepancy observed while data gathering related to the market. The data is collected with consideration to the heterogeneity of sources. Robust scientific techniques are in place for synthesizing disparate data sets and provide the essential contextual information that can orient market strategies. The Brainy Insights has extensive experience in data synthesis where the data passes through various stages:


Market Deduction & Formulation: The final stage comprises of assigning data points at appropriate market spaces so as to deduce feasible conclusions. Analyst perspective & subject matter expert based holistic form of market sizing coupled with industry analysis also plays a crucial role in this stage.
This stage involves in finalization of the market size and numbers that we have collected from data integration step. With data interpolation, it is made sure that there is no gap in the market data. Successful trend analysis is done by our analysts using extrapolation techniques, which provide the best possible forecasts for the market.
Data Validation & Market Feedback: Validation is the most important step in the process. Validation & re-validation via an intricately designed process helps us finalize data-points to be used for final calculations.

The Brainy Insights interacts with leading companies and experts of the concerned domain to develop the analyst team’s market understanding and expertise. It improves and substantiates every single data presented in the market reports. The data validation interview and discussion panels are typically composed of the most experienced industry members. The participants include, however, are not limited to:
Moreover, we always validate our data and findings through primary respondents from all the major regions we are working on.
Free Customization
Fortune 500 Clients
Free Yearly Update On Purchase Of Multi/Corporate License
Companies Served Till Date