- +1-315-215-1633
- sales@thebrainyinsights.com

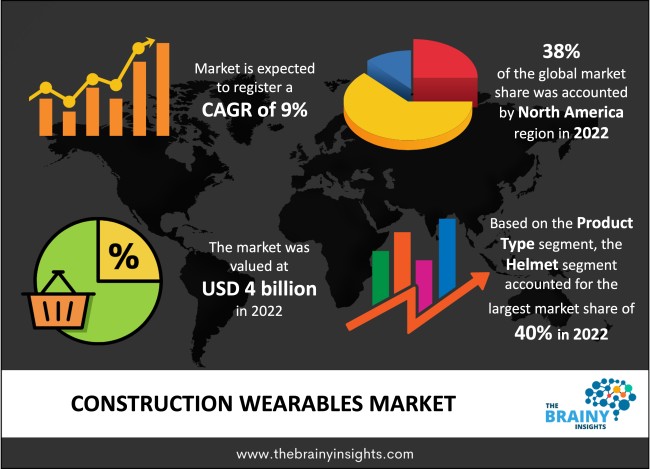
The global construction wearables market is expected to grow from USD 4 billion in 2022 to USD 9.46 billion by 2032, at a CAGR of 9% from 2023-2032. The rising demand for real estate will augment the growth of the global construction wearables market.
Any device intended to be used while being worn qualifies as wearable. Smartwatches and smart glasses are two famous examples of wearables. To make construction work safer and more productive for the user, wearable technology in construction is a type of PPE (personal protective gear) that integrates construction safety with smart technology. These wearables come in various shapes and sizes, with different levels of technological sophistication. They can be worn as accessories like glasses or watches or as apparel. Smartwatches, boots, vests, cameras, and augmented reality (AR) glasses are the most popular form of wearable technology in the construction industry. Smartwatches can detect falls and send out a warning, thereby successfully preventing accidents and fatalities at the workplace. Smart Footwear, Exoskeletons and Smart Armbands are also construction wearables used in the market. Construction wearables improve the safety of the construction crew. The wearables enhance productivity by enabling faster communication-saving time, effort and capital. The real-time data collection in a streamlined manner enables quicker collection and analysis, which improves work efficiency. The analysis also helps in improving resource planning and management.
Get an overview of this study by requesting a free sample
February 2023 – Ferrovial introduced safety wearables for construction sites. Their effective system uses proximity sensors in jackets, helmets, and other accessories connected to the equipment running on the job site. The system issues a physical, visual, and acoustic triple warning when it detects a dangerous situation. The initiative is a component of SHWIL (Safety, Health, Wellbeing Innovation Lab), a programme for innovation that uses new technologies to increase the safety of workers and users of the infrastructure. Ferrovial is steadfastly dedicated to innovation and technology, primarily to enhance the security of employees and customers using the company's infrastructures. The company's strategy strongly emphasises health and safety, with prevention as a crucial component.
1. Introduction
1.1. Objectives of the Study
1.2. Market Definition
1.3. Research Scope
1.4. Currency
1.5. Key Target Audience
2. Research Methodology and Assumptions
3. Executive Summary
4. Premium Insights
4.1. Porter’s Five Forces Analysis
4.2. Value Chain Analysis
4.3. Top Investment Pockets
4.3.1. Market Attractiveness Analysis By Product Type
4.3.2. Market Attractiveness Analysis By Application
4.3.3. Market Attractiveness Analysis By Region
4.4. Industry Trends
5. Market Dynamics
5.1. Market Evaluation
5.2. Drivers
5.2.1. The increasing demand for real estate
5.3. Restraints
5.3.1. The high pricing of advanced construction wearables
5.4. Opportunities
5.4.1. The increased research and development expenditure to improve construction wearable technology
5.5. Challenges
5.5.1. The lack of standardization in rules governing the use of construction wearables
6. Global Construction Wearables Market Analysis and Forecast, By Product Type
6.1. Segment Overview
6.2. Watch
6.3. Helmet
6.4. Body Vest
6.5. Boot
6.6. AR Glasses
6.7. Exoskeleton
6.8. Others
7. Global Construction Wearables Market Analysis and Forecast, By Application
7.1. Segment Overview
7.2. Residential
7.3. Industrial
7.4. Commercial
7.5. Infrastructural
7.6. Others
8. Global Construction Wearables Market Analysis and Forecast, By Regional Analysis
8.1. Segment Overview
8.2. North America
8.2.1. U.S.
8.2.2. Canada
8.2.3. Mexico
8.3. Europe
8.3.1. Germany
8.3.2. France
8.3.3. U.K.
8.3.4. Italy
8.3.5. Spain
8.4. Asia-Pacific
8.4.1. Japan
8.4.2. China
8.4.3. India
8.5. South America
8.5.1. Brazil
8.6. Middle East and Africa
8.6.1. UAE
8.6.2. South Africa
9. Global Construction Wearables Market-Competitive Landscape
9.1. Overview
9.2. Market Share of Key Players in the Construction Wearables Market
9.2.1. Global Company Market Share
9.2.2. North America Company Market Share
9.2.3. Europe Company Market Share
9.2.4. APAC Company Market Share
9.3. Competitive Situations and Trends
9.3.1. Product Launches and Developments
9.3.2. Partnerships, Collaborations, and Agreements
9.3.3. Mergers & Acquisitions
9.3.4. Expansions
10. Company Profiles
10.1. Behr Tech
10.1.1. Business Overview
10.1.2. Company Snapshot
10.1.3. Company Market Share Analysis
10.1.4. Company Product Portfolio
10.1.5. Recent Developments
10.1.6. SWOT Analysis
10.2. Eleksen
10.2.1. Business Overview
10.2.2. Company Snapshot
10.2.3. Company Market Share Analysis
10.2.4. Company Product Portfolio
10.2.5. Recent Developments
10.2.6. SWOT Analysis
10.3. GuardHat
10.3.1. Business Overview
10.3.2. Company Snapshot
10.3.3. Company Market Share Analysis
10.3.4. Company Product Portfolio
10.3.5. Recent Developments
10.3.6. SWOT Analysis
10.4. Intellinium
10.4.1. Business Overview
10.4.2. Company Snapshot
10.4.3. Company Market Share Analysis
10.4.4. Company Product Portfolio
10.4.5. Recent Developments
10.4.6. SWOT Analysis
10.5. Kenzen
10.5.1. Business Overview
10.5.2. Company Snapshot
10.5.3. Company Market Share Analysis
10.5.4. Company Product Portfolio
10.5.5. Recent Developments
10.5.6. SWOT Analysis
10.6. Modjoul
10.6.1. Business Overview
10.6.2. Company Snapshot
10.6.3. Company Market Share Analysis
10.6.4. Company Product Portfolio
10.6.5. Recent Developments
10.6.6. SWOT Analysis
10.7. Qoowear
10.7.1. Business Overview
10.7.2. Company Snapshot
10.7.3. Company Market Share Analysis
10.7.4. Company Product Portfolio
10.7.5. Recent Developments
10.7.6. SWOT Analysis
10.8. Reactec
10.8.1. Business Overview
10.8.2. Company Snapshot
10.8.3. Company Market Share Analysis
10.8.4. Company Product Portfolio
10.8.5. Recent Developments
10.8.6. SWOT Analysis
10.9. RealWear
10.9.1. Business Overview
10.9.2. Company Snapshot
10.9.3. Company Market Share Analysis
10.9.4. Company Product Portfolio
10.9.5. Recent Developments
10.9.6. SWOT Analysis
10.10. Retenua
10.10.1. Business Overview
10.10.2. Company Snapshot
10.10.3. Company Market Share Analysis
10.10.4. Company Component Portfolio
10.10.5. Recent Developments
10.10.6. SWOT Analysis
List of Table
1. Global Construction Wearables Market, By Product Type, 2019-2032 (USD Billion)
2. Global Watch Construction Wearables Market, By Region, 2019-2032 (USD Billion)
3. Global Helmet Construction Wearables Market, By Region, 2019-2032 (USD Billion)
4. Global Body Vest Construction Wearables Market, By Region, 2019-2032 (USD Billion)
5. Global Boot Construction Wearables Market, By Region, 2019-2032 (USD Billion)
6. Global AR Glasses Construction Wearables Market, By Region, 2019-2032 (USD Billion)
7. Global Exoskeleton Construction Wearables Market, By Region, 2019-2032 (USD Billion)
8. Global Others Construction Wearables Market, By Region, 2019-2032 (USD Billion)
9. Global Construction Wearables Market, By Application, 2019-2032 (USD Billion)
10. Global Residential Construction Wearables Market, By Region, 2019-2032 (USD Billion)
11. Global Industrial Construction Wearables Market, By Region, 2019-2032 (USD Billion)
12. Global Commercial Construction Wearables Market, By Region, 2019-2032 (USD Billion)
13. Global Infrastructural Construction Wearables Market, By Region, 2019-2032 (USD Billion)
14. Global Others Construction Wearables Market, By Region, 2019-2032 (USD Billion)
15. Global Construction Wearables Market, By Region, 2019-2032 (USD Billion)
16. North America Construction Wearables Market, By Product Type, 2019-2032 (USD Billion)
17. North America Construction Wearables Market, By Application, 2019-2032 (USD Billion)
18. U.S. Construction Wearables Market, By Product Type, 2019-2032 (USD Billion)
19. U.S. Construction Wearables Market, By Application, 2019-2032 (USD Billion)
20. Canada Construction Wearables Market, By Product Type, 2019-2032 (USD Billion)
21. Canada Construction Wearables Market, By Application, 2019-2032 (USD Billion)
22. Mexico Construction Wearables Market, By Product Type, 2019-2032 (USD Billion)
23. Mexico Construction Wearables Market, By Application, 2019-2032 (USD Billion)
24. Europe Construction Wearables Market, By Product Type, 2019-2032 (USD Billion)
25. Europe Construction Wearables Market, By Application, 2019-2032 (USD Billion)
26. Germany Construction Wearables Market, By Product Type, 2019-2032 (USD Billion)
27. Germany Construction Wearables Market, By Application, 2019-2032 (USD Billion)
28. France Construction Wearables Market, By Product Type, 2019-2032 (USD Billion)
29. France Construction Wearables Market, By Application, 2019-2032 (USD Billion)
30. U.K. Construction Wearables Market, By Product Type, 2019-2032 (USD Billion)
31. U.K. Construction Wearables Market, By Application, 2019-2032 (USD Billion)
32. Italy Construction Wearables Market, By Product Type, 2019-2032 (USD Billion)
33. Italy Construction Wearables Market, By Application, 2019-2032 (USD Billion)
34. Spain Construction Wearables Market, By Product Type, 2019-2032 (USD Billion)
35. Spain Construction Wearables Market, By Application, 2019-2032 (USD Billion)
36. Asia Pacific Construction Wearables Market, By Product Type, 2019-2032 (USD Billion)
37. Asia Pacific Construction Wearables Market, By Application, 2019-2032 (USD Billion)
38. Japan Construction Wearables Market, By Product Type, 2019-2032 (USD Billion)
39. Japan Construction Wearables Market, By Application, 2019-2032 (USD Billion)
40. China Construction Wearables Market, By Product Type, 2019-2032 (USD Billion)
41. China Construction Wearables Market, By Application, 2019-2032 (USD Billion)
42. India Construction Wearables Market, By Product Type, 2019-2032 (USD Billion)
43. India Construction Wearables Market, By Application, 2019-2032 (USD Billion)
44. South America Construction Wearables Market, By Product Type, 2019-2032 (USD Billion)
45. South America Construction Wearables Market, By Application, 2019-2032 (USD Billion)
46. Brazil Construction Wearables Market, By Product Type, 2019-2032 (USD Billion)
47. Brazil Construction Wearables Market, By Application, 2019-2032 (USD Billion)
48. Middle East and Africa Construction Wearables Market, By Product Type, 2019-2032 (USD Billion)
49. Middle East and Africa Construction Wearables Market, By Application, 2019-2032 (USD Billion)
50. UAE Construction Wearables Market, By Product Type, 2019-2032 (USD Billion)
51. UAE Construction Wearables Market, By Application, 2019-2032 (USD Billion)
52. South Africa Construction Wearables Market, By Product Type, 2019-2032 (USD Billion)
53. South Africa Construction Wearables Market, By Application, 2019-2032 (USD Billion)
List of Figures
1. Global Construction Wearables Market Segmentation
2. Construction Wearables Market: Research Methodology
3. Market Size Estimation Methodology: Bottom-Up Approach
4. Market Size Estimation Methodology: Top-Down Approach
5. Data Triangulation
6. Porter’s Five Forces Analysis
7. Value Chain Analysis
8. Global Construction Wearables Market Attractiveness Analysis By Product Type
9. Global Construction Wearables Market Attractiveness Analysis By Application
10. Global Construction Wearables Market Attractiveness Analysis By Region
11. Global Construction Wearables Market: Dynamics
12. Global Construction Wearables Market Share by Product Type (2022 & 2032)
13. Global Construction Wearables Market Share by Application (2022 & 2032)
14. Global Construction Wearables Market Share by Regions (2022 & 2032)
15. Global Construction Wearables Market Share by Company (2022)
This study forecasts revenue at global, regional, and country levels from 2019 to 2032. The Brainy Insights has segmented the global construction wearables market based on below mentioned segments:
Global Construction Wearables Market by Product Type:
Global Construction Wearables Market by Application:
Global Construction Wearables Market by Region:
Research has its special purpose to undertake marketing efficiently. In this competitive scenario, businesses need information across all industry verticals; the information about customer wants, market demand, competition, industry trends, distribution channels etc. This information needs to be updated regularly because businesses operate in a dynamic environment. Our organization, The Brainy Insights incorporates scientific and systematic research procedures in order to get proper market insights and industry analysis for overall business success. The analysis consists of studying the market from a miniscule level wherein we implement statistical tools which helps us in examining the data with accuracy and precision.
Our research reports feature both; quantitative and qualitative aspects for any market. Qualitative information for any market research process are fundamental because they reveal the customer needs and wants, usage and consumption for any product/service related to a specific industry. This in turn aids the marketers/investors in knowing certain perceptions of the customers. Qualitative research can enlighten about the different product concepts and designs along with unique service offering that in turn, helps define marketing problems and generate opportunities. On the other hand, quantitative research engages with the data collection process through interviews, e-mail interactions, surveys and pilot studies. Quantitative aspects for the market research are useful to validate the hypotheses generated during qualitative research method, explore empirical patterns in the data with the help of statistical tools, and finally make the market estimations.
The Brainy Insights offers comprehensive research and analysis, based on a wide assortment of factual insights gained through interviews with CXOs and global experts and secondary data from reliable sources. Our analysts and industry specialist assume vital roles in building up statistical tools and analysis models, which are used to analyse the data and arrive at accurate insights with exceedingly informative research discoveries. The data provided by our organization have proven precious to a diverse range of companies, facilitating them to address issues such as determining which products/services are the most appealing, whether or not customers use the product in the manner anticipated, the purchasing intentions of the market and many others.
Our research methodology encompasses an idyllic combination of primary and secondary initiatives. Key phases involved in this process are listed below:

The phase involves the gathering and collecting of market data and its related information with the help of different sources & research procedures.

The data procurement stage involves in data gathering and collecting through various data sources.
This stage involves in extensive research. These data sources includes:
Purchased Database: Purchased databases play a crucial role in estimating the market sizes irrespective of the domain. Our purchased database includes:
Primary Research: The Brainy Insights interacts with leading companies and experts of the concerned domain to develop the analyst team’s market understanding and expertise. It improves and substantiates every single data presented in the market reports. Primary research mainly involves in telephonic interviews, E-mail interactions and face-to-face interviews with the raw material providers, manufacturers/producers, distributors, & independent consultants. The interviews that we conduct provides valuable data on market size and industry growth trends prevailing in the market. Our organization also conducts surveys with the various industry experts in order to gain overall insights of the industry/market. For instance, in healthcare industry we conduct surveys with the pharmacists, doctors, surgeons and nurses in order to gain insights and key information of a medical product/device/equipment which the customers are going to usage. Surveys are conducted in the form of questionnaire designed by our own analyst team. Surveys plays an important role in primary research because surveys helps us to identify the key target audiences of the market. Additionally, surveys helps to identify the key target audience engaged with the market. Our survey team conducts the survey by targeting the key audience, thus gaining insights from them. Based on the perspectives of the customers, this information is utilized to formulate market strategies. Moreover, market surveys helps us to understand the current competitive situation of the industry. To be precise, our survey process typically involve with the 360 analysis of the market. This analytical process begins by identifying the prospective customers for a product or service related to the market/industry to obtain data on how a product/service could fit into customers’ lives.

Secondary Research: The secondary data sources includes information published by the on-profit organizations such as World bank, WHO, company fillings, investor presentations, annual reports, national government documents, statistical databases, blogs, articles, white papers and others. From the annual report, we analyse a company’s revenue to understand the key segment and market share of that organization in a particular region. We analyse the company websites and adopt the product mapping technique which is important for deriving the segment revenue. In the product mapping method, we select and categorize the products offered by the companies catering to domain specific market, deduce the product revenue for each of the companies so as to get overall estimation of the market size. We also source data and analyses trends based on information received from supply side and demand side intermediaries in the value chain. The supply side denotes the data gathered from supplier, distributor, wholesaler and the demand side illustrates the data gathered from the end customers for respective market domain.

The supply side for a domain specific market is analysed by:
The demand side for the market is estimated through:
In-house Library: Apart from these third-party sources, we have our in-house library of qualitative and quantitative information. Our in-house database includes market data for various industry and domains. These data are updated on regular basis as per the changing market scenario. Our library includes, historic databases, internal audit reports and archives.
Sometimes there are instances where there is no metadata or raw data available for any domain specific market. For those cases, we use our expertise to forecast and estimate the market size in order to generate comprehensive data sets. Our analyst team adopt a robust research technique in order to produce the estimates:
Data Synthesis: This stage involves the analysis & mapping of all the information obtained from the previous step. It also involves in scrutinizing the data for any discrepancy observed while data gathering related to the market. The data is collected with consideration to the heterogeneity of sources. Robust scientific techniques are in place for synthesizing disparate data sets and provide the essential contextual information that can orient market strategies. The Brainy Insights has extensive experience in data synthesis where the data passes through various stages:


Market Deduction & Formulation: The final stage comprises of assigning data points at appropriate market spaces so as to deduce feasible conclusions. Analyst perspective & subject matter expert based holistic form of market sizing coupled with industry analysis also plays a crucial role in this stage.
This stage involves in finalization of the market size and numbers that we have collected from data integration step. With data interpolation, it is made sure that there is no gap in the market data. Successful trend analysis is done by our analysts using extrapolation techniques, which provide the best possible forecasts for the market.
Data Validation & Market Feedback: Validation is the most important step in the process. Validation & re-validation via an intricately designed process helps us finalize data-points to be used for final calculations.

The Brainy Insights interacts with leading companies and experts of the concerned domain to develop the analyst team’s market understanding and expertise. It improves and substantiates every single data presented in the market reports. The data validation interview and discussion panels are typically composed of the most experienced industry members. The participants include, however, are not limited to:
Moreover, we always validate our data and findings through primary respondents from all the major regions we are working on.
Free Customization
Fortune 500 Clients
Free Yearly Update On Purchase Of Multi/Corporate License
Companies Served Till Date