- +1-315-215-1633
- sales@thebrainyinsights.com

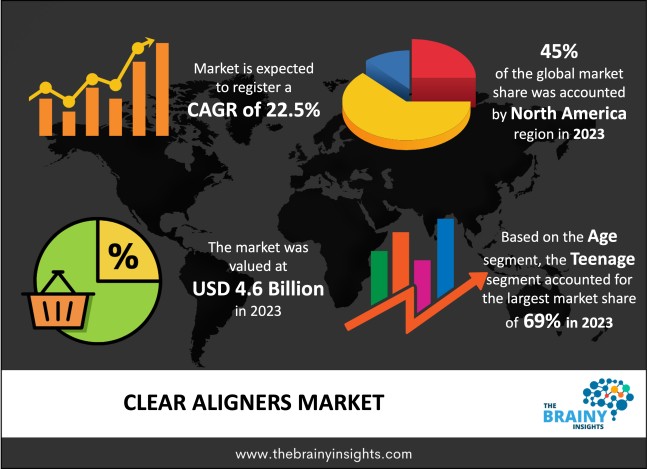
The global clear aligners market is expected to grow from USD 4.6 billion in 2023 to USD 34.97 billion by 2033, at a CAGR of 22.5% during the forecast period 2024-2033. The global clear aligners market is expected to expand as the prevalence of dental diseases rises. Custom-made mouthpieces or orthodontic devices known as clear aligners can effectively restore the alignment of crooked teeth. These convenient and flexible alternatives to braces are designed to be discreet, removable, and tailored specifically for each patient's needs. The rapid increase in patients with malocclusions, advancements in dental treatment technology, and rising demand for personalized clear aligners have contributed significantly to market growth overall. Despite global complications brought about by the pandemic during 2020, the market is anticipated to grow positively in the upcoming years. The key players within the industry are heavily investing in their research and development activities for product innovation and product development. This factor is anticipated to provide lucrative growth opportunities for the market.
Clear aligners are a clear, plastic kind of dental braces that are used to align teeth. They are an alternative to traditional braces that are used to move teeth into their right positions. Clear aligners are like braces in that they employ a force to control tooth movement, but they don't have any brackets or metal wires. The aligners are composed of a durable plastic and are specially designed to fit each person's mouth. If a series of aligners is required, each aligner gradually shifts the teeth until the desired result is obtained. Aligners, like traditional braces, are designed to gradually reposition teeth. The orthodontist will evaluate the patient and take diagnostic data, such as x-rays, pictures, and impressions or digital scans of the teeth, before starting treatment. The orthodontist can make a diagnosis based on this information, and then use aligner software to design the smile and plan the treatment – which teeth move where and in what order – guiding teeth into healthy positions. Patients with mild to moderately crowded teeth or minor spacing problems are often treated with clear orthodontic aligners. Extreme crowding or spacing issues, as well as severe underbites, overbites, or crossbites, may necessitate more complex treatment. The aligners are exact duplicates of the teeth made of plastic. Wearing them puts gentle pressure on the teeth, repositioning them slightly. Aligners should be used for 22 hours every day, or as directed by the orthodontist. Before moving on to the next set of aligners, each pair is worn for a week or two. Teeth move into their ideal positions over time, according to the orthodontist's plan. The overall number of aligners required varies depending on the patient's demands. Patients will need to wear retainers after their teeth have moved into their new places, just as they would with traditional braces.
Get an overview of this study by requesting a free sample
1. Introduction
1.1. Objectives of the Study
1.2. Market Definition
1.3. Research Scope
1.4. Currency
1.5. Key Target Audience
2. Research Methodology and Assumptions
3. Executive Summary
4. Premium Insights
4.1. Porter’s Five Forces Analysis
4.2. Value Chain Analysis
4.3. Top Investment Pockets
4.3.1. Market Attractiveness Analysis By Age
4.3.2. Market Attractiveness Analysis By Material Type
4.3.3. Market Attractiveness Analysis By End User
4.3.4. Market Attractiveness Analysis By Region
4.4. Industry Trends
5. Market Dynamics
5.1. Market Evaluation
5.2. Drivers
5.2.1. An increase in the number of patients suffering from orthodontic illnesses
5.2.2. Technological advances
5.2.3. Better treatment outcomes
5.3. Restrains
5.3.1. High cost
5.4. Opportunities
5.4.1. Strategic investments by major players
5.5. Challenges
5.5.1. A lack of knowledge about certain types of dental treatment
6. Global Clear Aligners Market Analysis and Forecast, By Age
6.1. Segment Overview
6.2. Teenage
6.3. Adult
7. Global Clear Aligners Market Analysis and Forecast, By Material Type
7.1. Segment Overview
7.2. Polyurethane
7.3. Polyethylene Terephthalate Glycol
7.4. Others
8. Global Clear Aligners Market Analysis and Forecast, By End User
8.1. Segment Overview
8.2. Dental & orthodontic clinics
8.3. Hospitals
9. Global Clear Aligners Market Analysis and Forecast, By Regional Analysis
9.1. Segment Overview
9.2. North America
9.2.1. U.S.
9.2.2. Canada
9.2.3. Mexico
9.3. Europe
9.3.1. Germany
9.3.2. France
9.3.3. U.K.
9.3.4. Italy
9.3.5. Spain
9.4. Asia-Pacific
9.4.1. Japan
9.4.2. China
9.4.3. India
9.5. South America
9.5.1. Brazil
9.6. Middle East and Africa
9.6.1. UAE
9.6.2. South Africa
10. Global Clear Aligners Market-Competitive Landscape
10.1. Overview
10.2. Market Share of Key Players in Global Clear Aligners Market
10.2.1. Global Company Market Share
10.2.2. North America Company Market Share
10.2.3. Europe Company Market Share
10.2.4. APAC Company Market Share
10.3. Competitive Situations and Trends
10.3.1. Product Launches and Developments
10.3.2. Partnerships, Collaborations, and Agreements
10.3.3. Mergers & Acquisitions
10.3.4. Expansions
11. Company Profiles
11.1. 3M
11.1.1. Business Overview
11.1.2. Company Snapshot
11.1.3. Company Market Share Analysis
11.1.4. Company Product Portfolio
11.1.5. Recent Developments
11.1.6. SWOT Analysis
11.2. Align Technology, Inc.
11.2.1. Business Overview
11.2.2. Company Snapshot
11.2.3. Company Market Share Analysis
11.2.4. Company Product Portfolio
11.2.5. Recent Developments
11.2.6. SWOT Analysis
11.3. SCHEU DENTAL GmbH
11.3.1. Business Overview
11.3.2. Company Snapshot
11.3.3. Company Market Share Analysis
11.3.4. Company Product Portfolio
11.3.5. Recent Developments
11.3.6. SWOT Analysis
11.4. Ormco Corporation
11.4.1. Business Overview
11.4.2. Company Snapshot
11.4.3. Company Market Share Analysis
11.4.4. Company Product Portfolio
11.4.5. Recent Developments
11.4.6. SWOT Analysis
11.5. DynaFlex
11.5.1. Business Overview
11.5.2. Company Snapshot
11.5.3. Company Market Share Analysis
11.5.4. Company Product Portfolio
11.5.5. Recent Developments
11.5.6. SWOT Analysis
11.6. TP Orthodontics, Inc.
11.6.1. Business Overview
11.6.2. Company Snapshot
11.6.3. Company Market Share Analysis
11.6.4. Company Product Portfolio
11.6.5. Recent Developments
11.6.6. SWOT Analysis
11.7. Henry Schein Orthodontics
11.7.1. Business Overview
11.7.2. Company Snapshot
11.7.3. Company Market Share Analysis
11.7.4. Company Product Portfolio
11.7.5. Recent Developments
11.7.6. SWOT Analysis
11.8. Envista Holding Corporation
11.8.1. Business Overview
11.8.2. Company Snapshot
11.8.3. Company Market Share Analysis
11.8.4. Company Product Portfolio
11.8.5. Recent Developments
11.8.6. SWOT Analysis
11.9. Institut Straumann AG
11.9.1. Business Overview
11.9.2. Company Snapshot
11.9.3. Company Market Share Analysis
11.9.4. Company Product Portfolio
11.9.5. Recent Developments
11.9.6. SWOT Analysis
11.10. Dentsply Sirona
11.10.1. Business Overview
11.10.2. Company Snapshot
11.10.3. Company Market Share Analysis
11.10.4. Company Product Portfolio
11.10.5. Recent Developments
11.10.6. SWOT Analysis
11.11. Argen Corporation
11.11.1. Business Overview
11.11.2. Company Snapshot
11.11.3. Company Market Share Analysis
11.11.4. Company Product Portfolio
11.11.5. Recent Developments
11.11.6. SWOT Analysis
List of Table
1. Global Clear Aligners Market, By Age, 2020–2033 (USD Billion)
2. Global Teenage Clear Aligners Market, By Region, 2020–2033 (USD Billion)
3. Global Adult Clear Aligners Market, By Region, 2020–2033 (USD Billion)
4. Global Clear Aligners Market, By Material Type, 2020–2033 (USD Billion)
5. Global Polyurethane Clear Aligners Market, By Region, 2020–2033 (USD Billion)
6. Global Polyethylene Terephthalate Glycol Clear Aligners Market, By Region, 2020–2033 (USD Billion)
7. Global Others Clear Aligners Market, By Region, 2020–2033 (USD Billion)
8. Global Clear Aligners Market, By End User, 2020–2033 (USD Billion)
9. Global Dental & orthodontic clinics Clear Aligners Market, By Region, 2020–2033 (USD Billion)
10. Global Hospitals Clear Aligners Market, By Region, 2020–2033 (USD Billion)
11. Global Clear Aligners Market, By Region, 2020–2033 (USD Billion)
12. Global Clear Aligners Market, By North America, 2020–2033 (USD Billion)
13. North America Clear Aligners Market, By Age, 2020–2033 (USD Billion)
14. North America Clear Aligners Market, By Material Type, 2020–2033 (USD Billion)
15. North America Clear Aligners Market, By End User, 2020–2033 (USD Billion)
16. U.S. Clear Aligners Market, By Age, 2020–2033 (USD Billion)
17. U.S. Clear Aligners Market, By Material Type, 2020–2033 (USD Billion)
18. U.S. Clear Aligners Market, By End User, 2020–2033 (USD Billion)
19. Canada Clear Aligners Market, By Age, 2020–2033 (USD Billion)
20. Canada Clear Aligners Market, By Material Type, 2020–2033 (USD Billion)
21. Canada Clear Aligners Market, By End User, 2020–2033 (USD Billion)
22. Mexico Clear Aligners Market, By Age, 2020–2033 (USD Billion)
23. Mexico Clear Aligners Market, By Material Type, 2020–2033 (USD Billion)
24. Mexico Clear Aligners Market, By End User, 2020–2033 (USD Billion)
25. Europe Clear Aligners Market, By Age, 2020–2033 (USD Billion)
26. Europe Clear Aligners Market, By Material Type, 2020–2033 (USD Billion)
27. Europe Clear Aligners Market, By End User, 2020–2033 (USD Billion)
28. Germany Clear Aligners Market, By Age, 2020–2033 (USD Billion)
29. Germany Clear Aligners Market, By Material Type, 2020–2033 (USD Billion)
30. Germany Clear Aligners Market, By End User, 2020–2033 (USD Billion)
31. France Clear Aligners Market, By Age, 2020–2033 (USD Billion)
32. France Clear Aligners Market, By Material Type, 2020–2033 (USD Billion)
33. France Clear Aligners Market, By End User, 2020–2033 (USD Billion)
34. U.K. Clear Aligners Market, By Age, 2020–2033 (USD Billion)
35. U.K. Clear Aligners Market, By Material Type, 2020–2033 (USD Billion)
36. U.K. Clear Aligners Market, By End User, 2020–2033 (USD Billion)
37. Italy Clear Aligners Market, By Age, 2020–2033 (USD Billion)
38. Italy Clear Aligners Market, By Material Type, 2020–2033 (USD Billion)
39. Italy Clear Aligners Market, By End User, 2020–2033 (USD Billion)
40. Spain Clear Aligners Market, By Age, 2020–2033 (USD Billion)
41. Spain Clear Aligners Market, By Material Type, 2020–2033 (USD Billion)
42. Spain Clear Aligners Market, By End User, 2020–2033 (USD Billion)
43. Asia Pacific Clear Aligners Market, By Age, 2020–2033 (USD Billion)
44. Asia Pacific Clear Aligners Market, By Material Type, 2020–2033 (USD Billion)
45. Asia Pacific Clear Aligners Market, By End User, 2020–2033 (USD Billion)
46. Japan Clear Aligners Market, By Age, 2020–2033 (USD Billion)
47. Japan Clear Aligners Market, By Material Type, 2020–2033 (USD Billion)
48. Japan Clear Aligners Market, By End User, 2020–2033 (USD Billion)
49. China Clear Aligners Market, By Age, 2020–2033 (USD Billion)
50. China Clear Aligners Market, By Material Type, 2020–2033 (USD Billion)
51. China Clear Aligners Market, By End User, 2020–2033 (USD Billion)
52. India Clear Aligners Market, By Age, 2020–2033 (USD Billion)
53. India Clear Aligners Market, By Material Type, 2020–2033 (USD Billion)
54. India Clear Aligners Market, By End User, 2020–2033 (USD Billion)
55. South America Clear Aligners Market, By Age, 2020–2033 (USD Billion)
56. South America Clear Aligners Market, By Material Type, 2020–2033 (USD Billion)
57. South America Clear Aligners Market, By End User, 2020–2033 (USD Billion)
58. Brazil Clear Aligners Market, By Age, 2020–2033 (USD Billion)
59. Brazil Clear Aligners Market, By Material Type, 2020–2033 (USD Billion)
60. Brazil Clear Aligners Market, By End User, 2020–2033 (USD Billion)
61. Middle East and Africa Clear Aligners Market, By Age, 2020–2033 (USD Billion)
62. Middle East and Africa Clear Aligners Market, By Material Type, 2020–2033 (USD Billion)
63. Middle East and Africa Clear Aligners Market, By End User, 2020–2033 (USD Billion)
64. UAE Clear Aligners Market, By Age, 2020–2033 (USD Billion)
65. UAE Clear Aligners Market, By Material Type, 2020–2033 (USD Billion)
66. UAE Clear Aligners Market, By End User, 2020–2033 (USD Billion)
67. South Africa Clear Aligners Market, By Age, 2020–2033 (USD Billion)
68. South Africa Clear Aligners Market, By Material Type, 2020–2033 (USD Billion)
69. South Africa Clear Aligners Market, By End User, 2020–2033 (USD Billion)
List of Figures
1. Global Clear Aligners Market Segmentation
2. Clear Aligners Market: Research Methodology
3. Market Size Estimation Methodology: Bottom-Up Approach
4. Market Size Estimation Methodology: Top-Down Approach
5. Data Triangulation
6. Porter’s Five Forces Analysis
7. Value Chain Analysis
8. Global Clear Aligners Market Attractiveness Analysis By Age
9. Global Clear Aligners Market Attractiveness Analysis By Material Type
10. Global Clear Aligners Market Attractiveness Analysis By End User
11. Global Clear Aligners Market Attractiveness Analysis By Region
12. Global Clear Aligners Market: Dynamics
13. Global Clear Aligners Market Share By Age (2023 & 2033)
14. Global Clear Aligners Market Share By Material Type (2023 & 2033)
15. Global Clear Aligners Market Share By End User (2023 & 2033)
16. Global Clear Aligners Market Share by Regions (2023 & 2033)
17. Global Clear Aligners Market Share by Company (2023)
This study forecasts revenue at global, regional, and country levels from 2020 to 2033. The Brainy Insights has segmented the global clear aligners market based on below mentioned segments:
Global Clear Aligners Market by Age:
Global Clear Aligners Market by Material Type:
Global Clear Aligners Market by End-user:
Global Clear Aligners Market by Region:
Research has its special purpose to undertake marketing efficiently. In this competitive scenario, businesses need information across all industry verticals; the information about customer wants, market demand, competition, industry trends, distribution channels etc. This information needs to be updated regularly because businesses operate in a dynamic environment. Our organization, The Brainy Insights incorporates scientific and systematic research procedures in order to get proper market insights and industry analysis for overall business success. The analysis consists of studying the market from a miniscule level wherein we implement statistical tools which helps us in examining the data with accuracy and precision.
Our research reports feature both; quantitative and qualitative aspects for any market. Qualitative information for any market research process are fundamental because they reveal the customer needs and wants, usage and consumption for any product/service related to a specific industry. This in turn aids the marketers/investors in knowing certain perceptions of the customers. Qualitative research can enlighten about the different product concepts and designs along with unique service offering that in turn, helps define marketing problems and generate opportunities. On the other hand, quantitative research engages with the data collection process through interviews, e-mail interactions, surveys and pilot studies. Quantitative aspects for the market research are useful to validate the hypotheses generated during qualitative research method, explore empirical patterns in the data with the help of statistical tools, and finally make the market estimations.
The Brainy Insights offers comprehensive research and analysis, based on a wide assortment of factual insights gained through interviews with CXOs and global experts and secondary data from reliable sources. Our analysts and industry specialist assume vital roles in building up statistical tools and analysis models, which are used to analyse the data and arrive at accurate insights with exceedingly informative research discoveries. The data provided by our organization have proven precious to a diverse range of companies, facilitating them to address issues such as determining which products/services are the most appealing, whether or not customers use the product in the manner anticipated, the purchasing intentions of the market and many others.
Our research methodology encompasses an idyllic combination of primary and secondary initiatives. Key phases involved in this process are listed below:

The phase involves the gathering and collecting of market data and its related information with the help of different sources & research procedures.

The data procurement stage involves in data gathering and collecting through various data sources.
This stage involves in extensive research. These data sources includes:
Purchased Database: Purchased databases play a crucial role in estimating the market sizes irrespective of the domain. Our purchased database includes:
Primary Research: The Brainy Insights interacts with leading companies and experts of the concerned domain to develop the analyst team’s market understanding and expertise. It improves and substantiates every single data presented in the market reports. Primary research mainly involves in telephonic interviews, E-mail interactions and face-to-face interviews with the raw material providers, manufacturers/producers, distributors, & independent consultants. The interviews that we conduct provides valuable data on market size and industry growth trends prevailing in the market. Our organization also conducts surveys with the various industry experts in order to gain overall insights of the industry/market. For instance, in healthcare industry we conduct surveys with the pharmacists, doctors, surgeons and nurses in order to gain insights and key information of a medical product/device/equipment which the customers are going to usage. Surveys are conducted in the form of questionnaire designed by our own analyst team. Surveys plays an important role in primary research because surveys helps us to identify the key target audiences of the market. Additionally, surveys helps to identify the key target audience engaged with the market. Our survey team conducts the survey by targeting the key audience, thus gaining insights from them. Based on the perspectives of the customers, this information is utilized to formulate market strategies. Moreover, market surveys helps us to understand the current competitive situation of the industry. To be precise, our survey process typically involve with the 360 analysis of the market. This analytical process begins by identifying the prospective customers for a product or service related to the market/industry to obtain data on how a product/service could fit into customers’ lives.

Secondary Research: The secondary data sources includes information published by the on-profit organizations such as World bank, WHO, company fillings, investor presentations, annual reports, national government documents, statistical databases, blogs, articles, white papers and others. From the annual report, we analyse a company’s revenue to understand the key segment and market share of that organization in a particular region. We analyse the company websites and adopt the product mapping technique which is important for deriving the segment revenue. In the product mapping method, we select and categorize the products offered by the companies catering to domain specific market, deduce the product revenue for each of the companies so as to get overall estimation of the market size. We also source data and analyses trends based on information received from supply side and demand side intermediaries in the value chain. The supply side denotes the data gathered from supplier, distributor, wholesaler and the demand side illustrates the data gathered from the end customers for respective market domain.

The supply side for a domain specific market is analysed by:
The demand side for the market is estimated through:
In-house Library: Apart from these third-party sources, we have our in-house library of qualitative and quantitative information. Our in-house database includes market data for various industry and domains. These data are updated on regular basis as per the changing market scenario. Our library includes, historic databases, internal audit reports and archives.
Sometimes there are instances where there is no metadata or raw data available for any domain specific market. For those cases, we use our expertise to forecast and estimate the market size in order to generate comprehensive data sets. Our analyst team adopt a robust research technique in order to produce the estimates:
Data Synthesis: This stage involves the analysis & mapping of all the information obtained from the previous step. It also involves in scrutinizing the data for any discrepancy observed while data gathering related to the market. The data is collected with consideration to the heterogeneity of sources. Robust scientific techniques are in place for synthesizing disparate data sets and provide the essential contextual information that can orient market strategies. The Brainy Insights has extensive experience in data synthesis where the data passes through various stages:


Market Deduction & Formulation: The final stage comprises of assigning data points at appropriate market spaces so as to deduce feasible conclusions. Analyst perspective & subject matter expert based holistic form of market sizing coupled with industry analysis also plays a crucial role in this stage.
This stage involves in finalization of the market size and numbers that we have collected from data integration step. With data interpolation, it is made sure that there is no gap in the market data. Successful trend analysis is done by our analysts using extrapolation techniques, which provide the best possible forecasts for the market.
Data Validation & Market Feedback: Validation is the most important step in the process. Validation & re-validation via an intricately designed process helps us finalize data-points to be used for final calculations.

The Brainy Insights interacts with leading companies and experts of the concerned domain to develop the analyst team’s market understanding and expertise. It improves and substantiates every single data presented in the market reports. The data validation interview and discussion panels are typically composed of the most experienced industry members. The participants include, however, are not limited to:
Moreover, we always validate our data and findings through primary respondents from all the major regions we are working on.
Free Customization
Fortune 500 Clients
Free Yearly Update On Purchase Of Multi/Corporate License
Companies Served Till Date