- +1-315-215-1633
- sales@thebrainyinsights.com

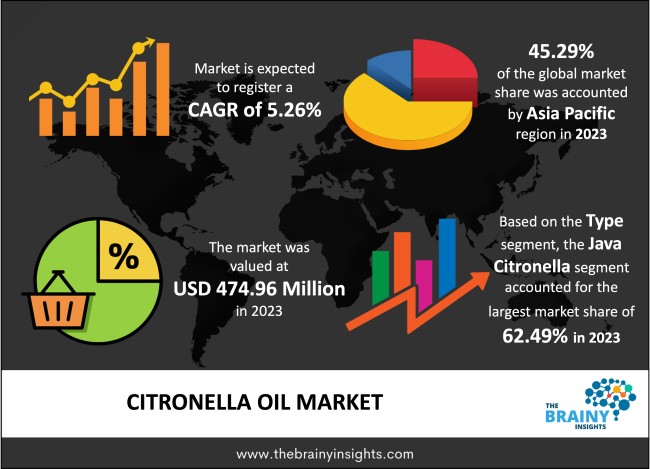
The global Citronella Oil market generated USD 474.96 Million revenue in 2023 and is projected to grow at a CAGR of 5.26% from 2024 to 2033. The market is expected to reach USD 793.03 Million by 2033. The market expansion is due to greater spending on expensive scents as more consumers achieve higher working capabilities and increased living standards. On the same note, the market has called for more biochemical agencies to control pests within agricultural land. This trend is expected to present growth opportunities for the citronella oil market in the forecasted years.
Citronella oil is an essential oil acquired from several types of citronella grass from which citronella water is processed: Cymbopogon nardus and Cymbopogon winterianus. It has to be noted that this oil is produced using steam distillation of the fresh or dried leaves of these grasses. With an aroma similar to citrus fruits, citronella oil is versatile and utilized in many industries. Citronella oil is famous for its fragrance, characterized by a citrusy freshening smell, which makes it used in almost all industries. Citronella oil is admired in fragrances and cosmetics as it smells pleasant. It is used as a part of certain fragrances, soaps, oily solutions, and lotions applied to the skin to make it feel fresher and more active. Some of the more apparent uses include its use as a natural insecticide, considered the best, if not among the most effective, types. The extract also has citronellal and geraniol, which act as essential oils that chase away mosquitoes and other insects. For this reason, citronella oil is often applied to repel outdoor candles, controversial sprays, lotions, and diffusers and, in the end, to solve insect problems. Besides its property of giving off fragrance and keeping insects at bay, citronella oil is precisely attributed to the therapeutic wonders in aromatherapy treatment. Research has indicated that introducing citronella oil as an aerosol significantly reduces feelings of stress among its users. Furthermore, citronella oil has also received consideration in recent years as it is a more ‘green chemical’ option than a synthetic repellent. That makes it biodegradable and renewable and thus provides an environmentally friendly solution to people looking for a natural way to handle pests. Moreover, citronella oil is an all-around essential oil with a good smell and other qualities, such as repelling insects and medical benefits in personal care products and pest control requirements.
Get an overview of this study by requesting a free sample
1. Introduction
1.1. Objectives of the Study
1.2. Market Definition
1.3. Research Scope
1.4. Currency
1.5. Key Target Audience
2. Research Methodology and Assumptions
3. Executive Summary
4. Premium Insights
4.1. Porter’s Five Forces Analysis
4.2. Value Chain Analysis
4.3. Top Investment Pockets
4.3.1. Market Attractiveness Analysis By Type
4.3.2. Market Attractiveness Analysis By Grade
4.3.3. Market Attractiveness Analysis By Application
4.3.4. Market Attractiveness Analysis By Region
4.4. Industry Trends
5. Market Dynamics
5.1. Market Evaluation
5.2. Drivers
5.2.1. Increasing Demand for Natural and Organic Products
5.2.2. Rising Awareness About Health Benefits
5.3. Restraints
5.3.1. Fluctuating Raw Material Prices
5.4. Opportunities
5.4.1. Expansion in Emerging Markets
5.4.2. Innovation in Product Development
5.5. Challenges
5.5.1. Competition from Synthetic Alternatives
6. Global Citronella Oil Market Analysis and Forecast, By Type
6.1. Segment Overview
6.2. Ceylon Citronella
6.3. Java Citronella
7. Global Citronella Oil Market Analysis and Forecast, By Grade
7.1. Segment Overview
7.2. Aromatherapy
7.3. Food Grade
7.4. Others
8. Global Citronella Oil Market Analysis and Forecast, By Application
8.1. Segment Overview
8.2. Cosmetic
8.3. Detergent
8.4. Perfume
8.5. Food
8.6. Pharmaceutical
8.7. Others
9. Global Citronella Oil Market Analysis and Forecast, By Regional Analysis
9.1. Segment Overview
9.2. North America
9.2.1. U.S.
9.2.2. Canada
9.2.3. Mexico
9.3. Europe
9.3.1. Germany
9.3.2. France
9.3.3. U.K.
9.3.4. Italy
9.3.5. Spain
9.4. Asia-Pacific
9.4.1. Japan
9.4.2. China
9.4.3. India
9.5. South America
9.5.1. Brazil
9.6. Middle East and Africa
9.6.1. UAE
9.6.2. South Africa
10. Global Citronella Oil Market-Competitive Landscape
10.1. Overview
10.2. Market Share of Key Players in the Citronella Oil Market
10.2.1. Global Company Market Share
10.2.2. North America Company Market Share
10.2.3. Europe Company Market Share
10.2.4. APAC Company Market Share
10.3. Competitive Situations and Trends
10.3.1. Product Launches and Developments
10.3.2. Partnerships, Collaborations, and Agreements
10.3.3. Mergers & Acquisitions
10.3.4. Expansions
11. Company Profiles
11.1. Ancient Living Products Private Limited
11.1.1. Business Overview
11.1.2. Company Snapshot
11.1.3. Company Market Share Analysis
11.1.4. Company Product Portfolio
11.1.5. Recent Developments
11.1.6. SWOT Analysis
11.2. Artizen Oils
11.2.1. Business Overview
11.2.2. Company Snapshot
11.2.3. Company Market Share Analysis
11.2.4. Company Product Portfolio
11.2.5. Recent Developments
11.2.6. SWOT Analysis
11.3. Aroma Treasures
11.3.1. Business Overview
11.3.2. Company Snapshot
11.3.3. Company Market Share Analysis
11.3.4. Company Product Portfolio
11.3.5. Recent Developments
11.3.6. SWOT Analysis
11.4. BRM Essential Oils
11.4.1. Business Overview
11.4.2. Company Snapshot
11.4.3. Company Market Share Analysis
11.4.4. Company Product Portfolio
11.4.5. Recent Developments
11.4.6. SWOT Analysis
11.5. doTERRA International
11.5.1. Business Overview
11.5.2. Company Snapshot
11.5.3. Company Market Share Analysis
11.5.4. Company Product Portfolio
11.5.5. Recent Developments
11.5.6. SWOT Analysis
11.6. Greenleaf Extractions Pvt. Ltd.
11.6.1. Business Overview
11.6.2. Company Snapshot
11.6.3. Company Market Share Analysis
11.6.4. Company Product Portfolio
11.6.5. Recent Developments
11.6.6. SWOT Analysis
11.7. Inatur Herbals
11.7.1. Business Overview
11.7.2. Company Snapshot
11.7.3. Company Market Share Analysis
11.7.4. Company Product Portfolio
11.7.5. Recent Developments
11.7.6. SWOT Analysis
11.8. Khadi Pure Gramodyog
11.8.1. Business Overview
11.8.2. Company Snapshot
11.8.3. Company Market Share Analysis
11.8.4. Company Product Portfolio
11.8.5. Recent Developments
11.8.6. SWOT Analysis
11.9. Kanta-group
11.9.1. Business Overview
11.9.2. Company Snapshot
11.9.3. Company Market Share Analysis
11.9.4. Company Product Portfolio
11.9.5. Recent Developments
11.9.6. SWOT Analysis
11.10. Kama Ayurveda
11.10.1. Business Overview
11.10.2. Company Snapshot
11.10.3. Company Market Share Analysis
11.10.4. Company Product Portfolio
11.10.5. Recent Developments
11.10.6. SWOT Analysis
11.11. Mesmara Botanics Private Limited
11.11.1. Business Overview
11.11.2. Company Snapshot
11.11.3. Company Market Share Analysis
11.11.4. Company Product Portfolio
11.11.5. Recent Developments
11.11.6. SWOT Analysis
11.12. Meena Perfumery
11.12.1. Business Overview
11.12.2. Company Snapshot
11.12.3. Company Market Share Analysis
11.12.4. Company Product Portfolio
11.12.5. Recent Developments
11.12.6. SWOT Analysis
11.13. Organic Harvest
11.13.1. Business Overview
11.13.2. Company Snapshot
11.13.3. Company Market Share Analysis
11.13.4. Company Product Portfolio
11.13.5. Recent Developments
11.13.6. SWOT Analysis
11.14. Plant Therapy
11.14.1. Business Overview
11.14.2. Company Snapshot
11.14.3. Company Market Share Analysis
11.14.4. Company Product Portfolio
11.14.5. Recent Developments
11.14.6. SWOT Analysis
11.15. PT Karimun Kencana Aromatics
11.15.1. Business Overview
11.15.2. Company Snapshot
11.15.3. Company Market Share Analysis
11.15.4. Company Product Portfolio
11.15.5. Recent Developments
11.15.6. SWOT Analysis
11.16. The Essential Oils Company
11.16.1. Business Overview
11.16.2. Company Snapshot
11.16.3. Company Market Share Analysis
11.16.4. Company Product Portfolio
11.16.5. Recent Developments
11.16.6. SWOT Analysis
11.17. VanAroma
11.17.1. Business Overview
11.17.2. Company Snapshot
11.17.3. Company Market Share Analysis
11.17.4. Company Product Portfolio
11.17.5. Recent Developments
11.17.6. SWOT Analysis
11.18. Young Living Essential Oils
11.18.1. Business Overview
11.18.2. Company Snapshot
11.18.3. Company Market Share Analysis
11.18.4. Company Product Portfolio
11.18.5. Recent Developments
11.18.6. SWOT Analysis
11.19. Yunnan Aroma Source Manufacturing Co. Ltd.
11.19.1. Business Overview
11.19.2. Company Snapshot
11.19.3. Company Market Share Analysis
11.19.4. Company Product Portfolio
11.19.5. Recent Developments
11.19.6. SWOT Analysis
List of Table
1. Global Citronella Oil Market, By Type, 2020-2033 (USD Million) (Tons)
2. Global Ceylon Citronella, Citronella Oil Market, By Region, 2020-2033 (USD Million) (Tons)
3. Global Java Citronella, Citronella Oil Market, By Region, 2020-2033 (USD Million) (Tons)
4. Global Citronella Oil Market, By Grade, 2020-2033 (USD Million) (Tons)
5. Global Aromatherapy, Citronella Oil Market, By Region, 2020-2033 (USD Million) (Tons)
6. Global Food Grade, Citronella Oil Market, By Region, 2020-2033 (USD Million) (Tons)
7. Global Others, Citronella Oil Market, By Region, 2020-2033 (USD Million) (Tons)
8. Global Citronella Oil Market, By Application, 2020-2033 (USD Million) (Tons)
9. Global Cosmetic, Citronella Oil Market, By Region, 2020-2033 (USD Million) (Tons)
10. Global Detergent, Citronella Oil Market, By Region, 2020-2033 (USD Million) (Tons)
11. Global Perfume, Citronella Oil Market, By Region, 2020-2033 (USD Million) (Tons)
12. Global Food, Citronella Oil Market, By Region, 2020-2033 (USD Million) (Tons)
13. Global Pharmaceutical, Citronella Oil Market, By Region, 2020-2033 (USD Million) (Tons)
14. Global Others, Citronella Oil Market, By Region, 2020-2033 (USD Million) (Tons)
15. Global Citronella Oil Market, By Region, 2020-2033 (USD Million) (Tons)
16. North America Citronella Oil Market, By Type, 2020-2033 (USD Million) (Tons)
17. North America Citronella Oil Market, By Grade, 2020-2033 (USD Million) (Tons)
18. North America Citronella Oil Market, By Application, 2020-2033 (USD Million) (Tons)
19. U.S. Citronella Oil Market, By Type, 2020-2033 (USD Million) (Tons)
20. U.S. Citronella Oil Market, By Grade, 2020-2033 (USD Million) (Tons)
21. U.S. Citronella Oil Market, By Application, 2020-2033 (USD Million) (Tons)
22. Canada Citronella Oil Market, By Type, 2020-2033 (USD Million) (Tons)
23. Canada Citronella Oil Market, By Grade, 2020-2033 (USD Million) (Tons)
24. Canada Citronella Oil Market, By Application, 2020-2033 (USD Million) (Tons)
25. Mexico Citronella Oil Market, By Type, 2020-2033 (USD Million) (Tons)
26. Mexico Citronella Oil Market, By Grade, 2020-2033 (USD Million) (Tons)
27. Mexico Citronella Oil Market, By Application, 2020-2033 (USD Million) (Tons)
28. Europe Citronella Oil Market, By Type, 2020-2033 (USD Million) (Tons)
29. Europe Citronella Oil Market, By Grade, 2020-2033 (USD Million) (Tons)
30. Europe Citronella Oil Market, By Application, 2020-2033 (USD Million) (Tons)
31. Germany Citronella Oil Market, By Type, 2020-2033 (USD Million) (Tons)
32. Germany Citronella Oil Market, By Grade, 2020-2033 (USD Million) (Tons)
33. Germany Citronella Oil Market, By Application, 2020-2033 (USD Million) (Tons)
34. France Citronella Oil Market, By Type, 2020-2033 (USD Million) (Tons)
35. France Citronella Oil Market, By Grade, 2020-2033 (USD Million) (Tons)
36. France Citronella Oil Market, By Application, 2020-2033 (USD Million) (Tons)
37. U.K. Citronella Oil Market, By Type, 2020-2033 (USD Million) (Tons)
38. U.K. Citronella Oil Market, By Grade, 2020-2033 (USD Million) (Tons)
39. U.K. Citronella Oil Market, By Application, 2020-2033 (USD Million) (Tons)
40. Italy Citronella Oil Market, By Type, 2020-2033 (USD Million) (Tons)
41. Italy Citronella Oil Market, By Grade, 2020-2033 (USD Million) (Tons)
42. Italy Citronella Oil Market, By Application, 2020-2033 (USD Million) (Tons)
43. Spain Citronella Oil Market, By Type, 2020-2033 (USD Million) (Tons)
44. Spain Citronella Oil Market, By Grade, 2020-2033 (USD Million) (Tons)
45. Spain Citronella Oil Market, By Application, 2020-2033 (USD Million) (Tons)
46. Asia Pacific Citronella Oil Market, By Type, 2020-2033 (USD Million) (Tons)
47. Asia Pacific Citronella Oil Market, By Grade, 2020-2033 (USD Million) (Tons)
48. Asia Pacific Citronella Oil Market, By Application, 2020-2033 (USD Million) (Tons)
49. Japan Citronella Oil Market, By Type, 2020-2033 (USD Million) (Tons)
50. Japan Citronella Oil Market, By Grade, 2020-2033 (USD Million) (Tons)
51. Japan Citronella Oil Market, By Application, 2020-2033 (USD Million) (Tons)
52. China Citronella Oil Market, By Type, 2020-2033 (USD Million) (Tons)
53. China Citronella Oil Market, By Grade, 2020-2033 (USD Million) (Tons)
54. China Citronella Oil Market, By Application, 2020-2033 (USD Million) (Tons)
55. India Citronella Oil Market, By Type, 2020-2033 (USD Million) (Tons)
56. India Citronella Oil Market, By Grade, 2020-2033 (USD Million) (Tons)
57. India Citronella Oil Market, By Application, 2020-2033 (USD Million) (Tons)
58. South America Citronella Oil Market, By Type, 2020-2033 (USD Million) (Tons)
59. South America Citronella Oil Market, By Grade, 2020-2033 (USD Million) (Tons)
60. South America Citronella Oil Market, By Application, 2020-2033 (USD Million) (Tons)
61. Brazil Citronella Oil Market, By Type, 2020-2033 (USD Million) (Tons)
62. Brazil Citronella Oil Market, By Grade, 2020-2033 (USD Million) (Tons)
63. Brazil Citronella Oil Market, By Application, 2020-2033 (USD Million) (Tons)
64. Middle East and Africa Citronella Oil Market, By Type, 2020-2033 (USD Million) (Tons)
65. Middle East and Africa Citronella Oil Market, By Grade, 2020-2033 (USD Million) (Tons)
66. Middle East and Africa Citronella Oil Market, By Application, 2020-2033 (USD Million) (Tons)
67. UAE Citronella Oil Market, By Type, 2020-2033 (USD Million) (Tons)
68. UAE Citronella Oil Market, By Grade, 2020-2033 (USD Million) (Tons)
69. UAE Citronella Oil Market, By Application, 2020-2033 (USD Million) (Tons)
70. South Africa Citronella Oil Market, By Type, 2020-2033 (USD Million) (Tons)
71. South Africa Citronella Oil Market, By Grade, 2020-2033 (USD Million) (Tons)
72. South Africa Citronella Oil Market, By Application, 2020-2033 (USD Million) (Tons)
List of Figures
1. Global Citronella Oil Market Segmentation
2. Citronella Oil Market: Research Methodology
3. Market Size Estimation Methodology: Bottom-Up Approach
4. Market Size Estimation Methodology: Top-Down Approach
5. Data Triangulation
6. Porter’s Five Forces Analysis
7. Value Chain Analysis
8. Global Citronella Oil Market Attractiveness Analysis By Type
9. Global Citronella Oil Market Attractiveness Analysis By Grade
10. Global Citronella Oil Market Attractiveness Analysis By Application
11. Global Citronella Oil Market Attractiveness Analysis by Region
12. Global Citronella Oil Market: Dynamics
13. Global Citronella Oil Market Share By Type (2024 & 2033)
14. Global Citronella Oil Market Share By Grade (2024 & 2033)
15. Global Citronella Oil Market Share By Application (2024 & 2033)
16. Global Citronella Oil Market Share by Regions (2024 & 2033)
17. Global Citronella Oil Market Share by Company (2023)
This study forecasts revenue at global, regional, and country levels from 2020 to 2033. The Brainy Insights has segmented the global Citronella Oil market based on below-mentioned segments:
Global Citronella Oil Market by Type:
Global Citronella Oil Market by Grade:
Global Citronella Oil Market by Application:
Global Citronella Oil Market by Region:
Research has its special purpose to undertake marketing efficiently. In this competitive scenario, businesses need information across all industry verticals; the information about customer wants, market demand, competition, industry trends, distribution channels etc. This information needs to be updated regularly because businesses operate in a dynamic environment. Our organization, The Brainy Insights incorporates scientific and systematic research procedures in order to get proper market insights and industry analysis for overall business success. The analysis consists of studying the market from a miniscule level wherein we implement statistical tools which helps us in examining the data with accuracy and precision.
Our research reports feature both; quantitative and qualitative aspects for any market. Qualitative information for any market research process are fundamental because they reveal the customer needs and wants, usage and consumption for any product/service related to a specific industry. This in turn aids the marketers/investors in knowing certain perceptions of the customers. Qualitative research can enlighten about the different product concepts and designs along with unique service offering that in turn, helps define marketing problems and generate opportunities. On the other hand, quantitative research engages with the data collection process through interviews, e-mail interactions, surveys and pilot studies. Quantitative aspects for the market research are useful to validate the hypotheses generated during qualitative research method, explore empirical patterns in the data with the help of statistical tools, and finally make the market estimations.
The Brainy Insights offers comprehensive research and analysis, based on a wide assortment of factual insights gained through interviews with CXOs and global experts and secondary data from reliable sources. Our analysts and industry specialist assume vital roles in building up statistical tools and analysis models, which are used to analyse the data and arrive at accurate insights with exceedingly informative research discoveries. The data provided by our organization have proven precious to a diverse range of companies, facilitating them to address issues such as determining which products/services are the most appealing, whether or not customers use the product in the manner anticipated, the purchasing intentions of the market and many others.
Our research methodology encompasses an idyllic combination of primary and secondary initiatives. Key phases involved in this process are listed below:

The phase involves the gathering and collecting of market data and its related information with the help of different sources & research procedures.

The data procurement stage involves in data gathering and collecting through various data sources.
This stage involves in extensive research. These data sources includes:
Purchased Database: Purchased databases play a crucial role in estimating the market sizes irrespective of the domain. Our purchased database includes:
Primary Research: The Brainy Insights interacts with leading companies and experts of the concerned domain to develop the analyst team’s market understanding and expertise. It improves and substantiates every single data presented in the market reports. Primary research mainly involves in telephonic interviews, E-mail interactions and face-to-face interviews with the raw material providers, manufacturers/producers, distributors, & independent consultants. The interviews that we conduct provides valuable data on market size and industry growth trends prevailing in the market. Our organization also conducts surveys with the various industry experts in order to gain overall insights of the industry/market. For instance, in healthcare industry we conduct surveys with the pharmacists, doctors, surgeons and nurses in order to gain insights and key information of a medical product/device/equipment which the customers are going to usage. Surveys are conducted in the form of questionnaire designed by our own analyst team. Surveys plays an important role in primary research because surveys helps us to identify the key target audiences of the market. Additionally, surveys helps to identify the key target audience engaged with the market. Our survey team conducts the survey by targeting the key audience, thus gaining insights from them. Based on the perspectives of the customers, this information is utilized to formulate market strategies. Moreover, market surveys helps us to understand the current competitive situation of the industry. To be precise, our survey process typically involve with the 360 analysis of the market. This analytical process begins by identifying the prospective customers for a product or service related to the market/industry to obtain data on how a product/service could fit into customers’ lives.

Secondary Research: The secondary data sources includes information published by the on-profit organizations such as World bank, WHO, company fillings, investor presentations, annual reports, national government documents, statistical databases, blogs, articles, white papers and others. From the annual report, we analyse a company’s revenue to understand the key segment and market share of that organization in a particular region. We analyse the company websites and adopt the product mapping technique which is important for deriving the segment revenue. In the product mapping method, we select and categorize the products offered by the companies catering to domain specific market, deduce the product revenue for each of the companies so as to get overall estimation of the market size. We also source data and analyses trends based on information received from supply side and demand side intermediaries in the value chain. The supply side denotes the data gathered from supplier, distributor, wholesaler and the demand side illustrates the data gathered from the end customers for respective market domain.

The supply side for a domain specific market is analysed by:
The demand side for the market is estimated through:
In-house Library: Apart from these third-party sources, we have our in-house library of qualitative and quantitative information. Our in-house database includes market data for various industry and domains. These data are updated on regular basis as per the changing market scenario. Our library includes, historic databases, internal audit reports and archives.
Sometimes there are instances where there is no metadata or raw data available for any domain specific market. For those cases, we use our expertise to forecast and estimate the market size in order to generate comprehensive data sets. Our analyst team adopt a robust research technique in order to produce the estimates:
Data Synthesis: This stage involves the analysis & mapping of all the information obtained from the previous step. It also involves in scrutinizing the data for any discrepancy observed while data gathering related to the market. The data is collected with consideration to the heterogeneity of sources. Robust scientific techniques are in place for synthesizing disparate data sets and provide the essential contextual information that can orient market strategies. The Brainy Insights has extensive experience in data synthesis where the data passes through various stages:


Market Deduction & Formulation: The final stage comprises of assigning data points at appropriate market spaces so as to deduce feasible conclusions. Analyst perspective & subject matter expert based holistic form of market sizing coupled with industry analysis also plays a crucial role in this stage.
This stage involves in finalization of the market size and numbers that we have collected from data integration step. With data interpolation, it is made sure that there is no gap in the market data. Successful trend analysis is done by our analysts using extrapolation techniques, which provide the best possible forecasts for the market.
Data Validation & Market Feedback: Validation is the most important step in the process. Validation & re-validation via an intricately designed process helps us finalize data-points to be used for final calculations.

The Brainy Insights interacts with leading companies and experts of the concerned domain to develop the analyst team’s market understanding and expertise. It improves and substantiates every single data presented in the market reports. The data validation interview and discussion panels are typically composed of the most experienced industry members. The participants include, however, are not limited to:
Moreover, we always validate our data and findings through primary respondents from all the major regions we are working on.
Free Customization
Fortune 500 Clients
Free Yearly Update On Purchase Of Multi/Corporate License
Companies Served Till Date