- +1-315-215-1633
- sales@thebrainyinsights.com

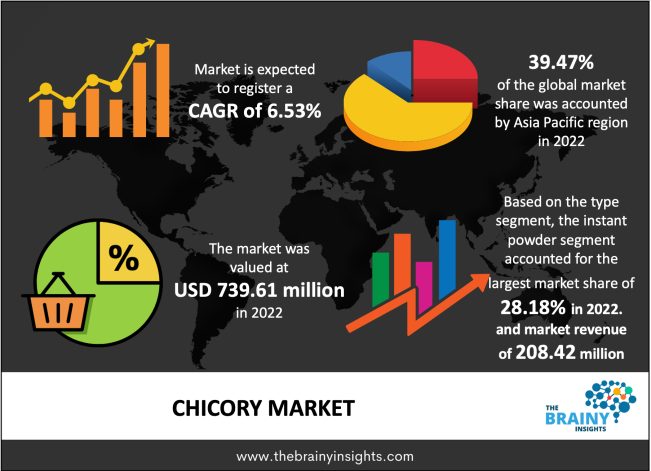
The global chicory market was valued at USD 739.61 million in 2022, increasing at a CAGR of 6.53% from 2022 to 2030 and anticipated to reach USD 1226.81 million by 2030. Europe is expected to grow the fastest during the forecast period. Furthermore, during the COVID-19 epidemic, the intake of ready-to-drink and ready-to-mix drinks has increased dramatically. The most famous examples are juices, coffee, and flavoured milk. The work-from-home (WFH) culture grew in popularity due to curfews and lockdowns. This resulted in raised household consumption of coffee. The amount of chicory initially added to coffee powder has risen to cater to the augmented demand for coffee. Hence, the industry has seen an increase during the forecast period. Additionally, due to the increasing prices of coffee, most people were noticed switching towards chicory coffee powders during the COVID-19 epidemic.
Chicory is also a rich source of beta-carotene. Chicory root has a mild laxative effect and decreases swelling. Chicory is primarily used for its health advantages and application in the food and beverage industry. Chicory can be used for the treatment of constipation, loss of appetite, arthritis pain, high blood pressure, gallbladder disorders, cancer, and other health conditions. Chicory has also gained immense popularity in animal feed additives as a prebiotic ingredient and a substitute for antibiotics to promote health and prevent illness. Chicory root extract & chicory seed are safe when used as medicine, short-term. Chicory is used for constipation, loss of appetite, upset stomach, liver and gallbladder disorders, cancer, and rapid heartbeat. Chicory is also a "tonic" to protect the liver, increase urine production, and balance coffee's stimulant effect. In foods, chicory leaves are usually eaten like celery, and the roots & leaf buds are eaten and boiled. Coffee mixes usually contain ground chicory to enhance the richness of the coffee.
Get an overview of this study by requesting a free sample
For example, in May 2021, Cosucra Groupe Warcoing S.A., a Belgian group, launched its chicory root ingredients under the names Swelite, Fibruline, Pisane, Nastar- the key pea component brands offered by the firm.
1. Introduction
1.1. Objectives of the Study
1.2. Market Definition
1.3. Research Scope
1.4. Currency
1.5. Key Target Audience
2. Research Methodology and Assumptions
3. Executive Summary
4. Premium Insights
4.1. Porter’s Five Forces Analysis
4.2. Value Chain Analysis
4.3. Top Investment Pockets
4.3.1. Market Attractiveness Analysis By Form
4.3.2. Market Attractiveness Analysis By Type
4.3.3. Market Attractiveness Analysis By Plant-Part
4.3.4. Market Attractiveness Analysis By Application
4.3.5. Market Attractiveness Analysis By Region
4.4. Industry Trends
5. Market Dynamics
5.1. Market Evaluation
5.2. Drivers
5.2.1. The increasing usage of chicory in various industries
5.2.2. The rising demand for natural ingredients and products
5.2.3. The growing demand for sugar alternatives
5.2.4. The increasing demand for chicory inulin
5.3. Restraints
5.3.1. The lack of consumer awareness
5.3.2. The health risks associated with excessive consumption of chicory
5.4. Opportunities
5.4.1. The technological advancements and developments of improved systems
5.4.2. The growth in applications of chicory across various industries
6. Global Chicory Market Analysis and Forecast, By Form
6.1. Segment Overview
6.2. Liquid
6.3. Cubes
6.4. Powder
6.5. Others
7. Global Chicory Market Analysis and Forecast, By Type
7.1. Segment Overview
7.2. Flour
7.3. Roasted
7.4. Instant Powder
7.5. Extracts
7.6. Others
8. Global Chicory Market Analysis and Forecast, By Plant-Part
8.1. Segment Overview
8.2. Root
8.3. Leaf
8.4. Others
9. Global Chicory Market Analysis and Forecast, By Application
9.1. Segment Overview
9.2. Dietary Supplements
9.3. Food & Beverages
9.4. Cosmetics & Personal Care
9.5. Feed & Pet Food
10. Global Chicory Market Analysis and Forecast, By Regional Analysis
10.1. Segment Overview
10.2. North America
10.2.1. U.S.
10.2.2. Canada
10.2.3. Mexico
10.3. Europe
10.3.1. Germany
10.3.2. France
10.3.3. U.K.
10.3.4. Italy
10.3.5. Spain
10.4. Asia-Pacific
10.4.1. Japan
10.4.2. China
10.4.3. India
10.5. South America
10.5.1. Brazil
10.6. Middle East and Africa
10.6.1. UAE
10.6.2. South Africa
11. Global Chicory Market-Competitive Landscape
11.1. Overview
11.2. Market Share of Key Players in Global Chicory Market
11.2.1. Global Company Market Share
11.2.2. North America Company Market Share
11.2.3. Europe Company Market Share
11.2.4. APAC Company Market Share
11.3. Competitive Situations and Trends
11.3.1. Product Launches and Developments
11.3.2. Partnerships, Collaborations, and Agreements
11.3.3. Mergers & Acquisitions
11.3.4. Expansions
12. Company Profiles
12.1. Wilmar Delecto Foods Pvt Ltd
12.1.1. Business Overview
12.1.2. Company Snapshot
12.1.3. Company Market Share Analysis
12.1.4. Company Product Portfolio
12.1.5. Recent Developments
12.1.6. SWOT Analysis
12.2. Cargill Incorporated
12.2.1. Business Overview
12.2.2. Company Snapshot
12.2.3. Company Market Share Analysis
12.2.4. Company Product Portfolio
12.2.5. Recent Developments
12.2.6. SWOT Analysis
12.3. Pioneer Chicory
12.3.1. Business Overview
12.3.2. Company Snapshot
12.3.3. Company Market Share Analysis
12.3.4. Company Product Portfolio
12.3.5. Recent Developments
12.3.6. SWOT Analysis
12.4. Starwest Botanicals
12.4.1. Business Overview
12.4.2. Company Snapshot
12.4.3. Company Market Share Analysis
12.4.4. Company Product Portfolio
12.4.5. Recent Developments
12.4.6. SWOT Analysis
12.5. Leroux
12.5.1. Business Overview
12.5.2. Company Snapshot
12.5.3. Company Market Share Analysis
12.5.4. Company Product Portfolio
12.5.5. Recent Developments
12.5.6. SWOT Analysis
12.6. Organic Herb Trading Co.
12.6.1. Business Overview
12.6.2. Company Snapshot
12.6.3. Company Market Share Analysis
12.6.4. Company Product Portfolio
12.6.5. Recent Developments
12.6.6. SWOT Analysis
12.7. Nature’s Gold Production
12.7.1. Business Overview
12.7.2. Company Snapshot
12.7.3. Company Market Share Analysis
12.7.4. Company Product Portfolio
12.7.5. Recent Developments
12.7.6. SWOT Analysis
12.8. Jamnagar Chicory Industries
12.8.1. Business Overview
12.8.2. Company Snapshot
12.8.3. Company Market Share Analysis
12.8.4. Company Product Portfolio
12.8.5. Recent Developments
12.8.6. SWOT Analysis
12.9. STOKROS Company Ltd
12.9.1. Business Overview
12.9.2. Company Snapshot
12.9.3. Company Market Share Analysis
12.9.4. Company Product Portfolio
12.9.5. Recent Developments
12.9.6. SWOT Analysis
12.10. FARMVILLE
12.10.1. Business Overview
12.10.2. Company Snapshot
12.10.3. Company Market Share Analysis
12.10.4. Company Product Portfolio
12.10.5. Recent Developments
12.10.6. SWOT Analysis
List of Table
1. Global Chicory Market, By Form, 2019-2030 (USD Million)
2. Global Liquid, Chicory Market, By Region, 2019-2030 (USD Million)
3. Global Cubes, Chicory Market, By Region, 2019-2030 (USD Million)
4. Global Powder, Chicory Market, By Region, 2019-2030 (USD Million)
5. Global Others, Chicory Market, By Region, 2019-2030 (USD Million)
6. Global Chicory Market, By Type, 2019-2030 (USD Million)
7. Global Flour, Chicory Market, By Region, 2019-2030 (USD Million)
8. Global Roasted, Chicory Market, By Region, 2019-2030 (USD Million)
9. Global Instant Powder, Chicory Market, By Region, 2019-2030 (USD Million)
10. Global Extracts, Chicory Market, By Region, 2019-2030 (USD Million)
11. Global Others, Chicory Market, By Region, 2019-2030 (USD Million)
12. Global Chicory Market, By Plant-Part, 2019-2030 (USD Million)
13. Global Root, Chicory Market, By Region, 2019-2030 (USD Million)
14. Global Leaf, Chicory Market, By Region, 2019-2030 (USD Million)
15. Global Others, Chicory Market, By Region, 2019-2030 (USD Million)
16. Global Chicory Market, By Application, 2019-2030 (USD Million)
17. Global Dietary Supplements, Chicory Market, By Region, 2019-2030 (USD Million)
18. Global Food & Beverage, Chicory Market, By Region, 2019-2030 (USD Million)
19. Global Cosmetics & Personal Care, Chicory Market, By Region, 2019-2030 (USD Million)
20. Global Feed & Pet Food, Chicory Market, By Region, 2019-2030 (USD Million)
21. North America Chicory Market, By Form, 2019-2030 (USD Million)
22. North America Chicory Market, By Type, 2019-2030 (USD Million)
23. North America Chicory Market, By Plant-Part, 2019-2030 (USD Million)
24. North America Chicory Market, By Application, 2019-2030 (USD Million)
25. U.S. Chicory Market, By Form, 2019-2030 (USD Million)
26. U.S. Chicory Market, By Type, 2019-2030 (USD Million)
27. U.S. Chicory Market, By Plant-Part, 2019-2030 (USD Million)
28. U.S. Chicory Market, By Application, 2019-2030 (USD Million)
29. Canada Chicory Market, By Form, 2019-2030 (USD Million)
30. Canada Chicory Market, By Type, 2019-2030 (USD Million)
31. Canada Chicory Market, By Plant-Part, 2019-2030 (USD Million)
32. Canada Chicory Market, By Application, 2019-2030 (USD Million)
33. Mexico Chicory Market, By Form, 2019-2030 (USD Million)
34. Mexico Chicory Market, By Type, 2019-2030 (USD Million)
35. Mexico Chicory Market, By Plant-Part, 2019-2030 (USD Million)
36. Mexico Chicory Market, By Application, 2019-2030 (USD Million)
37. Europe Chicory Market, By Form, 2019-2030 (USD Million)
38. Europe Chicory Market, By Type, 2019-2030 (USD Million)
39. Europe Chicory Market, By Plant-Part, 2019-2030 (USD Million)
40. Europe Chicory Market, By Application, 2019-2030 (USD Million)
41. Germany Chicory Market, By Form, 2019-2030 (USD Million)
42. Germany Chicory Market, By Type, 2019-2030 (USD Million)
43. Germany Chicory Market, By Plant-Part, 2019-2030 (USD Million)
44. Germany Chicory Market, By Application, 2019-2030 (USD Million)
45. France Chicory Market, By Form, 2019-2030 (USD Million)
46. France Chicory Market, By Type, 2019-2030 (USD Million)
47. France Chicory Market, By Plant-Part, 2019-2030 (USD Million)
48. France Chicory Market, By Application, 2019-2030 (USD Million)
49. U.K. Chicory Market, By Form, 2019-2030 (USD Million)
50. U.K. Chicory Market, By Type, 2019-2030 (USD Million)
51. U.K. Chicory Market, By Plant-Part, 2019-2030 (USD Million)
52. U.K. Chicory Market, By Application, 2019-2030 (USD Million)
53. Italy Chicory Market, By Form, 2019-2030 (USD Million)
54. Italy Chicory Market, By Type, 2019-2030 (USD Million)
55. Italy Chicory Market, By Plant-Part, 2019-2030 (USD Million)
56. Italy Chicory Market, By Application, 2019-2030 (USD Million)
57. Spain Chicory Market, By Form, 2019-2030 (USD Million)
58. Spain Chicory Market, By Type, 2019-2030 (USD Million)
59. Spain Chicory Market, By Plant-Part, 2019-2030 (USD Million)
60. Spain Chicory Market, By Application, 2019-2030 (USD Million)
61. Asia Pacific Chicory Market, By Form, 2019-2030 (USD Million)
62. Asia Pacific Chicory Market, By Type, 2019-2030 (USD Million)
63. Asia Pacific Chicory Market, By Plant-Part, 2019-2030 (USD Million)
64. Asia Pacific Chicory Market, By Application, 2019-2030 (USD Million)
65. Japan Chicory Market, By Form, 2019-2030 (USD Million)
66. Japan Chicory Market, By Type, 2019-2030 (USD Million)
67. Japan Chicory Market, By Plant-Part, 2019-2030 (USD Million)
68. Japan Chicory Market, By Application, 2019-2030 (USD Million)
69. China Chicory Market, By Form, 2019-2030 (USD Million)
70. China Chicory Market, By Type, 2019-2030 (USD Million)
71. China Chicory Market, By Plant-Part, 2019-2030 (USD Million)
72. China Chicory Market, By Application, 2019-2030 (USD Million)
73. India Chicory Market, By Form, 2019-2030 (USD Million)
74. India Chicory Market, By Type, 2019-2030 (USD Million)
75. India Chicory Market, By Plant-Part, 2019-2030 (USD Million)
76. India Chicory Market, By Application, 2019-2030 (USD Million)
77. South America Chicory Market, By Form, 2019-2030 (USD Million)
78. South America Chicory Market, By Type, 2019-2030 (USD Million)
79. South America Chicory Market, By Plant-Part, 2019-2030 (USD Million)
80. South America Chicory Market, By Application, 2019-2030 (USD Million)
81. Brazil Chicory Market, By Form, 2019-2030 (USD Million)
82. Brazil Chicory Market, By Type, 2019-2030 (USD Million)
83. Brazil Chicory Market, By Plant-Part, 2019-2030 (USD Million)
84. Brazil Chicory Market, By Application, 2019-2030 (USD Million)
85. Middle East and Africa Chicory Market, By Form, 2019-2030 (USD Million)
86. Middle East and Africa Chicory Market, By Type, 2019-2030 (USD Million)
87. Middle East and Africa Chicory Market, By Plant-Part, 2019-2030 (USD Million)
88. Middle East and Africa Chicory Market, By Application, 2019-2030 (USD Million)
89. UAE Chicory Market, By Form, 2019-2030 (USD Million)
90. UAE Chicory Market, By Type, 2019-2030 (USD Million)
91. UAE Chicory Market, By Plant-Part, 2019-2030 (USD Million)
92. UAE Chicory Market, By Application, 2019-2030 (USD Million)
93. South Africa Chicory Market, By Form, 2019-2030 (USD Million)
94. South Africa Chicory Market, By Type, 2019-2030 (USD Million)
95. South Africa Chicory Market, By Plant-Part, 2019-2030 (USD Million)
96. South Africa Chicory Market, By Application, 2019-2030 (USD Million)
List of Figures
1. Global Chicory Market Segmentation
2. Global Chicory Market: Research Methodology
3. Market Size Estimation Methodology: Bottom-Up Approach
4. Market Size Estimation Methodology: Top-Down Approach
5. Data Triangulation
6. Porter’s Five Forces Analysis
7. Value Chain Analysis
8. Global Chicory Market Attractiveness Analysis By Form
9. Global Chicory Market Attractiveness Analysis By Type
10. Global Chicory Market Attractiveness Analysis By Plant-Part
11. Global Chicory Market Attractiveness Analysis By Application
12. Global Chicory Market Attractiveness Analysis By Region
13. Global Chicory Market: Dynamics
14. Global Chicory Market Share By Form (2022 & 2030)
15. Global Chicory Market Share By Type (2022 & 2030)
16. Global Chicory Market Share By Plant-Part (2022 & 2030)
17. Global Chicory Market Share By Application (2022 & 2030)
18. Global Chicory Market Share By Regions (2022 & 2030)
19. Global Chicory Market Share By Company (2021)
This study forecasts revenue at global, regional, and country levels from 2019 to 2030. The Brainy Insights has segmented the global chicory based on below mentioned segments:
Global Chicory Market by Form:
Global Chicory Market by Type:
Global Chicory Market by Plant-Part:
Global Chicory Market by Application:
Global Chicory by Region:
Research has its special purpose to undertake marketing efficiently. In this competitive scenario, businesses need information across all industry verticals; the information about customer wants, market demand, competition, industry trends, distribution channels etc. This information needs to be updated regularly because businesses operate in a dynamic environment. Our organization, The Brainy Insights incorporates scientific and systematic research procedures in order to get proper market insights and industry analysis for overall business success. The analysis consists of studying the market from a miniscule level wherein we implement statistical tools which helps us in examining the data with accuracy and precision.
Our research reports feature both; quantitative and qualitative aspects for any market. Qualitative information for any market research process are fundamental because they reveal the customer needs and wants, usage and consumption for any product/service related to a specific industry. This in turn aids the marketers/investors in knowing certain perceptions of the customers. Qualitative research can enlighten about the different product concepts and designs along with unique service offering that in turn, helps define marketing problems and generate opportunities. On the other hand, quantitative research engages with the data collection process through interviews, e-mail interactions, surveys and pilot studies. Quantitative aspects for the market research are useful to validate the hypotheses generated during qualitative research method, explore empirical patterns in the data with the help of statistical tools, and finally make the market estimations.
The Brainy Insights offers comprehensive research and analysis, based on a wide assortment of factual insights gained through interviews with CXOs and global experts and secondary data from reliable sources. Our analysts and industry specialist assume vital roles in building up statistical tools and analysis models, which are used to analyse the data and arrive at accurate insights with exceedingly informative research discoveries. The data provided by our organization have proven precious to a diverse range of companies, facilitating them to address issues such as determining which products/services are the most appealing, whether or not customers use the product in the manner anticipated, the purchasing intentions of the market and many others.
Our research methodology encompasses an idyllic combination of primary and secondary initiatives. Key phases involved in this process are listed below:

The phase involves the gathering and collecting of market data and its related information with the help of different sources & research procedures.

The data procurement stage involves in data gathering and collecting through various data sources.
This stage involves in extensive research. These data sources includes:
Purchased Database: Purchased databases play a crucial role in estimating the market sizes irrespective of the domain. Our purchased database includes:
Primary Research: The Brainy Insights interacts with leading companies and experts of the concerned domain to develop the analyst team’s market understanding and expertise. It improves and substantiates every single data presented in the market reports. Primary research mainly involves in telephonic interviews, E-mail interactions and face-to-face interviews with the raw material providers, manufacturers/producers, distributors, & independent consultants. The interviews that we conduct provides valuable data on market size and industry growth trends prevailing in the market. Our organization also conducts surveys with the various industry experts in order to gain overall insights of the industry/market. For instance, in healthcare industry we conduct surveys with the pharmacists, doctors, surgeons and nurses in order to gain insights and key information of a medical product/device/equipment which the customers are going to usage. Surveys are conducted in the form of questionnaire designed by our own analyst team. Surveys plays an important role in primary research because surveys helps us to identify the key target audiences of the market. Additionally, surveys helps to identify the key target audience engaged with the market. Our survey team conducts the survey by targeting the key audience, thus gaining insights from them. Based on the perspectives of the customers, this information is utilized to formulate market strategies. Moreover, market surveys helps us to understand the current competitive situation of the industry. To be precise, our survey process typically involve with the 360 analysis of the market. This analytical process begins by identifying the prospective customers for a product or service related to the market/industry to obtain data on how a product/service could fit into customers’ lives.

Secondary Research: The secondary data sources includes information published by the on-profit organizations such as World bank, WHO, company fillings, investor presentations, annual reports, national government documents, statistical databases, blogs, articles, white papers and others. From the annual report, we analyse a company’s revenue to understand the key segment and market share of that organization in a particular region. We analyse the company websites and adopt the product mapping technique which is important for deriving the segment revenue. In the product mapping method, we select and categorize the products offered by the companies catering to domain specific market, deduce the product revenue for each of the companies so as to get overall estimation of the market size. We also source data and analyses trends based on information received from supply side and demand side intermediaries in the value chain. The supply side denotes the data gathered from supplier, distributor, wholesaler and the demand side illustrates the data gathered from the end customers for respective market domain.

The supply side for a domain specific market is analysed by:
The demand side for the market is estimated through:
In-house Library: Apart from these third-party sources, we have our in-house library of qualitative and quantitative information. Our in-house database includes market data for various industry and domains. These data are updated on regular basis as per the changing market scenario. Our library includes, historic databases, internal audit reports and archives.
Sometimes there are instances where there is no metadata or raw data available for any domain specific market. For those cases, we use our expertise to forecast and estimate the market size in order to generate comprehensive data sets. Our analyst team adopt a robust research technique in order to produce the estimates:
Data Synthesis: This stage involves the analysis & mapping of all the information obtained from the previous step. It also involves in scrutinizing the data for any discrepancy observed while data gathering related to the market. The data is collected with consideration to the heterogeneity of sources. Robust scientific techniques are in place for synthesizing disparate data sets and provide the essential contextual information that can orient market strategies. The Brainy Insights has extensive experience in data synthesis where the data passes through various stages:


Market Deduction & Formulation: The final stage comprises of assigning data points at appropriate market spaces so as to deduce feasible conclusions. Analyst perspective & subject matter expert based holistic form of market sizing coupled with industry analysis also plays a crucial role in this stage.
This stage involves in finalization of the market size and numbers that we have collected from data integration step. With data interpolation, it is made sure that there is no gap in the market data. Successful trend analysis is done by our analysts using extrapolation techniques, which provide the best possible forecasts for the market.
Data Validation & Market Feedback: Validation is the most important step in the process. Validation & re-validation via an intricately designed process helps us finalize data-points to be used for final calculations.

The Brainy Insights interacts with leading companies and experts of the concerned domain to develop the analyst team’s market understanding and expertise. It improves and substantiates every single data presented in the market reports. The data validation interview and discussion panels are typically composed of the most experienced industry members. The participants include, however, are not limited to:
Moreover, we always validate our data and findings through primary respondents from all the major regions we are working on.
Free Customization
Fortune 500 Clients
Free Yearly Update On Purchase Of Multi/Corporate License
Companies Served Till Date