- +1-315-215-1633
- sales@thebrainyinsights.com

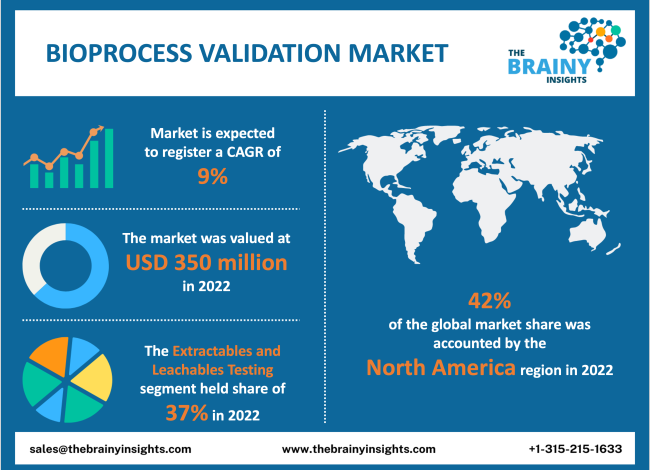
The global bioprocess validation market is expected to grow from USD 350 million in 2022 to USD 828.57 million by 2032, at a CAGR of 9% during the forecast period 2023-2032. The increasing research and expenditure by pharmaceutical companies will drive the global bioprocess validation market.
The natural world of flora and fauna has the potential to solve world problems. The technological advancements in the past century have enabled the scientific community to harness this potential and use it for the betterment of society. Scientific breakthroughs, discoveries, and innovations have allowed the use of living cells and its component to produce drugs, vaccines, therapeutics, and other products. The processing of living cells or their components to make certain products is known as bioprocessing. Bioprocessing finds application in the pharmaceutical, biotechnology, healthcare, food processing, beverages, and agricultural sectors. These processes are experimental, and desired results are achieved after several trials. However, each experiment requires extensive resources, considerable time, and effort. Each experiment is approved only after carefully considering all aspects, including the viability, feasibility, and success ratio. This avoids the waste of resources. The trials and experiments are recorded for future reference and assessment. The equipment, devices, samples, processes, and results are well documented in bioprocess validation. The successful bioprocessing trials are also noted, and their accuracy is established in a defined structural format. This bioprocess validation is mandated by government institutions and followed by market players to achieve quality products and cost reduction. Bioprocess validation involves several stages, with multiple parameters tested at each stage. Bioprocess validation ensures that good quality products are delivered consistently to optimize company resources.
Get an overview of this study by requesting a free sample
January 2023 - Cell Metric X, a high-contrast imager that allows automatic same-day identification of clonally generated cells, was released by Advanced Instruments, a global producer of scientific and analytical instruments. Cell Metric X, a revolutionary new addition to Solentim's market-leading Cell Metric, delivers automatic picture analysis to speed up cell line generation procedures. Scientists can swiftly recognize clonally generated cells given the Automatic Evidence of Clonality (AEC) powered by artificial intelligence. This lowers the time and effort spent on picture analysis needed to certify successful seeding. As a result, the FDA (Food and Drug Administration) received the image-based proof required for the IND (Investigational New Drug) submission weeks sooner than expected.
1. Introduction
1.1. Objectives of the Study
1.2. Market Definition
1.3. Research Scope
1.4. Currency
1.5. Key Target Audience
2. Research Methodology and Assumptions
3. Executive Summary
4. Premium Insights
4.1. Porter’s Five Forces Analysis
4.2. Value Chain Analysis
4.3. Top Investment Pockets
4.3.1. Market Attractiveness Analysis by Testing Type
4.3.2. Market Attractiveness Analysis by Process Component
4.3.3. Market Attractiveness Analysis by End User
4.3.4. Market Attractiveness Analysis by Region
4.4. Industry Trends
5. Market Dynamics
5.1. Market Evaluation
5.2. Drivers
5.2.1. The increasing government scrutiny of pharmaceuticals and healthcare produce
5.3. Restraints
5.3.1. Bioprocess validation is not full-proof
5.4. Opportunities
5.4.1. The rising research and development
5.5. Challenges
5.5.1. Failure of regulatory institutions in ensuring accountability from market players
6. Global Bioprocess Validation Market Analysis and Forecast, By Testing Type
6.1. Segment Overview
6.2. Extractables and Leachables Testing
6.3. Integrity Testing
6.4. Bioprocess Residuals Testing
6.5. Filtration and Fermentation
6.6. Viral Clearance Testing
6.7. Systems Testing
6.8. Compatibility Testing
6.9. Microbiological Testing
6.10. Physiochemical Testing
6.11. Bacterial Retention Testing
6.12. Adsorption Testing and Others
7. Global Bioprocess Validation Market Analysis and Forecast, By Process Component
7.1. Segment Overview
7.2. Filter Elements
7.3. Freezing and Thawing Process Bags
7.4. Bioreactors
7.5. Connectors
7.6. Samplers
7.7. Media Containers and Bags
7.8. Mixing Systems
7.9. Transfer Systems
7.10. Others
8. Global Bioprocess Validation Market Analysis and Forecast, By End User
8.1. Segment Overview
8.2. Pharmaceutical Companies
8.3. Contract Development and Manufacturing Organizations
8.4. Biotechnology Companies
8.5. Research Laboratories and Institutions
8.6. Others
9. Global Bioprocess Validation Market Analysis and Forecast, By Regional Analysis
9.1. Segment Overview
9.2. North America
9.2.1. U.S.
9.2.2. Canada
9.2.3. Mexico
9.3. Europe
9.3.1. Germany
9.3.2. France
9.3.3. U.K.
9.3.4. Italy
9.3.5. Spain
9.4. Asia-Pacific
9.4.1. Japan
9.4.2. China
9.4.3. India
9.5. South America
9.5.1. Brazil
9.6. Middle East and Africa
9.6.1. UAE
9.6.2. South Africa
10. Global Bioprocess Validation Market-Competitive Landscape
10.1. Overview
10.2. Market Share of Key Players in the Bioprocess Validation Market
10.2.1. Global Company Market Share
10.2.2. North America Company Market Share
10.2.3. Europe Company Market Share
10.2.4. APAC Company Market Share
10.3. Competitive Situations and Trends
10.3.1. Product Launches and Developments
10.3.2. Partnerships, Collaborations, and Agreements
10.3.3. Mergers & Acquisitions
10.3.4. Expansions
11. Company Profiles
11.1. Almac Group
11.1.1. Business Overview
11.1.2. Company Snapshot
11.1.3. Company Market Share Analysis
11.1.4. Company Product Portfolio
11.1.5. Recent Developments
11.1.6. SWOT Analysis
11.2. Cobetter Filtration Equipment Co. Ltd.
11.2.1. Business Overview
11.2.2. Company Snapshot
11.2.3. Company Market Share Analysis
11.2.4. Company Product Portfolio
11.2.5. Recent Developments
11.2.6. SWOT Analysis
11.3. Danaher Corporation
11.3.1. Business Overview
11.3.2. Company Snapshot
11.3.3. Company Market Share Analysis
11.3.4. Company Product Portfolio
11.3.5. Recent Developments
11.3.6. SWOT Analysis
11.4. Eurofins Scientific Inc.
11.4.1. Business Overview
11.4.2. Company Snapshot
11.4.3. Company Market Share Analysis
11.4.4. Company Product Portfolio
11.4.5. Recent Developments
11.4.6. SWOT Analysis
11.5. Merck KGaA
11.5.1. Business Overview
11.5.2. Company Snapshot
11.5.3. Company Market Share Analysis
11.5.4. Company Product Portfolio
11.5.5. Recent Developments
11.5.6. SWOT Analysis
11.6. Pall Corporation
11.6.1. Business Overview
11.6.2. Company Snapshot
11.6.3. Company Market Share Analysis
11.6.4. Company Product Portfolio
11.6.5. Recent Developments
11.6.6. SWOT Analysis
11.7. Sartorius AG
11.7.1. Business Overview
11.7.2. Company Snapshot
11.7.3. Company Market Share Analysis
11.7.4. Company Product Portfolio
11.7.5. Recent Developments
11.7.6. SWOT Analysis
11.8. SGS SA
11.8.1. Business Overview
11.8.2. Company Snapshot
11.8.3. Company Market Share Analysis
11.8.4. Company Product Portfolio
11.8.5. Recent Developments
11.8.6. SWOT Analysis
11.9. Thermo Fisher Scientific
11.9.1. Business Overview
11.9.2. Company Snapshot
11.9.3. Company Market Share Analysis
11.9.4. Company Product Portfolio
11.9.5. Recent Developments
11.9.6. SWOT Analysis
11.10. Toxikon Corporation
11.10.1. Business Overview
11.10.2. Company Snapshot
11.10.3. Company Market Share Analysis
11.10.4. Company Product Portfolio
11.10.5. Recent Developments
11.10.6. SWOT Analysis
List of Table
1. Global Bioprocess Validation Market, By Testing Type, 2019-2032 (USD Million)
2. Global Extractables and Leachables Testing Bioprocess Validation Market, By Region, 2019-2032 (USD Million)
3. Global Integrity Testing Bioprocess Validation Market, By Region, 2019-2032 (USD Million)
4. Global Bioprocess Residuals Testing Bioprocess Validation Market, By Region, 2019-2032 (USD Million)
5. Global Filtration and Fermentation Bioprocess Validation Market, By Region, 2019-2032 (USD Million)
6. Global Viral Clearance Testing Bioprocess Validation Market, By Region, 2019-2032 (USD Million)
7. Global Systems Testing Bioprocess Validation Market, By Region, 2019-2032 (USD Million)
8. Global Compatibility Testing Bioprocess Validation Market, By Region, 2019-2032 (USD Million)
9. Global Microbiological Testing Bioprocess Validation Market, By Region, 2019-2032 (USD Million)
10. Global Physiochemical Testing Bioprocess Validation Market, By Region, 2019-2032 (USD Million)
11. Global Bacterial Retention Testing Bioprocess Validation Market, By Region, 2019-2032 (USD Million)
12. Global Adsorption Testing and Others Bioprocess Validation Market, By Region, 2019-2032 (USD Million)
13. Global Bioprocess Validation Market, By Process Component, 2019-2032 (USD Million)
14. Global Filter Elements Bioprocess Validation Market, By Region, 2019-2032 (USD Million)
15. Global Freezing and Thawing Process Bags Bioprocess Validation Market, By Region, 2019-2032 (USD Million)
16. Global Bioreactors Bioprocess Validation Market, By Region, 2019-2032 (USD Million)
17. Global Connectors Bioprocess Validation Market, By Region, 2019-2032 (USD Million)
18. Global Samplers Bioprocess Validation Market, By Region, 2019-2032 (USD Million)
19. Global Media Containers and Bags Bioprocess Validation Market, By Region, 2019-2032 (USD Million)
20. Global Mixing Systems Bioprocess Validation Market, By Region, 2019-2032 (USD Million)
21. Global Transfer Systems Bioprocess Validation Market, By Region, 2019-2032 (USD Million)
22. Global Others Bioprocess Validation Market, By Region, 2019-2032 (USD Million)
23. Global Bioprocess Validation Market, By End User, 2019-2032 (USD Million)
24. Global Pharmaceutical Companies Bioprocess Validation Market, By Region, 2019-2032 (USD Million)
25. Global Contract Development and Manufacturing Organizations Bioprocess Validation Market, By Region, 2019-2032 (USD Million)
26. Global Biotechnology Companies Bioprocess Validation Market, By Region, 2019-2032 (USD Million)
27. Global Research Laboratories and Institutions Bioprocess Validation Market, By Region, 2019-2032 (USD Million)
28. Global Others Bioprocess Validation Market, By Region, 2019-2032 (USD Million)
29. Global Bioprocess Validation Market, By Region, 2019-2032 (USD Million)
30. North America Bioprocess Validation Market, By Testing Type, 2019-2032 (USD Million)
31. North America Bioprocess Validation Market, By Process Component, 2019-2032 (USD Million)
32. North America Bioprocess Validation Market, By End User, 2019-2032 (USD Million)
33. U.S. Bioprocess Validation Market, By Testing Type, 2019-2032 (USD Million)
34. U.S. Bioprocess Validation Market, By Process Component, 2019-2032 (USD Million)
35. U.S. Bioprocess Validation Market, By End User, 2019-2032 (USD Million)
36. Canada Bioprocess Validation Market, By Testing Type, 2019-2032 (USD Million)
37. Canada Bioprocess Validation Market, By Process Component, 2019-2032 (USD Million)
38. Canada Bioprocess Validation Market, By End User, 2019-2032 (USD Million)
39. Mexico Bioprocess Validation Market, By Testing Type, 2019-2032 (USD Million)
40. Mexico Bioprocess Validation Market, By Process Component, 2019-2032 (USD Million)
41. Mexico Bioprocess Validation Market, By End User, 2019-2032 (USD Million)
42. Europe Bioprocess Validation Market, By Testing Type, 2019-2032 (USD Million)
43. Europe Bioprocess Validation Market, By Process Component, 2019-2032 (USD Million)
44. Europe Bioprocess Validation Market, By End User, 2019-2032 (USD Million)
45. Germany Bioprocess Validation Market, By Testing Type, 2019-2032 (USD Million)
46. Germany Bioprocess Validation Market, By Process Component, 2019-2032 (USD Million)
47. Germany Bioprocess Validation Market, By End User, 2019-2032 (USD Million)
48. France Bioprocess Validation Market, By Testing Type, 2019-2032 (USD Million)
49. France Bioprocess Validation Market, By Process Component, 2019-2032 (USD Million)
50. France Bioprocess Validation Market, By End User, 2019-2032 (USD Million)
51. U.K. Bioprocess Validation Market, By Testing Type, 2019-2032 (USD Million)
52. U.K. Bioprocess Validation Market, By Process Component, 2019-2032 (USD Million)
53. U.K. Bioprocess Validation Market, By End User, 2019-2032 (USD Million)
54. Italy Bioprocess Validation Market, By Testing Type, 2019-2032 (USD Million)
55. Italy Bioprocess Validation Market, By Process Component, 2019-2032 (USD Million)
56. Italy Bioprocess Validation Market, By End User, 2019-2032 (USD Million)
57. Spain Bioprocess Validation Market, By Testing Type, 2019-2032 (USD Million)
58. Spain Bioprocess Validation Market, By Process Component, 2019-2032 (USD Million)
59. Spain Bioprocess Validation Market, By End User, 2019-2032 (USD Million)
60. Asia Pacific Bioprocess Validation Market, By Testing Type, 2019-2032 (USD Million)
61. Asia Pacific Bioprocess Validation Market, By Process Component, 2019-2032 (USD Million)
62. Asia Pacific Bioprocess Validation Market, By End User, 2019-2032 (USD Million)
63. Japan Bioprocess Validation Market, By Testing Type, 2019-2032 (USD Million)
64. Japan Bioprocess Validation Market, By Process Component, 2019-2032 (USD Million)
65. Japan Bioprocess Validation Market, By End User, 2019-2032 (USD Million)
66. China Bioprocess Validation Market, By Testing Type, 2019-2032 (USD Million)
67. China Bioprocess Validation Market, By Process Component, 2019-2032 (USD Million)
68. China Bioprocess Validation Market, By End User, 2019-2032 (USD Million)
69. India Bioprocess Validation Market, By Testing Type, 2019-2032 (USD Million)
70. India Bioprocess Validation Market, By Process Component, 2019-2032 (USD Million)
71. India Bioprocess Validation Market, By End User, 2019-2032 (USD Million)
72. South America Bioprocess Validation Market, By Testing Type, 2019-2032 (USD Million)
73. South America Bioprocess Validation Market, By Process Component, 2019-2032 (USD Million)
74. South America Bioprocess Validation Market, By End User, 2019-2032 (USD Million)
75. Brazil Bioprocess Validation Market, By Testing Type, 2019-2032 (USD Million)
76. Brazil Bioprocess Validation Market, By Process Component, 2019-2032 (USD Million)
77. Brazil Bioprocess Validation Market, By End User, 2019-2032 (USD Million)
78. Middle East and Africa Bioprocess Validation Market, By Testing Type, 2019-2032 (USD Million)
79. Middle East and Africa Bioprocess Validation Market, By Process Component, 2019-2032 (USD Million)
80. Middle East and Africa Bioprocess Validation Market, By End User, 2019-2032 (USD Million)
81. UAE Bioprocess Validation Market, By Testing Type, 2019-2032 (USD Million)
82. UAE Bioprocess Validation Market, By Process Component, 2019-2032 (USD Million)
83. UAE Bioprocess Validation Market, By End User, 2019-2032 (USD Million)
84. South Africa Bioprocess Validation Market, By Testing Type, 2019-2032 (USD Million)
85. South Africa Bioprocess Validation Market, By Process Component, 2019-2032 (USD Million)
86. South Africa Bioprocess Validation Market, By End User, 2019-2032 (USD Million)
List of Figures
1. Global Bioprocess Validation Market Segmentation
2. Bioprocess Validation Market: Research Methodology
3. Market Size Estimation Methodology: Bottom-Up Approach
4. Market Size Estimation Methodology: Top-Down Approach
5. Data Triangulation
6. Porter’s Five Forces Analysis
7. Value Chain Analysis
8. Global Bioprocess Validation Market Attractiveness Analysis by Testing Type
9. Global Bioprocess Validation Market Attractiveness Analysis by Process Component
10. Global Bioprocess Validation Market Attractiveness Analysis by End User
11. Global Bioprocess Validation Market Attractiveness Analysis by Region
12. Global Bioprocess Validation Market: Dynamics
13. Global Bioprocess Validation Market Share by Testing Type (2022 & 2032)
14. Global Bioprocess Validation Market Share by Process Component (2022 & 2032)
15. Global Bioprocess Validation Market Share by End User (2022 & 2032)
16. Global Bioprocess Validation Market Share by Regions (2022 & 2032)
17. Global Bioprocess Validation Market Share by Company (2021)
This study forecasts revenue at global, regional, and country levels from 2019 to 2032. The Brainy Insights has segmented the bioprocess validation market based on below mentioned segments:
Bioprocess Validation Market by Testing Type:
Bioprocess Validation Market by Process Component:
Bioprocess Validation Market by End User:
Bioprocess Validation Market by Region:
Research has its special purpose to undertake marketing efficiently. In this competitive scenario, businesses need information across all industry verticals; the information about customer wants, market demand, competition, industry trends, distribution channels etc. This information needs to be updated regularly because businesses operate in a dynamic environment. Our organization, The Brainy Insights incorporates scientific and systematic research procedures in order to get proper market insights and industry analysis for overall business success. The analysis consists of studying the market from a miniscule level wherein we implement statistical tools which helps us in examining the data with accuracy and precision.
Our research reports feature both; quantitative and qualitative aspects for any market. Qualitative information for any market research process are fundamental because they reveal the customer needs and wants, usage and consumption for any product/service related to a specific industry. This in turn aids the marketers/investors in knowing certain perceptions of the customers. Qualitative research can enlighten about the different product concepts and designs along with unique service offering that in turn, helps define marketing problems and generate opportunities. On the other hand, quantitative research engages with the data collection process through interviews, e-mail interactions, surveys and pilot studies. Quantitative aspects for the market research are useful to validate the hypotheses generated during qualitative research method, explore empirical patterns in the data with the help of statistical tools, and finally make the market estimations.
The Brainy Insights offers comprehensive research and analysis, based on a wide assortment of factual insights gained through interviews with CXOs and global experts and secondary data from reliable sources. Our analysts and industry specialist assume vital roles in building up statistical tools and analysis models, which are used to analyse the data and arrive at accurate insights with exceedingly informative research discoveries. The data provided by our organization have proven precious to a diverse range of companies, facilitating them to address issues such as determining which products/services are the most appealing, whether or not customers use the product in the manner anticipated, the purchasing intentions of the market and many others.
Our research methodology encompasses an idyllic combination of primary and secondary initiatives. Key phases involved in this process are listed below:

The phase involves the gathering and collecting of market data and its related information with the help of different sources & research procedures.

The data procurement stage involves in data gathering and collecting through various data sources.
This stage involves in extensive research. These data sources includes:
Purchased Database: Purchased databases play a crucial role in estimating the market sizes irrespective of the domain. Our purchased database includes:
Primary Research: The Brainy Insights interacts with leading companies and experts of the concerned domain to develop the analyst team’s market understanding and expertise. It improves and substantiates every single data presented in the market reports. Primary research mainly involves in telephonic interviews, E-mail interactions and face-to-face interviews with the raw material providers, manufacturers/producers, distributors, & independent consultants. The interviews that we conduct provides valuable data on market size and industry growth trends prevailing in the market. Our organization also conducts surveys with the various industry experts in order to gain overall insights of the industry/market. For instance, in healthcare industry we conduct surveys with the pharmacists, doctors, surgeons and nurses in order to gain insights and key information of a medical product/device/equipment which the customers are going to usage. Surveys are conducted in the form of questionnaire designed by our own analyst team. Surveys plays an important role in primary research because surveys helps us to identify the key target audiences of the market. Additionally, surveys helps to identify the key target audience engaged with the market. Our survey team conducts the survey by targeting the key audience, thus gaining insights from them. Based on the perspectives of the customers, this information is utilized to formulate market strategies. Moreover, market surveys helps us to understand the current competitive situation of the industry. To be precise, our survey process typically involve with the 360 analysis of the market. This analytical process begins by identifying the prospective customers for a product or service related to the market/industry to obtain data on how a product/service could fit into customers’ lives.

Secondary Research: The secondary data sources includes information published by the on-profit organizations such as World bank, WHO, company fillings, investor presentations, annual reports, national government documents, statistical databases, blogs, articles, white papers and others. From the annual report, we analyse a company’s revenue to understand the key segment and market share of that organization in a particular region. We analyse the company websites and adopt the product mapping technique which is important for deriving the segment revenue. In the product mapping method, we select and categorize the products offered by the companies catering to domain specific market, deduce the product revenue for each of the companies so as to get overall estimation of the market size. We also source data and analyses trends based on information received from supply side and demand side intermediaries in the value chain. The supply side denotes the data gathered from supplier, distributor, wholesaler and the demand side illustrates the data gathered from the end customers for respective market domain.

The supply side for a domain specific market is analysed by:
The demand side for the market is estimated through:
In-house Library: Apart from these third-party sources, we have our in-house library of qualitative and quantitative information. Our in-house database includes market data for various industry and domains. These data are updated on regular basis as per the changing market scenario. Our library includes, historic databases, internal audit reports and archives.
Sometimes there are instances where there is no metadata or raw data available for any domain specific market. For those cases, we use our expertise to forecast and estimate the market size in order to generate comprehensive data sets. Our analyst team adopt a robust research technique in order to produce the estimates:
Data Synthesis: This stage involves the analysis & mapping of all the information obtained from the previous step. It also involves in scrutinizing the data for any discrepancy observed while data gathering related to the market. The data is collected with consideration to the heterogeneity of sources. Robust scientific techniques are in place for synthesizing disparate data sets and provide the essential contextual information that can orient market strategies. The Brainy Insights has extensive experience in data synthesis where the data passes through various stages:


Market Deduction & Formulation: The final stage comprises of assigning data points at appropriate market spaces so as to deduce feasible conclusions. Analyst perspective & subject matter expert based holistic form of market sizing coupled with industry analysis also plays a crucial role in this stage.
This stage involves in finalization of the market size and numbers that we have collected from data integration step. With data interpolation, it is made sure that there is no gap in the market data. Successful trend analysis is done by our analysts using extrapolation techniques, which provide the best possible forecasts for the market.
Data Validation & Market Feedback: Validation is the most important step in the process. Validation & re-validation via an intricately designed process helps us finalize data-points to be used for final calculations.

The Brainy Insights interacts with leading companies and experts of the concerned domain to develop the analyst team’s market understanding and expertise. It improves and substantiates every single data presented in the market reports. The data validation interview and discussion panels are typically composed of the most experienced industry members. The participants include, however, are not limited to:
Moreover, we always validate our data and findings through primary respondents from all the major regions we are working on.
Free Customization
Fortune 500 Clients
Free Yearly Update On Purchase Of Multi/Corporate License
Companies Served Till Date