- +1-315-215-1633
- sales@thebrainyinsights.com

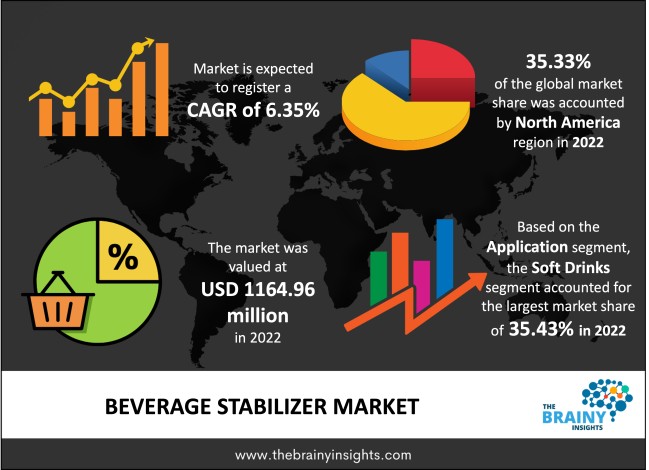
The global Beverage Stabilizer market was valued at USD 1,164.96 Million in 2022 and growing at a CAGR of 6.35% from 2023 to 2032. The market is expected to reach USD 2,156.19 Million by 2032. Beverage stabilizer has grown significantly due to growing demand for enhanced shelf life and product quality in the beverage sector. The stabilizers help add consistency to improve the overall flavour and give body to the beverages. It prevents sedimentation and keeps the ingredients suspended within the finished product. These stabilizers are the additives that help maintain the emulsion or prevent the degeneration of the beverages. The most familiar stabilizers are hydrocolloids like gum Arabic, gum acacia and xantham, pectin, modified starches, casein, carrageenan and insulin. The main point of using a stabilizer is adding viscosity to enhance the flavour and give body to the beverage. It also helps keep emulsification, which controls sedimentation by keeping the added components suspended in the product. The functional beverages have a range of add-ins such as herbs, vitamins and proteins. Stabilizers guarantee the nutraceutical portion is suspended, thus eliminating the ingredient settling and the gritty taste.
The global beverage stabilizers market is growing due to the surge in the prevalence of non-alcoholic beverage consumption and more focus on health promotion. Asia Pacific region shows significant growth as emerging economies like China and India seem to be promising hotspots for growth as the primary application for the beverage stabilizer is in soft drinks. The beverage stabilizers are additives that help maintain beverages' physical and chemical properties. It helps in the prevention of separation and sedimentation during distribution and storage. The growing prevalence of health promotion and the demand for non-alcoholic beverage consumption propel the market's growth. Based on one of the studies in 2012, more than 3 million fatalities were attributed to excess alcohol consumption, and the government globally promoted several awareness campaigns for decreasing alcohol intake. Hence, the sales of non-alcoholic functional and non-functional beverages have increased, eventually driving the beverage stabilizer market. Beverage stabilizers are in demand due to the growing demand for enhanced beverage texture and mouthfeel. It has been observed that present-day consumers are looking for more than just tastes in their beverages and want satisfying sensory experiences. Many categories come under beverage stabilizers, like thickeners, emulsifiers and gelling agents; all of these have a crucial role in getting the needed texture and consistency in many drinks. Beverage stabilizers are crucial in products such as smoothies, dairy-based beverages and fruit juices where there is a requirement for smooth and consistent texture for consumer satisfaction. It helps in the prevention of undesirable separation, which results in a creamy and enjoyable mouthfeel. It helps maintain consistent texture and visual appeal during the beverage shelf life. It has also been observed that the beverage stabilizer market is going through transformative change due to the growing demand for clean labels and natural ingredients. It has led the manufacturers to explore alternative solutions for maintaining product stability while following the clean label requirement.
Get an overview of this study by requesting a free sample
1. Introduction
1.1. Objectives of the Study
1.2. Market Definition
1.3. Research Scope
1.4. Currency
1.5. Key Target Audience
2. Research Methodology and Assumptions
3. Executive Summary
4. Premium Insights
4.1. Porter’s Five Forces Analysis
4.2. Value Chain Analysis
4.3. Top Investment Pockets
4.3.1. Market Attractiveness Analysis By Product
4.3.2. Market Attractiveness Analysis By Application
4.3.3. Market Attractiveness Analysis By Region
4.4. Industry Trends
5. Market Dynamics
5.1. Market Evaluation
5.2. Drivers
5.2.1. The growing demand for functional and fortified beverages
5.3. Restraints
5.3.1. Fluctuation in the price of raw materials
5.4. Opportunities
5.4.1. Innovation in the beverage formulation
5.5. Challenges
5.5.1. Economic slowdown
6. Global Beverage Stabilizer Market Analysis and Forecast, By Product
6.1. Segment Overview
6.2. Gum Arabic
6.3. Carboxymethyl Cellulose
6.4. Xantham Gum
6.5. Pectin
6.6. Carrageenan
6.7. Others
7. Global Beverage Stabilizer Market Analysis and Forecast, By Application
7.1. Segment Overview
7.2. Fruit Drinks
7.3. Soft Drinks
7.4. Dairy Beverages
7.5. Alcoholic Beverages
7.6. Others
8. Global Beverage Stabilizer Market Analysis and Forecast, By Regional Analysis
8.1. Segment Overview
8.2. North America
8.2.1. U.S.
8.2.2. Canada
8.2.3. Mexico
8.3. Europe
8.3.1. Germany
8.3.2. France
8.3.3. U.K.
8.3.4. Italy
8.3.5. Spain
8.4. Asia-Pacific
8.4.1. Japan
8.4.2. China
8.4.3. India
8.5. South America
8.5.1. Brazil
8.6. Middle East and Africa
8.6.1. UAE
8.6.2. South Africa
9. Global Beverage Stabilizer Market-Competitive Landscape
9.1. Overview
9.2. Market Share of Key Players in Global Beverage Stabilizer Market
9.2.1. Global Company Market Share
9.2.2. North America Company Market Share
9.2.3. Europe Company Market Share
9.2.4. APAC Company Market Share
9.3. Competitive Situations and Trends
9.3.1. Product Launches and Developments
9.3.2. Partnerships, Collaborations, and Agreements
9.3.3. Mergers & Acquisitions
9.3.4. Expansions
10. Company Profiles
10.1. Cargill Inc
10.1.1. Business Overview
10.1.2. Company Snapshot
10.1.3. Company Market Share Analysis
10.1.4. Company Product Portfolio
10.1.5. Recent Developments
10.1.6. SWOT Analysis
10.2. Royal DSM N.V
10.2.1. Business Overview
10.2.2. Company Snapshot
10.2.3. Company Market Share Analysis
10.2.4. Company Product Portfolio
10.2.5. Recent Developments
10.2.6. SWOT Analysis
10.3. J.M. Huber Corporation (CP Kelco ApS)
10.3.1. Business Overview
10.3.2. Company Snapshot
10.3.3. Company Market Share Analysis
10.3.4. Company Product Portfolio
10.3.5. Recent Developments
10.3.6. SWOT Analysis
10.4. Ingredion Incorporated
10.4.1. Business Overview
10.4.2. Company Snapshot
10.4.3. Company Market Share Analysis
10.4.4. Company Product Portfolio
10.4.5. Recent Developments
10.4.6. SWOT Analysis
10.5. Kerry Group PLC (Kerry Group)
10.5.1. Business Overview
10.5.2. Company Snapshot
10.5.3. Company Market Share Analysis
10.5.4. Company Product Portfolio
10.5.5. Recent Developments
10.5.6. SWOT Analysis
10.6. Ashland Global Holdings Inc
10.6.1. Business Overview
10.6.2. Company Snapshot
10.6.3. Company Market Share Analysis
10.6.4. Company Product Portfolio
10.6.5. Recent Developments
10.6.6. SWOT Analysis
10.7. Archer-Daniels-Midland Company (ADM)
10.7.1. Business Overview
10.7.2. Company Snapshot
10.7.3. Company Market Share Analysis
10.7.4. Company Product Portfolio
10.7.5. Recent Developments
10.7.6. SWOT Analysis
10.8. DowDuPont
10.8.1. Business Overview
10.8.2. Company Snapshot
10.8.3. Company Market Share Analysis
10.8.4. Company Product Portfolio
10.8.5. Recent Developments
10.8.6. SWOT Analysis
10.9. Palsgaard A/S
10.9.1. Business Overview
10.9.2. Company Snapshot
10.9.3. Company Market Share Analysis
10.9.4. Company Product Portfolio
10.9.5. Recent Developments
10.9.6. SWOT Analysis
10.10. Tate & Lyle PLC. (Tate & Lyle)
10.10.1. Business Overview
10.10.2. Company Snapshot
10.10.3. Company Market Share Analysis
10.10.4. Company Product Portfolio
10.10.5. Recent Developments
10.10.6. SWOT Analysis
List of Table
1. Global Beverage Stabilizer Market, By Product, 2019-2032 (USD Million)
2. Global Gum Arabic, Beverage Stabilizer Market, By Region, 2019-2032 (USD Million)
3. Global Carboxymethyl Cellulose, Beverage Stabilizer Market, By Region, 2019-2032 (USD Million)
4. Global Xantham Gum, Beverage Stabilizer Market, By Region, 2019-2032 (USD Million)
5. Global Pectin, Beverage Stabilizer Market, By Region, 2019-2032 (USD Million)
6. Global Carrageenan, Beverage Stabilizer Market, By Region, 2019-2032 (USD Million)
7. Global Others, Beverage Stabilizer Market, By Region, 2019-2032 (USD Million)
8. Global Beverage Stabilizer Market, By Application, 2019-2032 (USD Million)
9. Global Fruit Drinks, Beverage Stabilizer Market, By Region, 2019-2032 (USD Million)
10. Global Soft Drinks, Beverage Stabilizer Market, By Region, 2019-2032 (USD Million)
11. Global Dairy Beverages, Beverage Stabilizer Market, By Region, 2019-2032 (USD Million)
12. Global Alcoholic Beverages, Beverage Stabilizer Market, By Region, 2019-2032 (USD Million)
13. Global Others, Beverage Stabilizer Market, By Region, 2019-2032 (USD Million)
14. North America Beverage Stabilizer Market, By Product, 2019-2032 (USD Million)
15. North America Beverage Stabilizer Market, By Application, 2019-2032 (USD Million)
16. U.S. Beverage Stabilizer Market, By Product, 2019-2032 (USD Million)
17. U.S. Beverage Stabilizer Market, By Application, 2019-2032 (USD Million)
18. Canada Beverage Stabilizer Market, By Product, 2019-2032 (USD Million)
19. Canada Beverage Stabilizer Market, By Application, 2019-2032 (USD Million)
20. Mexico Beverage Stabilizer Market, By Product, 2019-2032 (USD Million)
21. Mexico Beverage Stabilizer Market, By Application, 2019-2032 (USD Million)
22. Europe Beverage Stabilizer Market, By Product, 2019-2032 (USD Million)
23. Europe Beverage Stabilizer Market, By Application, 2019-2032 (USD Million)
24. Germany Beverage Stabilizer Market, By Product, 2019-2032 (USD Million)
25. Germany Beverage Stabilizer Market, By Application, 2019-2032 (USD Million)
26. France Beverage Stabilizer Market, By Product, 2019-2032 (USD Million)
27. France Beverage Stabilizer Market, By Application, 2019-2032 (USD Million)
28. U.K. Beverage Stabilizer Market, By Product, 2019-2032 (USD Million)
29. U.K. Beverage Stabilizer Market, By Application, 2019-2032 (USD Million)
30. Italy Beverage Stabilizer Market, By Product, 2019-2032 (USD Million)
31. Italy Beverage Stabilizer Market, By Application, 2019-2032 (USD Million)
32. Spain Beverage Stabilizer Market, By Product, 2019-2032 (USD Million)
33. Spain Beverage Stabilizer Market, By Application, 2019-2032 (USD Million)
34. Asia Pacific Beverage Stabilizer Market, By Product, 2019-2032 (USD Million)
35. Asia Pacific Beverage Stabilizer Market, By Application, 2019-2032 (USD Million)
36. Japan Beverage Stabilizer Market, By Product, 2019-2032 (USD Million)
37. Japan Beverage Stabilizer Market, By Application, 2019-2032 (USD Million)
38. China Beverage Stabilizer Market, By Product, 2019-2032 (USD Million)
39. China Beverage Stabilizer Market, By Application, 2019-2032 (USD Million)
40. India Beverage Stabilizer Market, By Product, 2019-2032 (USD Million)
41. India Beverage Stabilizer Market, By Application, 2019-2032 (USD Million)
42. South America Beverage Stabilizer Market, By Product, 2019-2032 (USD Million)
43. South America Beverage Stabilizer Market, By Application, 2019-2032 (USD Million)
44. Brazil Beverage Stabilizer Market, By Product, 2019-2032 (USD Million)
45. Brazil Beverage Stabilizer Market, By Application, 2019-2032 (USD Million)
46. Middle East and Africa Beverage Stabilizer Market, By Product, 2019-2032 (USD Million)
47. Middle East and Africa Beverage Stabilizer Market, By Application, 2019-2032 (USD Million)
48. UAE Beverage Stabilizer Market, By Product, 2019-2032 (USD Million)
49. UAE Beverage Stabilizer Market, By Application, 2019-2032 (USD Million)
50. South Africa Beverage Stabilizer Market, By Product, 2019-2032 (USD Million)
51. South Africa Beverage Stabilizer Market, By Application, 2019-2032 (USD Million)
List of Figures
1. Global Beverage Stabilizer Market Segmentation
2. Global Beverage Stabilizer Market: Research Methodology
3. Market Size Estimation Methodology: Bottom-Up Approach
4. Market Size Estimation Methodology: Top-Down Approach
5. Data Triangulation
6. Porter’s Five Forces Analysis
7. Value Chain Analysis
8. Global Beverage Stabilizer Market Attractiveness Analysis By Product
9. Global Beverage Stabilizer Market Attractiveness Analysis By Application
10. Global Beverage Stabilizer Market Attractiveness Analysis By Region
11. Global Beverage Stabilizer Market: Dynamics
12. Global Beverage Stabilizer Market Share By Product (2023 & 2032)
13. Global Beverage Stabilizer Market Share By Application (2023 & 2032)
14. Global Beverage Stabilizer Market Share By Regions (2023 & 2032)
15. Global Beverage Stabilizer Market Share By Company (2022)
This study forecasts revenue at global, regional, and country levels from 2019 to 2032. The Brainy Insights has segmented the global Beverage Stabilizer market based on below mentioned segments:
Global Beverage Stabilizer Market by Product:
Global Beverage Stabilizer Market by Application:
Global Beverage Stabilizer by Region:
Research has its special purpose to undertake marketing efficiently. In this competitive scenario, businesses need information across all industry verticals; the information about customer wants, market demand, competition, industry trends, distribution channels etc. This information needs to be updated regularly because businesses operate in a dynamic environment. Our organization, The Brainy Insights incorporates scientific and systematic research procedures in order to get proper market insights and industry analysis for overall business success. The analysis consists of studying the market from a miniscule level wherein we implement statistical tools which helps us in examining the data with accuracy and precision.
Our research reports feature both; quantitative and qualitative aspects for any market. Qualitative information for any market research process are fundamental because they reveal the customer needs and wants, usage and consumption for any product/service related to a specific industry. This in turn aids the marketers/investors in knowing certain perceptions of the customers. Qualitative research can enlighten about the different product concepts and designs along with unique service offering that in turn, helps define marketing problems and generate opportunities. On the other hand, quantitative research engages with the data collection process through interviews, e-mail interactions, surveys and pilot studies. Quantitative aspects for the market research are useful to validate the hypotheses generated during qualitative research method, explore empirical patterns in the data with the help of statistical tools, and finally make the market estimations.
The Brainy Insights offers comprehensive research and analysis, based on a wide assortment of factual insights gained through interviews with CXOs and global experts and secondary data from reliable sources. Our analysts and industry specialist assume vital roles in building up statistical tools and analysis models, which are used to analyse the data and arrive at accurate insights with exceedingly informative research discoveries. The data provided by our organization have proven precious to a diverse range of companies, facilitating them to address issues such as determining which products/services are the most appealing, whether or not customers use the product in the manner anticipated, the purchasing intentions of the market and many others.
Our research methodology encompasses an idyllic combination of primary and secondary initiatives. Key phases involved in this process are listed below:

The phase involves the gathering and collecting of market data and its related information with the help of different sources & research procedures.

The data procurement stage involves in data gathering and collecting through various data sources.
This stage involves in extensive research. These data sources includes:
Purchased Database: Purchased databases play a crucial role in estimating the market sizes irrespective of the domain. Our purchased database includes:
Primary Research: The Brainy Insights interacts with leading companies and experts of the concerned domain to develop the analyst team’s market understanding and expertise. It improves and substantiates every single data presented in the market reports. Primary research mainly involves in telephonic interviews, E-mail interactions and face-to-face interviews with the raw material providers, manufacturers/producers, distributors, & independent consultants. The interviews that we conduct provides valuable data on market size and industry growth trends prevailing in the market. Our organization also conducts surveys with the various industry experts in order to gain overall insights of the industry/market. For instance, in healthcare industry we conduct surveys with the pharmacists, doctors, surgeons and nurses in order to gain insights and key information of a medical product/device/equipment which the customers are going to usage. Surveys are conducted in the form of questionnaire designed by our own analyst team. Surveys plays an important role in primary research because surveys helps us to identify the key target audiences of the market. Additionally, surveys helps to identify the key target audience engaged with the market. Our survey team conducts the survey by targeting the key audience, thus gaining insights from them. Based on the perspectives of the customers, this information is utilized to formulate market strategies. Moreover, market surveys helps us to understand the current competitive situation of the industry. To be precise, our survey process typically involve with the 360 analysis of the market. This analytical process begins by identifying the prospective customers for a product or service related to the market/industry to obtain data on how a product/service could fit into customers’ lives.

Secondary Research: The secondary data sources includes information published by the on-profit organizations such as World bank, WHO, company fillings, investor presentations, annual reports, national government documents, statistical databases, blogs, articles, white papers and others. From the annual report, we analyse a company’s revenue to understand the key segment and market share of that organization in a particular region. We analyse the company websites and adopt the product mapping technique which is important for deriving the segment revenue. In the product mapping method, we select and categorize the products offered by the companies catering to domain specific market, deduce the product revenue for each of the companies so as to get overall estimation of the market size. We also source data and analyses trends based on information received from supply side and demand side intermediaries in the value chain. The supply side denotes the data gathered from supplier, distributor, wholesaler and the demand side illustrates the data gathered from the end customers for respective market domain.

The supply side for a domain specific market is analysed by:
The demand side for the market is estimated through:
In-house Library: Apart from these third-party sources, we have our in-house library of qualitative and quantitative information. Our in-house database includes market data for various industry and domains. These data are updated on regular basis as per the changing market scenario. Our library includes, historic databases, internal audit reports and archives.
Sometimes there are instances where there is no metadata or raw data available for any domain specific market. For those cases, we use our expertise to forecast and estimate the market size in order to generate comprehensive data sets. Our analyst team adopt a robust research technique in order to produce the estimates:
Data Synthesis: This stage involves the analysis & mapping of all the information obtained from the previous step. It also involves in scrutinizing the data for any discrepancy observed while data gathering related to the market. The data is collected with consideration to the heterogeneity of sources. Robust scientific techniques are in place for synthesizing disparate data sets and provide the essential contextual information that can orient market strategies. The Brainy Insights has extensive experience in data synthesis where the data passes through various stages:


Market Deduction & Formulation: The final stage comprises of assigning data points at appropriate market spaces so as to deduce feasible conclusions. Analyst perspective & subject matter expert based holistic form of market sizing coupled with industry analysis also plays a crucial role in this stage.
This stage involves in finalization of the market size and numbers that we have collected from data integration step. With data interpolation, it is made sure that there is no gap in the market data. Successful trend analysis is done by our analysts using extrapolation techniques, which provide the best possible forecasts for the market.
Data Validation & Market Feedback: Validation is the most important step in the process. Validation & re-validation via an intricately designed process helps us finalize data-points to be used for final calculations.

The Brainy Insights interacts with leading companies and experts of the concerned domain to develop the analyst team’s market understanding and expertise. It improves and substantiates every single data presented in the market reports. The data validation interview and discussion panels are typically composed of the most experienced industry members. The participants include, however, are not limited to:
Moreover, we always validate our data and findings through primary respondents from all the major regions we are working on.
Free Customization
Fortune 500 Clients
Free Yearly Update On Purchase Of Multi/Corporate License
Companies Served Till Date